0683
Probing lactate exchange in Gray Matter via time-dependent DW-MRS1Université Paris-Saclay, CEA, CNRS, MIRCen, Laboratoire des Maladies Neurodégénératives, Fontenay-aux-roses, France, 2Cardiff University Brain Research Imaging Centre (CUBRIC), School of Psychology, Cardiff University, Cardiff, United Kingdom, 3School of Computer Science and Informatics, Cardiff University, Cardiff, United Kingdom
Synopsis
Keywords: Microstructure, Diffusion/other diffusion imaging techniques
Time-dependent DW-MRS can probe the underlying tissue microstructure. However, it has been previously shown that time-dependent apparent diffusivity and apparent kurtosis exhibit different behaviors for water and intracellular metabolite. These differences may be largely explained by exchange between intra- and extracellular spaces occurring for water. The aim of this work is to measure time-dependent diffusion of lactate which, like water, is present in and exchanges between both compartments, but for which the exchange rate is unknown. Comparison with water and intracellular metabolites indicates that lactate exchange is slow (relative to the probed diffusion times up to 500 ms).
Introduction
Time-dependent diffusion1–9, and particularly time-dependent DW-MRS10,11, are powerful tools to probe gray matter microstructure, and exchange between intra- and extracellular spaces (ICS and ECS)12,13. Apparent diffusivity and apparent kurtosis of water as a function of diffusion time (DW(td)/KW (td)) carry information about both short-range structural disorder14,15 of the ECS and ICS, and exchange between them. In contrast, diffusivity and kurtosis of intracellular metabolites as a function of td (DM(td)/KM(td)) appears to be dominated by restriction11,16. The role of exchange seems crucial in explaining the different “functional forms” of D(td)/K(td) and, vice versa, characterizing such form may help evaluating the exchange rate.A highly relevant biological question is that of lactate exchange in the brain. Such exchange, which takes place through monocarboxylate transporters17,18, is crucial for the still controversial astrocyte-to-neuron lactate shuttle hypothesis19. However, lactate exchange rate is unknown. In this work, we aim at measuring lactate time-dependent apparent diffusivity and kurtosis DL(td)/KL(td), to estimate whether lactate exchange time is short or long relative to the probed diffusion times.
Method
Three anesthetized C57/BL6 wild-type mice (Isoflurane ~1.0%) were scanner on an 11.7 T Bruker Biospec equipped with a cryoprobe, using a diffusion-weighted-STE-LASER sequence20, with TE/TR=33.4/2500 ms; δ=3.0 ms. Diffusion gradient direction was changed at each repetition to perform powder-averaging. Water and metabolites spectra were acquired in the same 63-µL voxel, containing mainly GM ([GM,WM,CSF] ~ [90%, 5%, 5%] ) around the hippocampus.Water spectra were acquired with 8 repetitions at b=[0.2; 0.6; 1.2; 2.0; 2.5] ms/µm2, for each td=[12.2; 15.5; 20.8; 30; 42.5; 100; 250; 500] ms.
Metabolites spectra were obtained for each td=[42.5; 100; 250; 500] ms, in two blocks of 32 repetitions and with b=[0.2; 0.9; 1.9; 3.2; 4.3; 6.9; 8.0] ms/µm2.
Spectra were analyzed with LCModel21 (including experimental MM spectra in the basis-sets) to estimate metabolite concentrations at each b and td. For water, the peak integral was computed.
Water and metabolites time-dependent apparent diffusivity D(td) and kurtosis K(td) were estimated by fitting to the corresponding diffusion-weighted signal S as a function of b at each td the following equation22:
$$S(b,td) = S(b = 0,td) exp(-b D(td) + \frac{1}{6} K(td) (b D(td))^2)$$.
Results and discussion
Exchange between ICS and ECS and 2D/3D structural disorder govern water time-dependence.KW(td) decreases (Fig1) and almost reaches a plateau around 0.6, in line with previous findings in GM11,12. DW(td) decreases significantly and both DW(td) and KW(t) follow the same ln(td/tc)/td (with a correlation time tc ~ 6 ms) suggesting that 2D/3D short-range structural disorder dominates DW(td)/KW(td) at the probed td8,14,22. This is a signature of ECS, whereas ICS would result in 1D structural disorder (assuming that, for the ICS, most of the signal comes from thin cellular projections). As 1D short-range structural disorder exhibits a slowest decay, it should dominate8,14 in the absence of exchange. The fact that 2D/3D dominates is consistent with the idea that all water molecules actually experience 2D/3D disorder, i.e. they are not confined in ICS. Contribution of ICS would somehow be masked by rapid water exchange between ECS and ICS.
Intracellular metabolite time-dependence reflects the absence of exchange.
Spectral quality even at the longest td can be appreciated on Fig.2. DM(td) decreases and KM(td) increases for all intracellular metabolites (Fig3), consistently with previous results11. KM is much larger than KW, due to restriction within cells. As a matter of fact, a model describing diffusion within cylinders and spheres (with respective volume fractions of 80% and 20%) fits the data well (Fig 3) and yields realistic microstructural parameters. Hence, the behavior of KM(td) (and DM(td)) is solely explained by intracellular restriction, without exchange.
The specific lactate time-dependence indicates a slow exchange between ICS and ECS.
Lactate signal is intense enough to allow precise estimation with LCModel (CRLB < 8% even for the highest b-value at longest td). For lactate, DL(td) (Fig4) decreases slightly, but remains much larger than for intracellular metabolites, indicating a contribution from extracellular space, as well as larger free diffusivity due to smaller molecular size. KL(td) is also smaller than Km(td), suggesting that lactate is less confined (which may reflect the extracellular contribution). Most importantly, KL(td) is much larger than KW(td) (e.g. >1.2 for lactate versus <0.8 for water), and KL(td) increases slightly, indicating that restriction still affects KL(td), unlike for water. Finally, the simple restriction model does not fit the lactate KL(td), thus a more complex model will be needed to fit this specific time-dependence of lactate, e.g. by adding an extracellular pool. Compared to time dependencies of water and metabolites, this specific behavior suggests that the typical exchange time of lactate between ICS and ECS is longer than the probed td, and much longer than water exchange time (Fig 5).
Conclusion
This work shows that time-dependent Kurtosis of lactate can be measured by DW-MRS in vivo, and that KL(td) exhibits specific behavior indicating long exchange time longer than 500 ms. Beyond insights in terms of fundamental physiology, time-dependence of lactate kurtosis may allow assessing alterations of lactate exchange between ICS and ECS in some conditions (e.g. during brain stimulation or in pathologies).Acknowledgements
This project has received funding from the European Research Council (ERC) under the European Union’s Horizon 2020 research and innovation programs (grant agreement n° 818266). 11.7 T scanner was funded by NeurATRIS (“Investissements d'Avenir”, ANR-11-INBS-0011). MP is supported by UKRI Future Leaders Fellowship MR/T020296/2.References
1. Aggarwal, M., Burnsed, J., Martin, L. J., Northington, F. J. & Zhang, J. Imaging neurodegeneration in the mouse hippocampus after neonatal hypoxia–ischemia using oscillating gradient diffusion MRI. Magnetic Resonance in Medicine 72, 829–840 (2014).
2. Arbabi, A., Kai, J., Khan, A. R. & Baron, C. A. Diffusion dispersion imaging: Mapping oscillating gradient spin-echo frequency dependence in the human brain. Magnetic Resonance in Medicine 83, 2197–2208 (2020).
3. Baron, C. A. & Beaulieu, C. Oscillating gradient spin-echo (OGSE) diffusion tensor imaging of the human brain. Magnetic Resonance in Medicine 72, 726–736 (2014).
4. Does, M. D., Parsons, E. C. & Gore, J. C. Oscillating gradient measurements of water diffusion in normal and globally ischemic rat brain. Magnetic Resonance in Medicine 49, 206–215 (2003).
5. Wu, D., Martin, L. J., Northington, F. J. & Zhang, J. Oscillating gradient diffusion MRI reveals unique microstructural information in normal and hypoxia-ischemia injured mouse brains. Magnetic Resonance in Medicine 72, 1366–1374 (2014).
6. Aggarwal, M., Smith, M. D. & Calabresi, P. A. Diffusion-time dependence of diffusional kurtosis in the mouse brain. Magnetic Resonance in Medicine 84, 1564–1578 (2020).
7. Pyatigorskaya, N., Le Bihan, D., Reynaud, O. & Ciobanu, L. Relationship between the diffusion time and the diffusion MRI signal observed at 17.2 tesla in the healthy rat brain cortex. Magnetic Resonance in Medicine 72, 492–500 (2014).
8. Lee, H.-H., Papaioannou, A., Novikov, D. S. & Fieremans, E. In vivo observation and biophysical interpretation of time-dependent diffusion in human cortical gray matter. NeuroImage 222, 117054 (2020).
9. Wu, D., Li, Q., Northington, F. J. & Zhang, J. Oscillating gradient diffusion kurtosis imaging of normal and injured mouse brains. NMR in Biomedicine 31, e3917 (2018).
10. Valette, J., Ligneul, C., Marchadour, C., Najac, C. & Palombo, M. Brain Metabolite Diffusion from Ultra-Short to Ultra-Long Time Scales: What Do We Learn, Where Should We Go? Front. Neurosci. 12, 2 (2018).
11. Mougel, E., Valette, J. & Palombo, M. Investigating exchange, structural disorder and restriction in Gray Matter via water and metabolites diffusivity and kurtosis time-dependence. in Proc. Intl. Soc. Mag. Reson. Med. 31 0255 (2022).
12. Jelescu, I. O., de Skowronski, A., Palombo, M. & Novikov, D. S. Neurite Exchange Imaging (NEXI): A minimal model of diffusion in gray matter with inter-compartment water exchange. arXiv:2108.06121 [physics] (2021).
13. Olesen, J. L., Østergaard, L., Shemesh, N. & Jespersen, S. N. Diffusion time dependence, power-law scaling, and exchange in gray matter. NeuroImage 251, 118976 (2022).
14. Novikov, D. S., Jensen, J. H., Helpern, J. A. & Fieremans, E. Revealing mesoscopic structural universality with diffusion. Proceedings of the National Academy of Sciences 111, 5088–5093 (2014).
15. Palombo, M., Shemesh, N., Ronen, I. & Valette, J. Insights into brain microstructure from in vivo DW-MRS. NeuroImage 182, 97–116 (2018).
16. Palombo, M. et al. New paradigm to assess brain cell morphology by diffusion-weighted MR spectroscopy in vivo. Proc Natl Acad Sci U S A 113, 6671–6676 (2016).
17. Halestrap, A. P. & Wilson, M. C. The monocarboxylate transporter family—Role and regulation. IUBMB Life 64, 109–119 (2012).
18. Pierre, K., Pellerin, L., Debernardi, R., Riederer, B. M. & Magistretti, P. J. Cell-specific localization of monocarboxylate transporters, MCT1 and MCT2, in the adult mouse brain revealed by double immunohistochemical labeling and confocal microscopy. Neuroscience 100, 617–627 (2000).
19. Pellerin, L. & Magistretti, P. J. Glutamate uptake into astrocytes stimulates aerobic glycolysis: a mechanism coupling neuronal activity to glucose utilization. PNAS 91, 10625–10629 (1994).
20. Ligneul, C., Palombo, M. & Valette, J. Metabolite diffusion up to very high b in the mouse brain in vivo: Revisiting the potential correlation between relaxation and diffusion properties. Magn Reson Med 77, 1390–1398 (2017).
21. Provencher, S. W. Automatic quantitation of localized in vivo 1H spectra with LCModel. NMR in Biomedicine 14, 260–264 (2001).
22. Jensen, J. H. & Helpern, J. A. Quantifying Non-Gaussian Water Diffusion by Means of Pulsed-Field-Gradient MRI. in Proc. Intl. Soc. Mag. Reson. Med. 13 2154 (2003).
23. Burcaw, L. M., Fieremans, E. & Novikov, D. S. Mesoscopic structure of neuronal tracts from time-dependent diffusion. NeuroImage 114, 18–37 (2015).
Figures
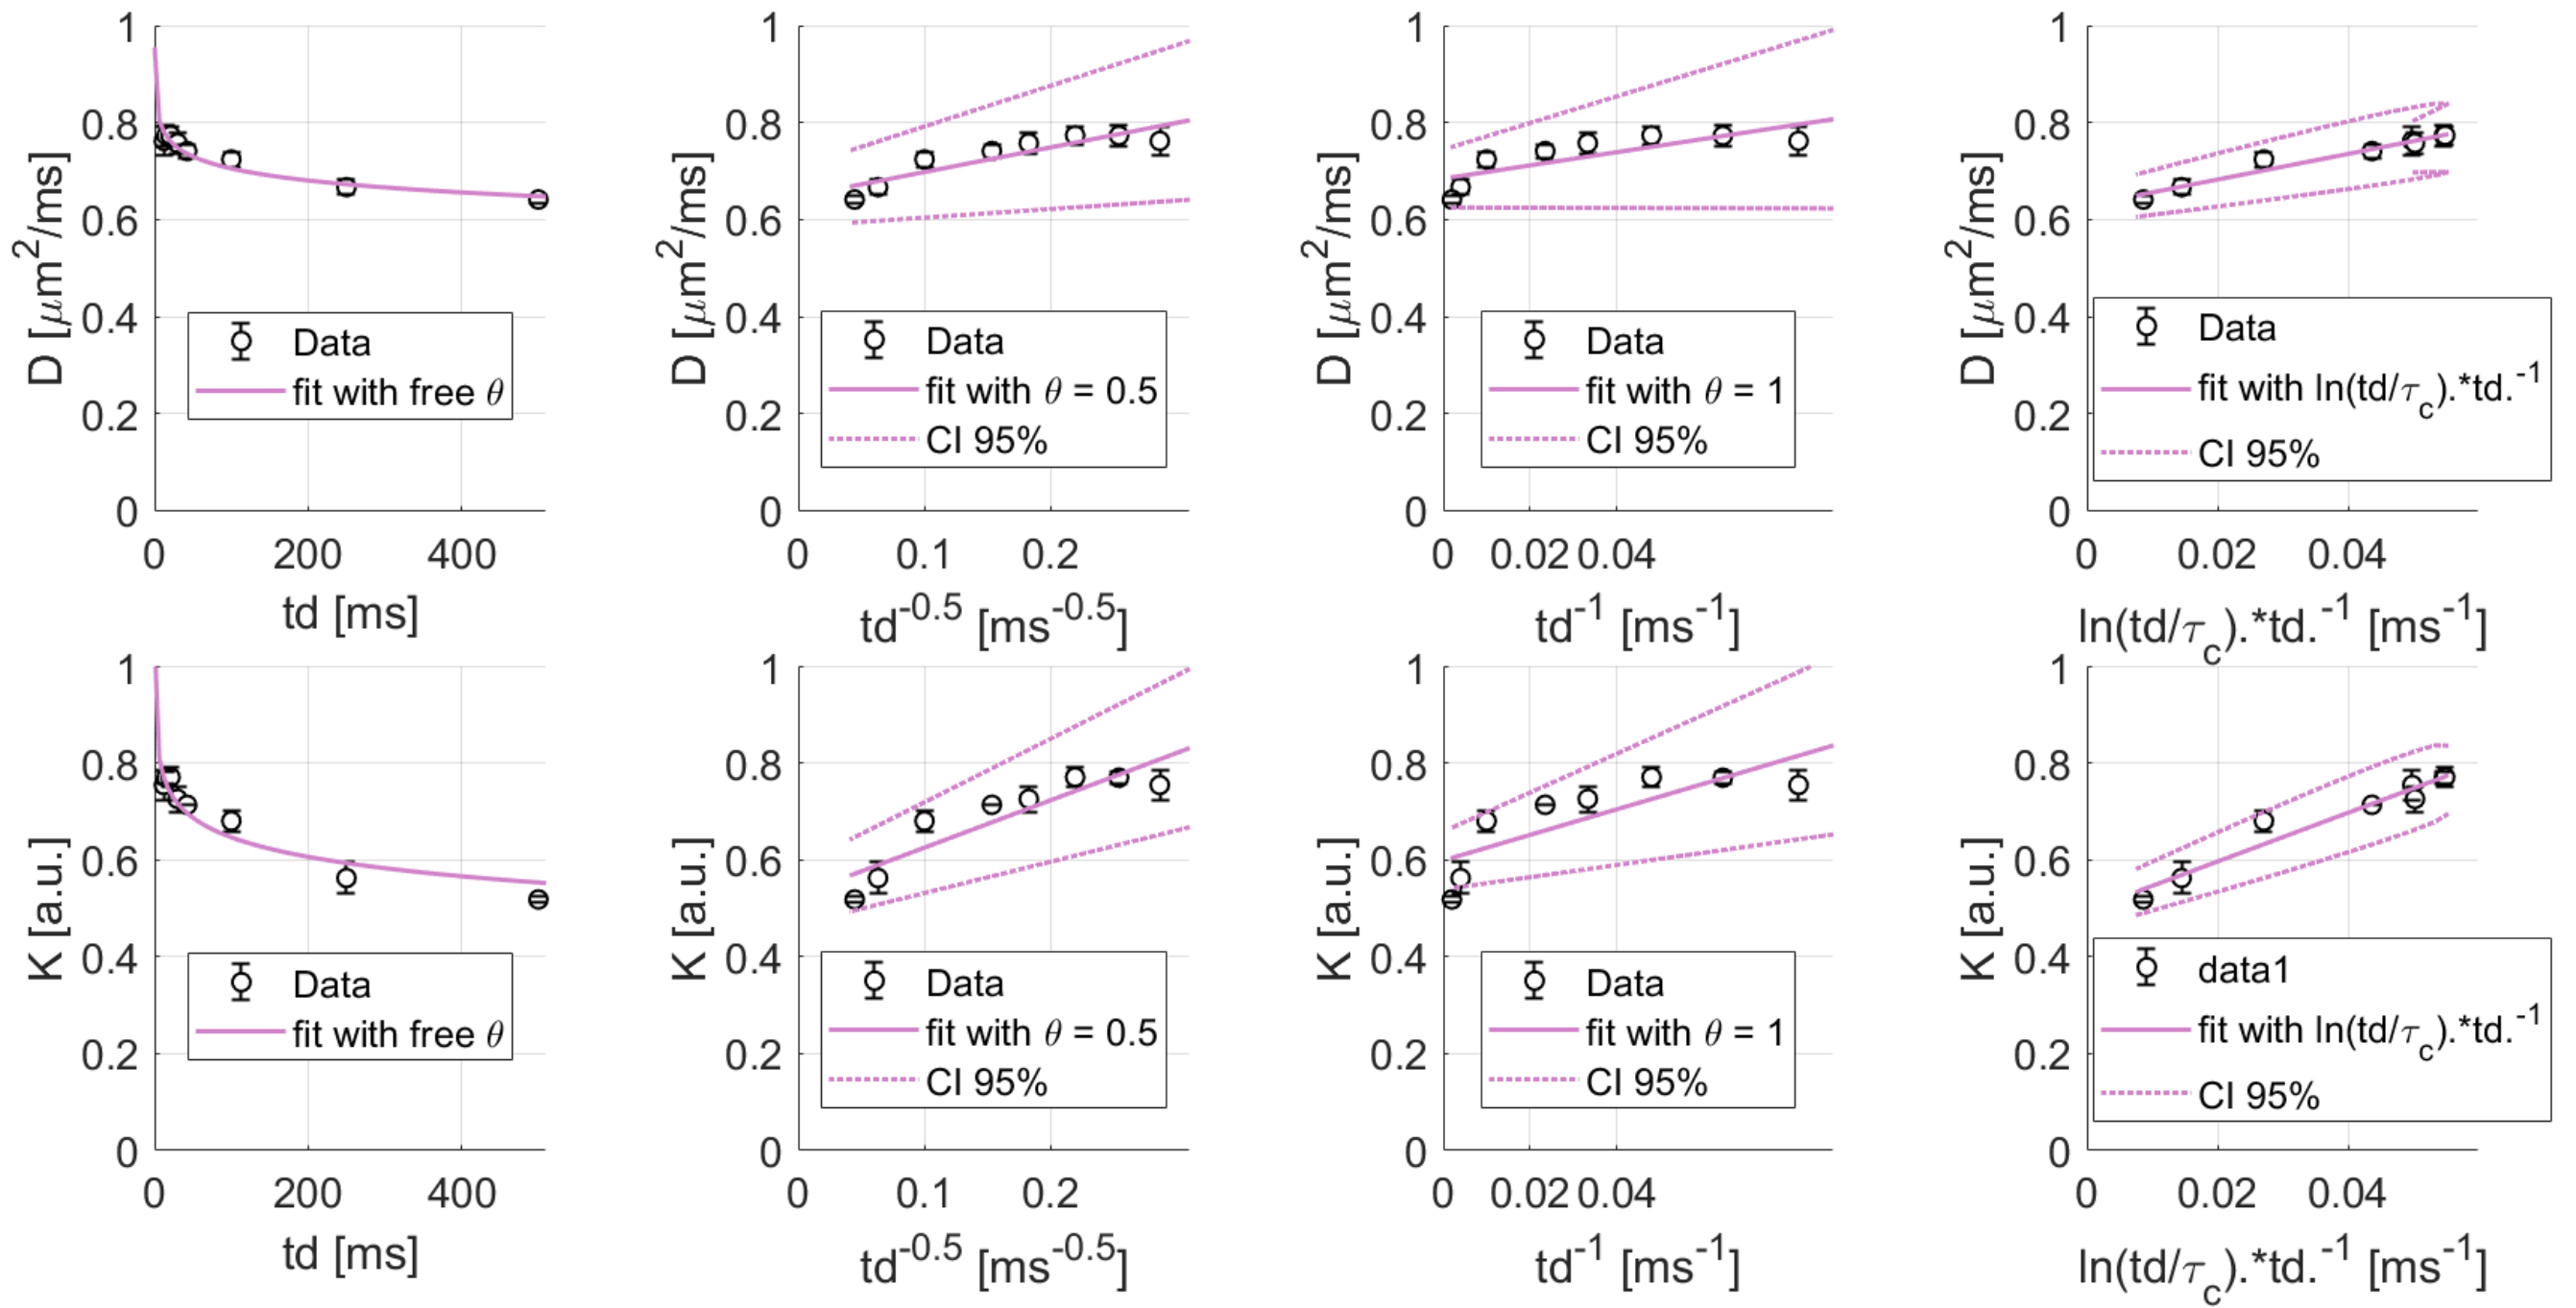
Figure 1: Averages of D and K of water as a function of diffusion time over the 3 mice (black), and best fits using different functional forms (purple). 3 left columns represent fits with a power law decay respectively with a free exponent, an exponent 0.5 and 1 from the left to the right respectively, and the right columns represents a fit with ln(td/tc)/td.
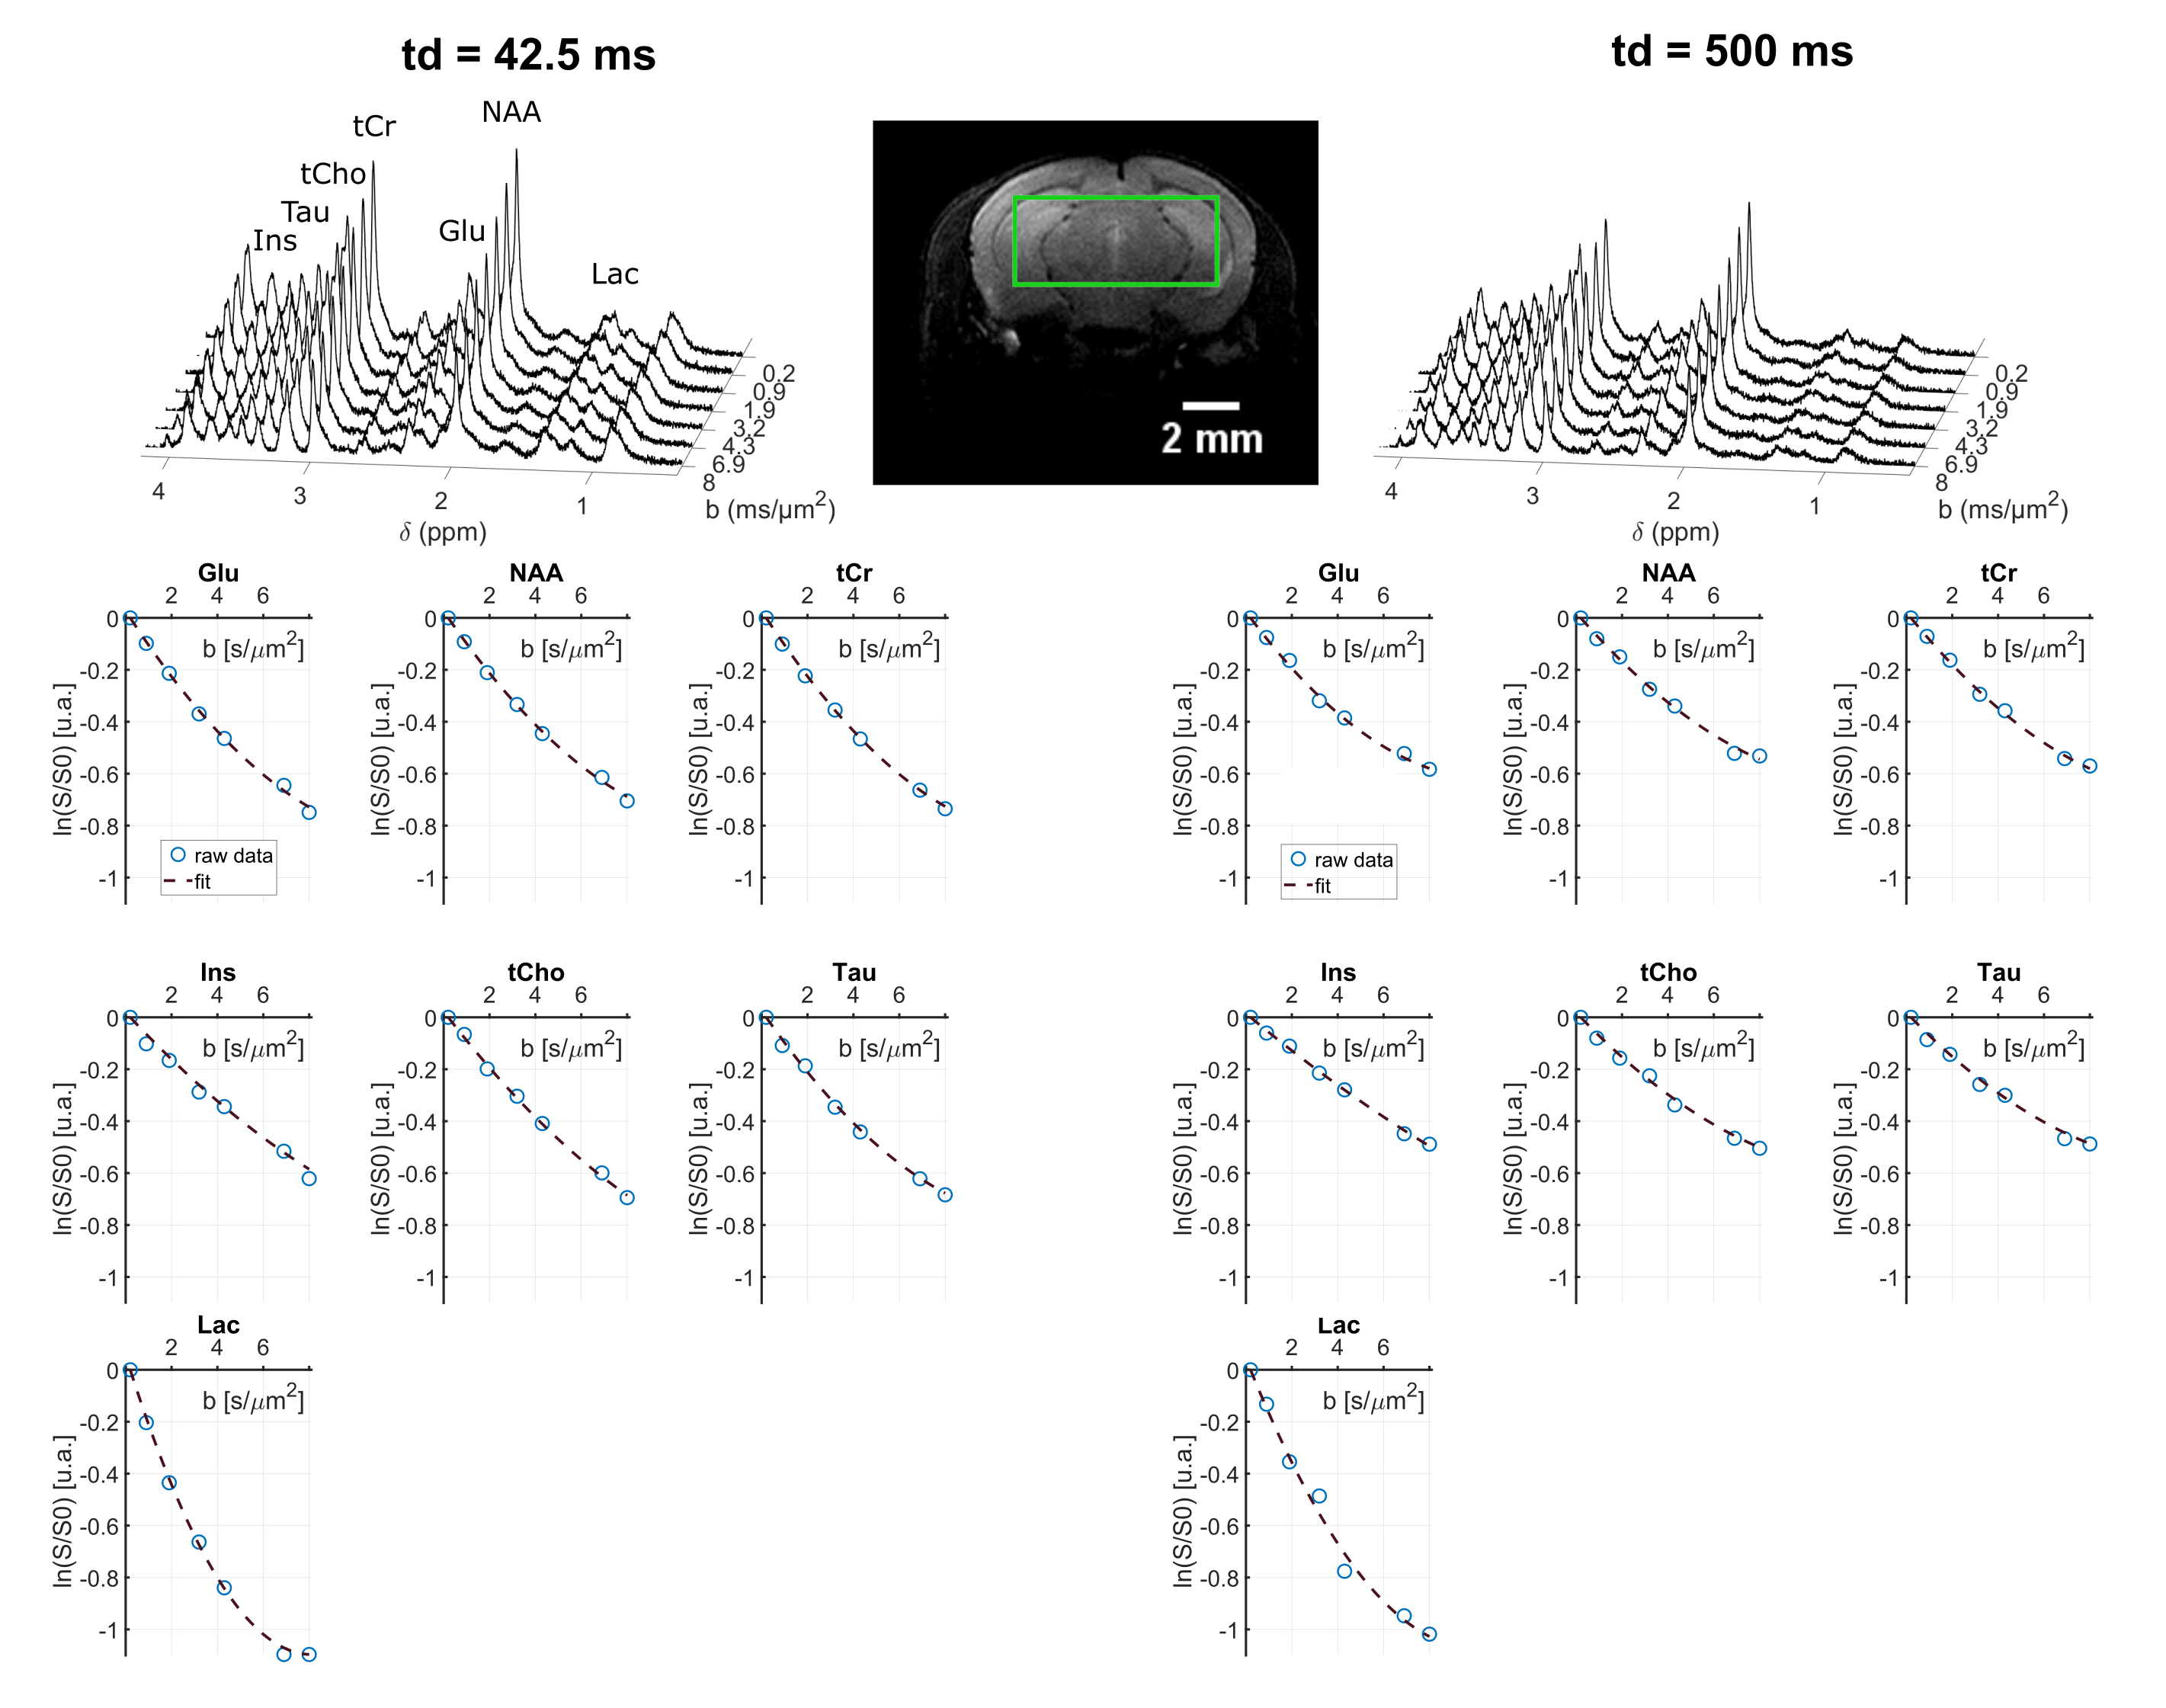
Figure 2: Upper panel: example of metabolite spectra for two different diffusion times, acquired in one mouse, in a 63-µL voxel (shown on the image). Lower panel: example of signal attenuation as a function of b and data fitting with the kurtosis representation, in a single mouse.
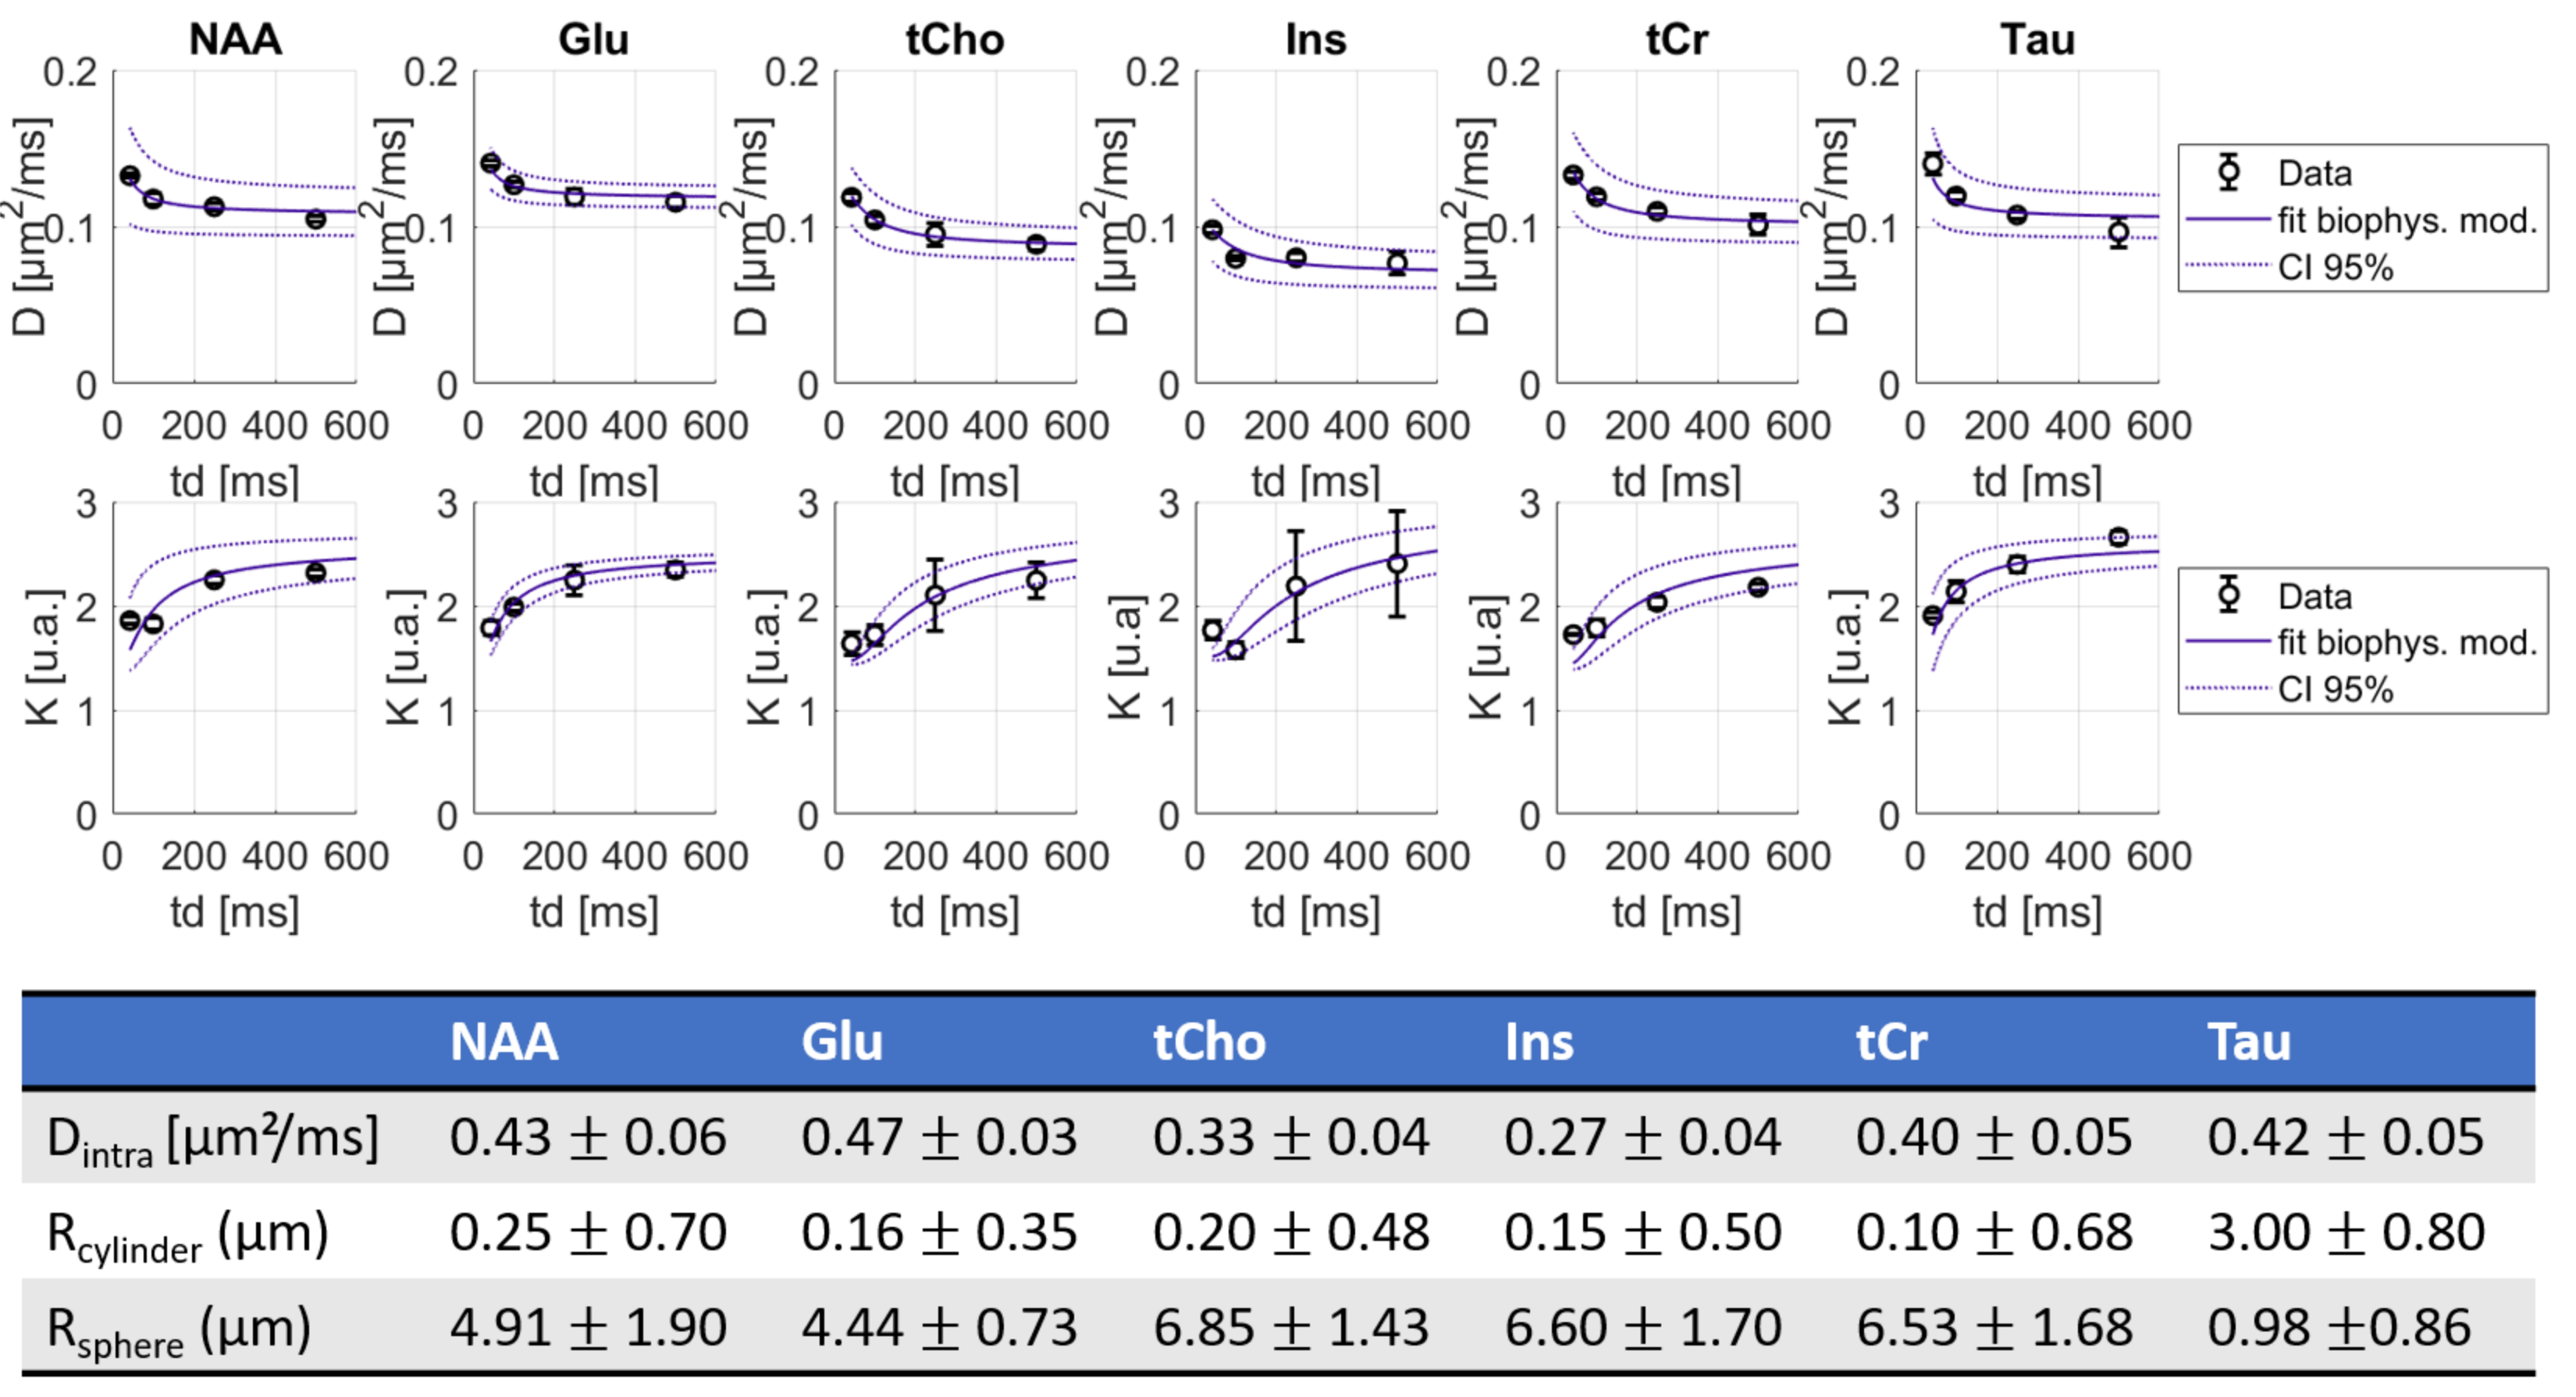
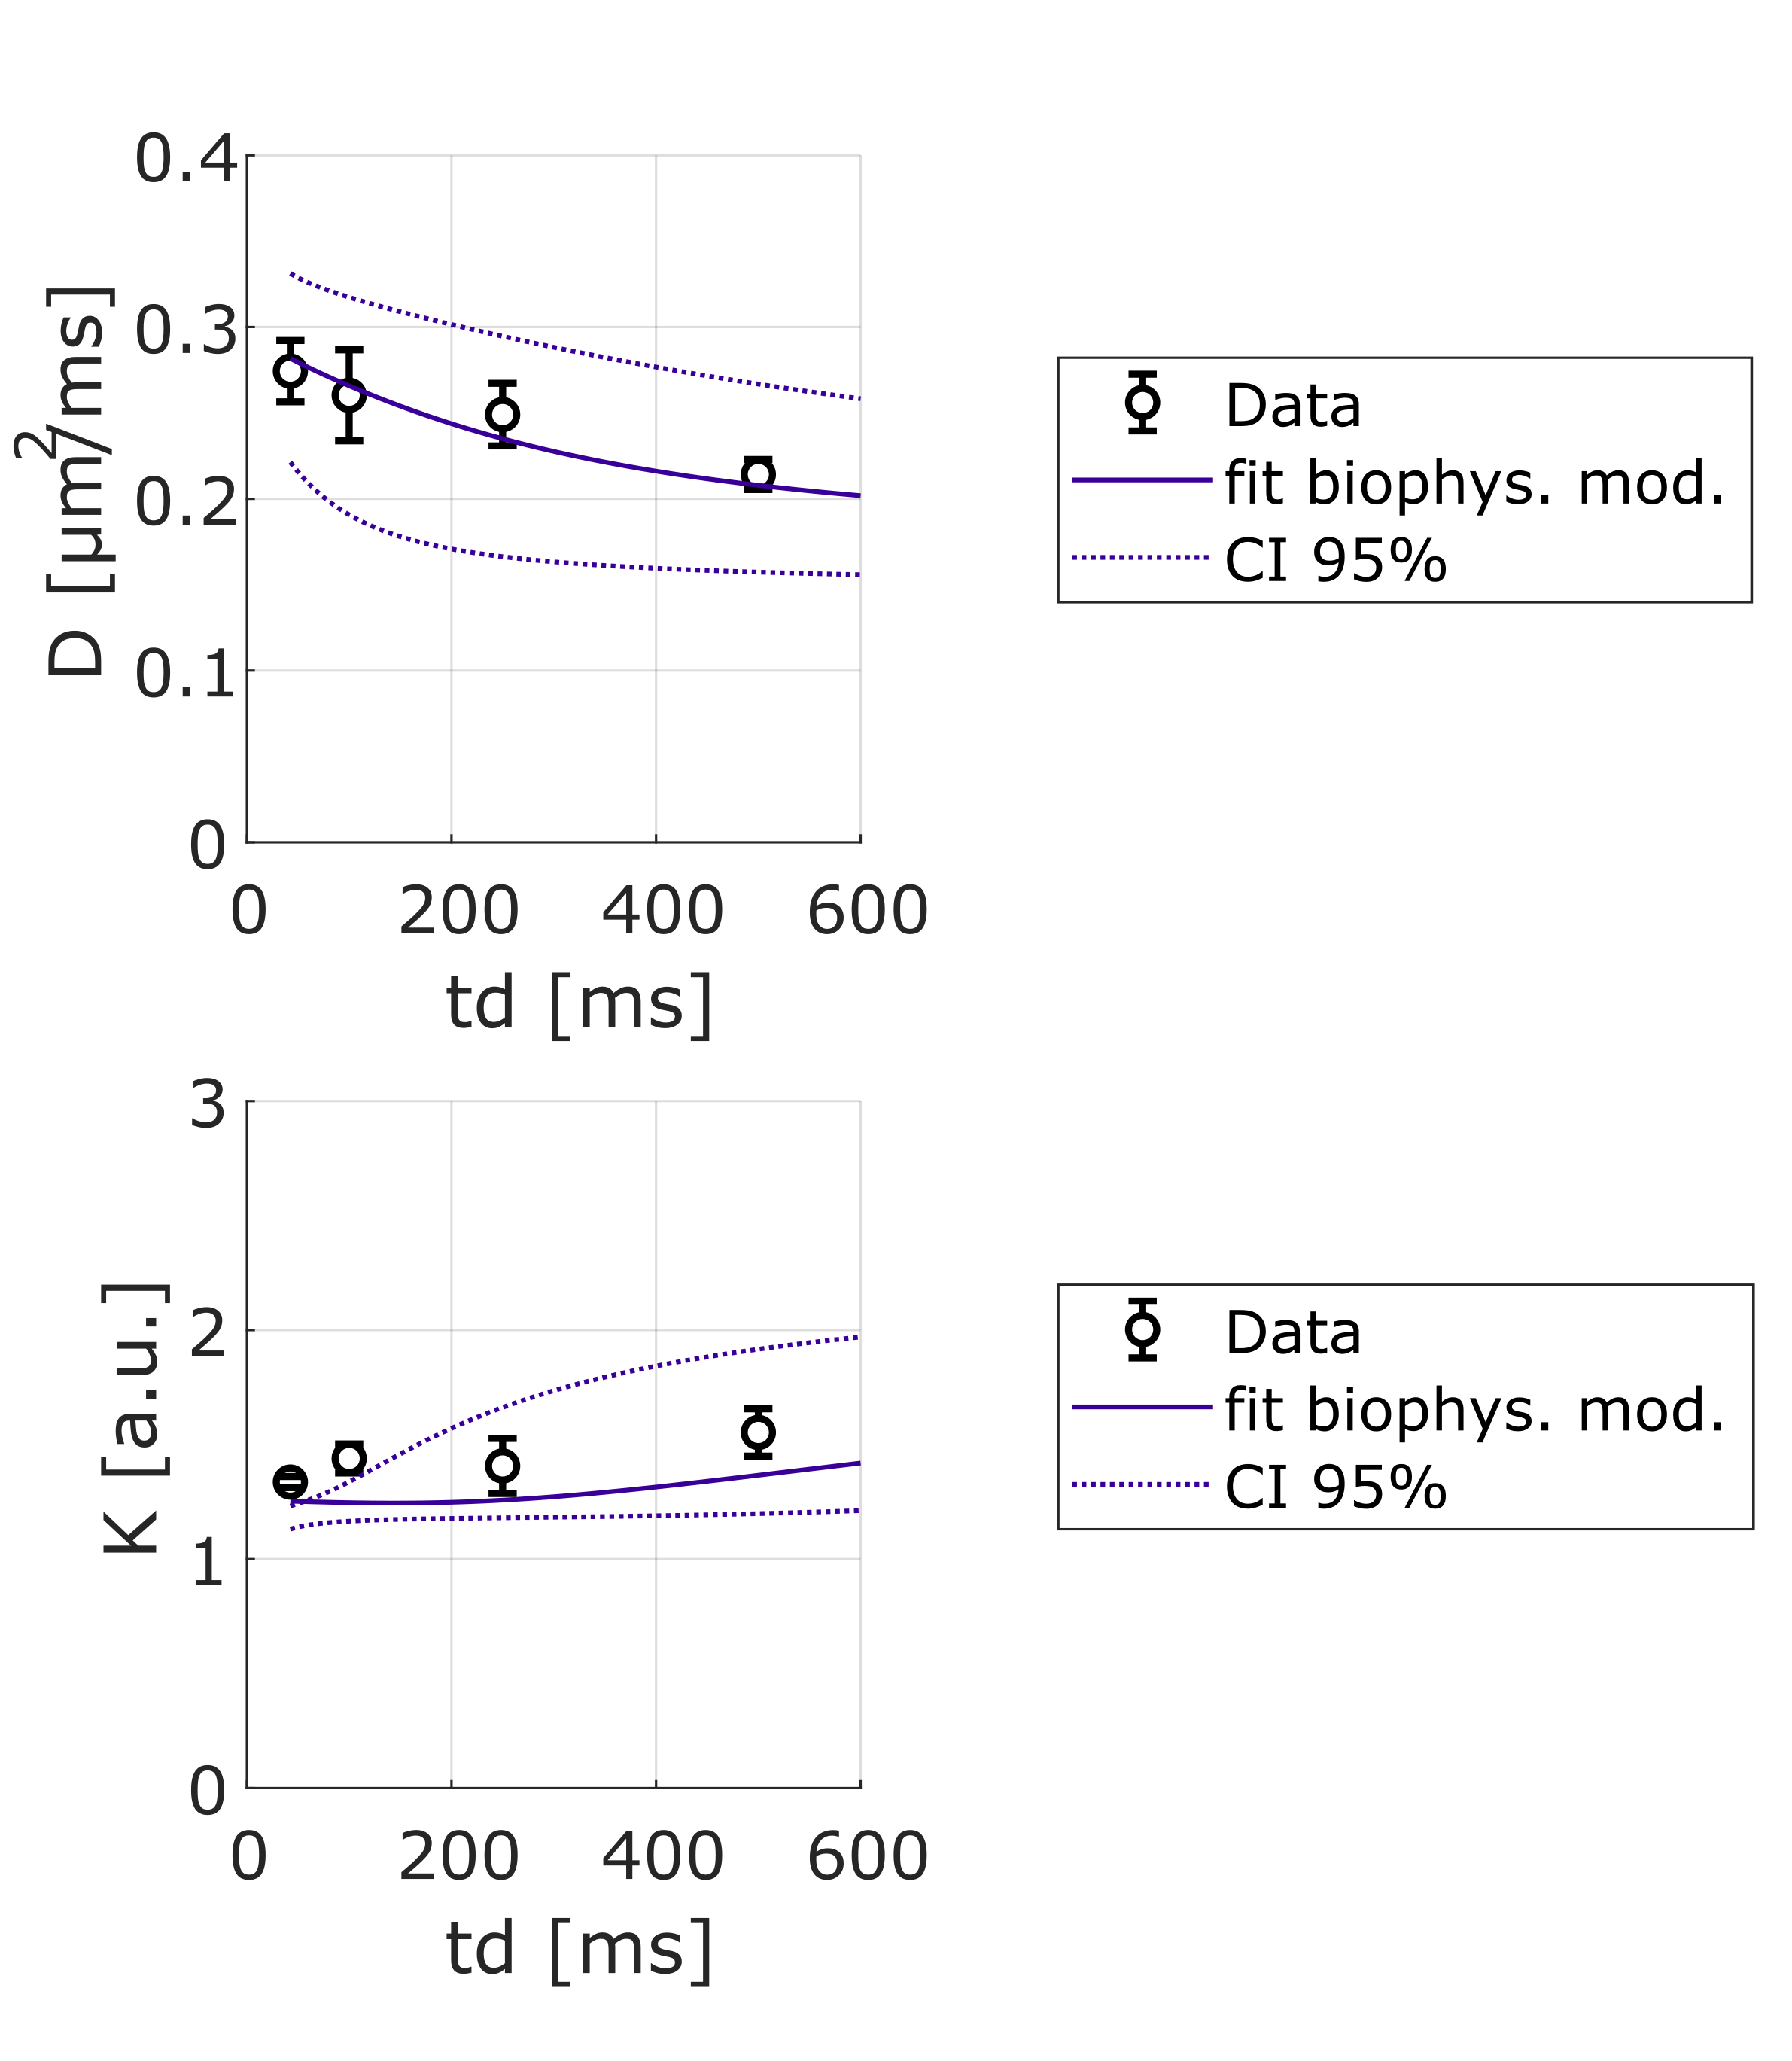
Figure 4: Averages of DL and KL as a function of diffusion time over 3 mice and best fit using a restriction model (including 80% cylinders + 20% spheres). The model needs to be improved to fit the data well.
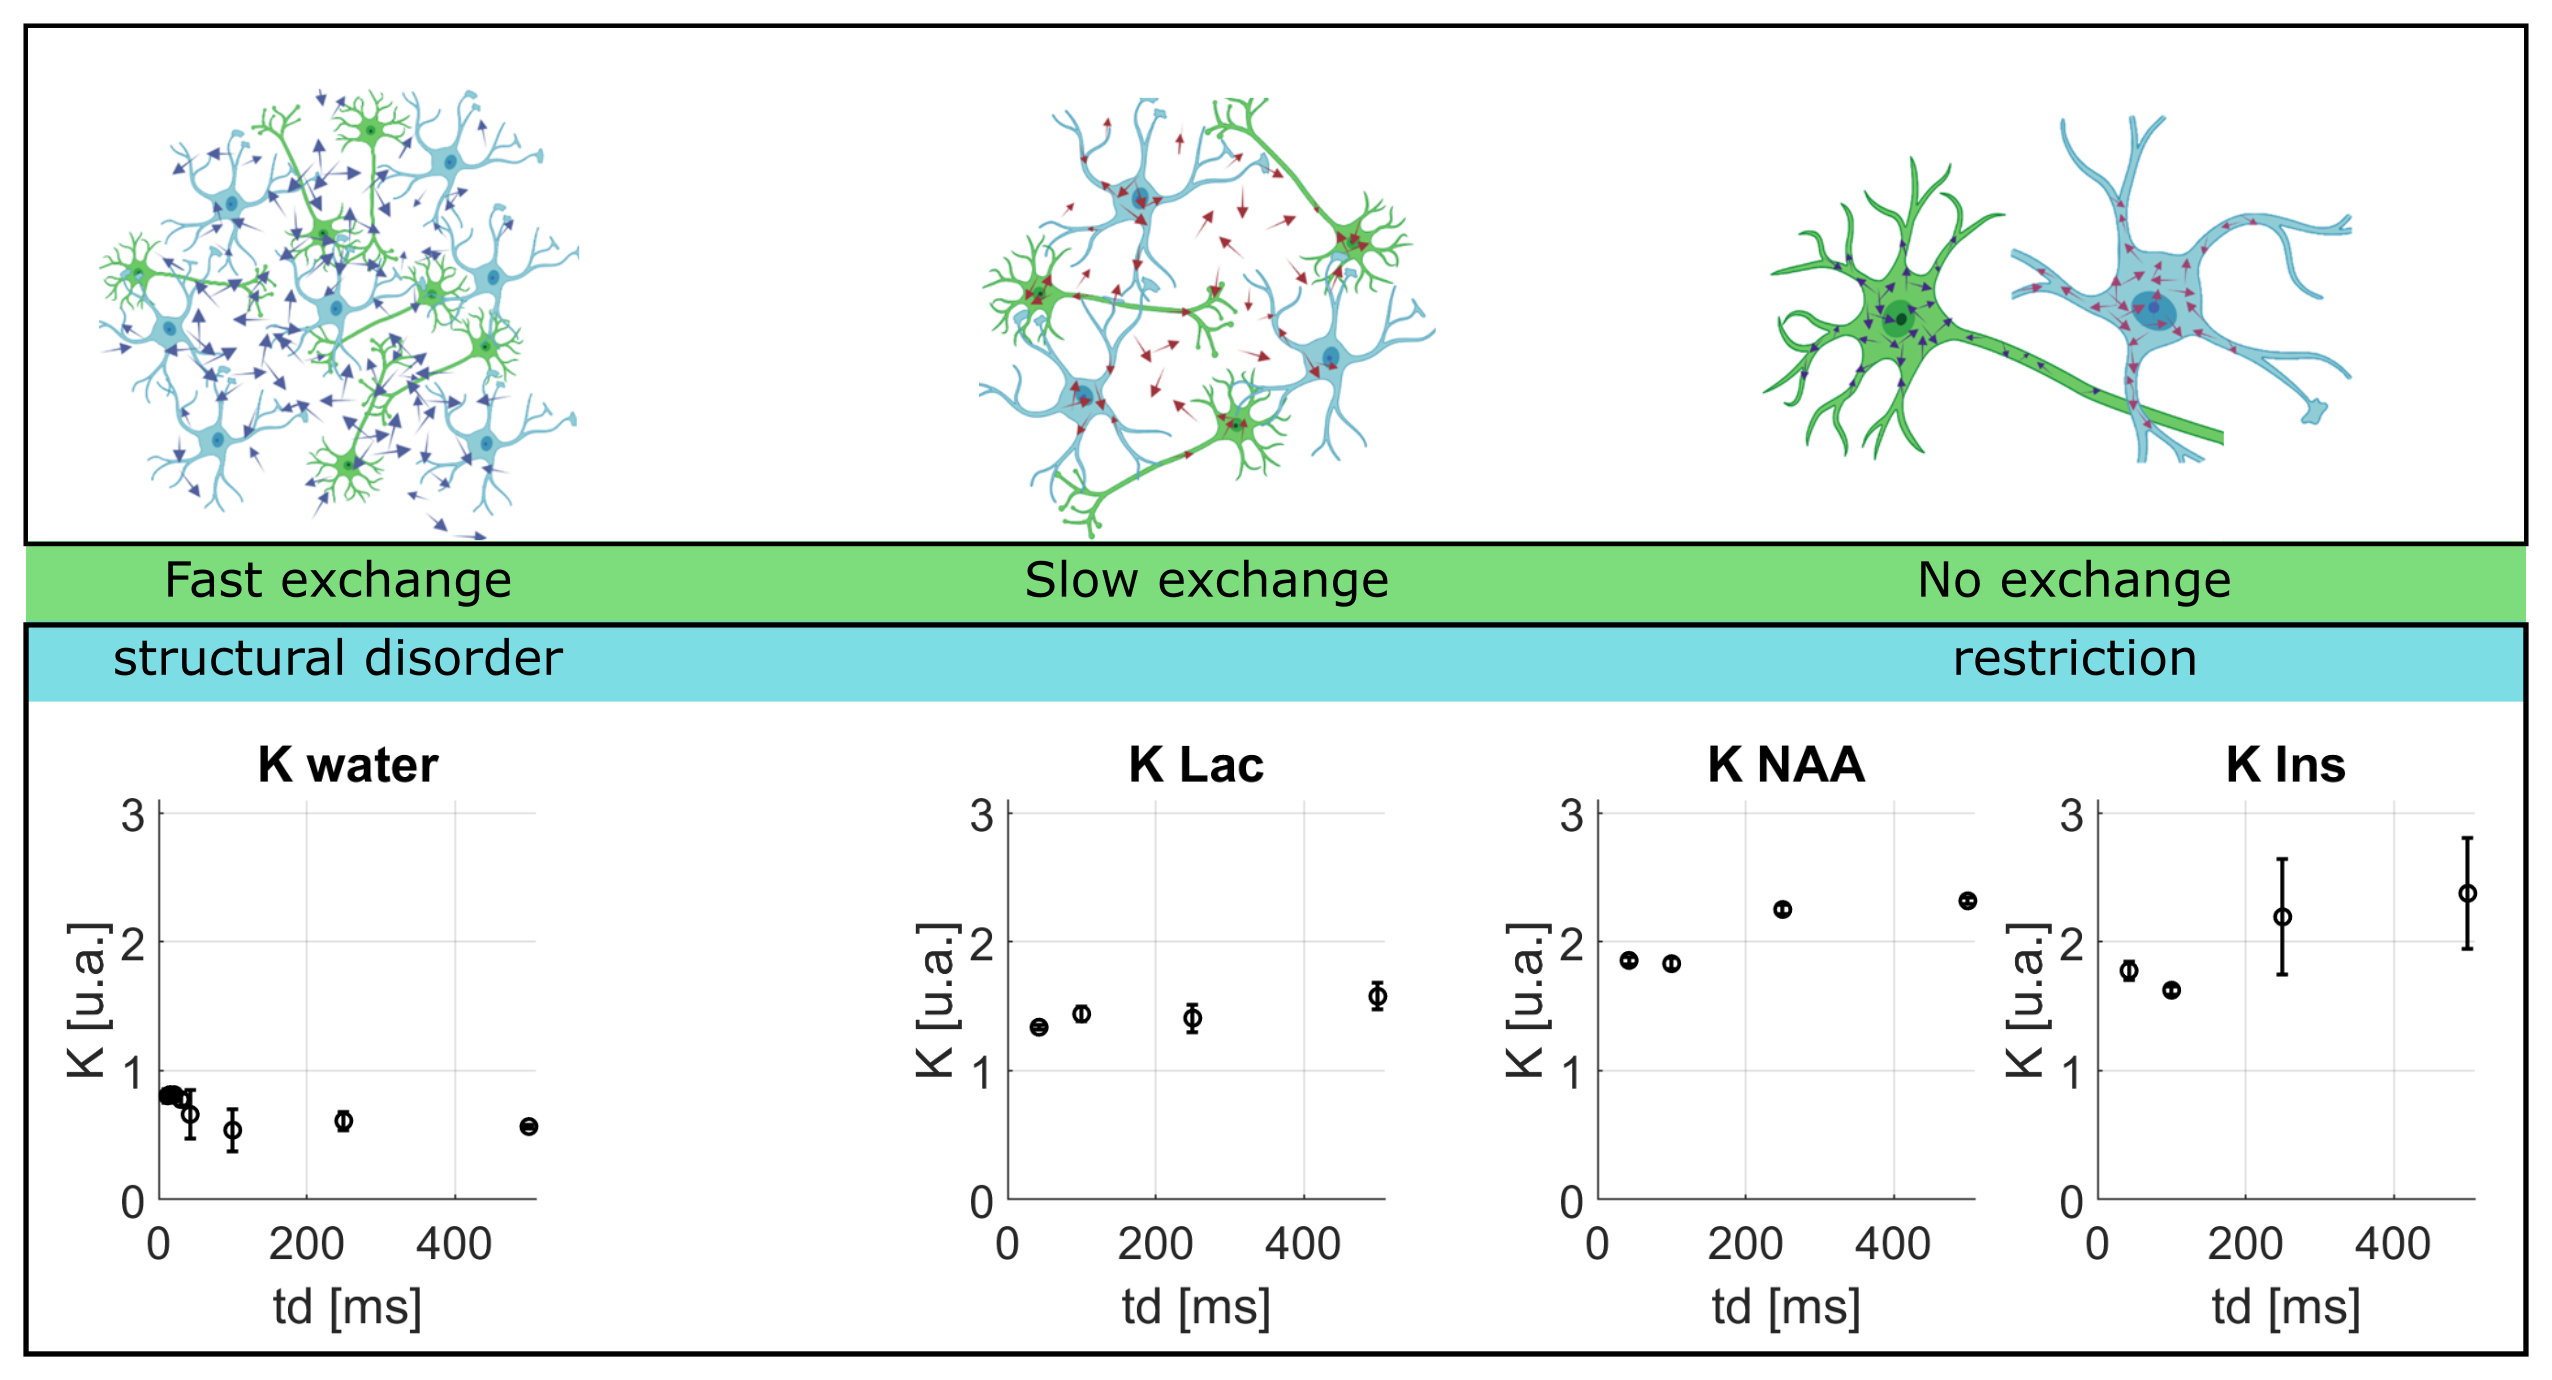
Figure 5: Upper panel (from left to right): cartoon depicting the diffusion of water, lactate NAA and Ins. Lower panel: K(td) corresponding to each metabolite listed above to illustrate the effect of exchange on diffusion as a function of time. (Astrocytes and neurons designs created with BioRender)