0682
Using diffusion-relaxation MRI to estimate the inner radius of co-electrospun axon-mimicking fibres1Signal Processing Laboratory (LTS5), École Polytechnique Fédérale de Lausanne, Lausanne, Switzerland, 2Danish Research Centre for Magnetic Resonance, Centre for Functional and Diagnostic Imaging and Research, Copenhagen University Hospital, Amager & Hvidovre, Copenhagen, Denmark, 3Department of Applied Mathematics and Computer Science, Technical University of Denmark, Kongens, Lyngby, Denmark, 4Centre for Medical Image Computing, Department of Medical Physics and Biomedical Engineering , University College London, London, United Kingdom, 5Translational Imaging in Neurology (ThINk) Basel, Department of Biomedical Engineering, University Hospital Basel and University of Basel, Basel, Switzerland, 6MS Center and Research Center for Clinical Neuroimmunology and Neuroscience Basel, University Hospital Basel and University of Basel, Basel, Switzerland, 7Roche Pharma Research & Early Development, Neuroscience and Rare Diseases, Roche Innovation Center, Basel, Switzerland, 8Radiology Department, Centre Hospitalier Universitaire Vaudois and University of Lausanne, Lausanne, Switzerland, 9Centre d’Imagerie Biomédicale (CIBM), EPFL, Lausanne, Switzerland, 10Cardiff University Brain Research Imaging Centre, Cardiff University, Cardiff, Wales, United Kingdom, 11Department of Neuroinflammation, Queen Square Institute of Neurology, University College London, London, United Kingdom, 12Bioxydyn Limited, Manchester, United Kingdom
Synopsis
Keywords: Diffusion/other diffusion imaging techniques, Validation
A new approach for estimating inner axon radii from intra-axonal T2 relaxation times was recently proposed. However, further validations are required before this technique can be used widely. The main aim of this study is to validate this T2-based pore size estimation technique in phantoms comprising co-electrospun hollow axon-mimicking fibres designed to have non-circular cross-sections and different radii distributions. For this purpose, a diffusion-relaxation MRI dataset was acquired with a 7T preclinical scanner, from which the intra-fibre T2 times and pore sizes were estimated. The resulting pore sizes were compared to those measured from Scanning Electron Microscope images.Background and Purpose
The accurate measurement of axon radius in vivo has been one of the main goals in diffusion MRI (dMRI)1–9, as it modulates the speed of action potentials10–12. However, the main limitation of these techniques is that there is a practical resolution limit that depends on the amplitude of the applied diffusion gradient13, below which the radius of smaller axons cannot be determined. Recently, a new approach to quantify axon radii by using diffusion-relaxation MRI was proposed14. It considers a surface-based relaxation mechanism commonly employed in porous media15,16. In human brain data, the intra-axonal T2 time was highly correlated with the inner axon radius in several corpus callosum regions, as estimated from histological data. Notably, the intra-axonal T2 can be converted to inner axon radii14 if a calibration approach is conducted using histology, by measuring the slope and offset of a regression line14.The primary purpose of this study is to validate this T2-based pore size estimation technique in various phantoms comprising co-electrospun hollow axon-mimicking fibres designed to have non-circular cross-sections and different radii distributions. The estimated fibre radii were compared to those measured from Scanning Electron Microscope (SEM) images and those from a state-of-the-art multi-shell dMRI method based on the spherical mean power-law approach2.
Methods
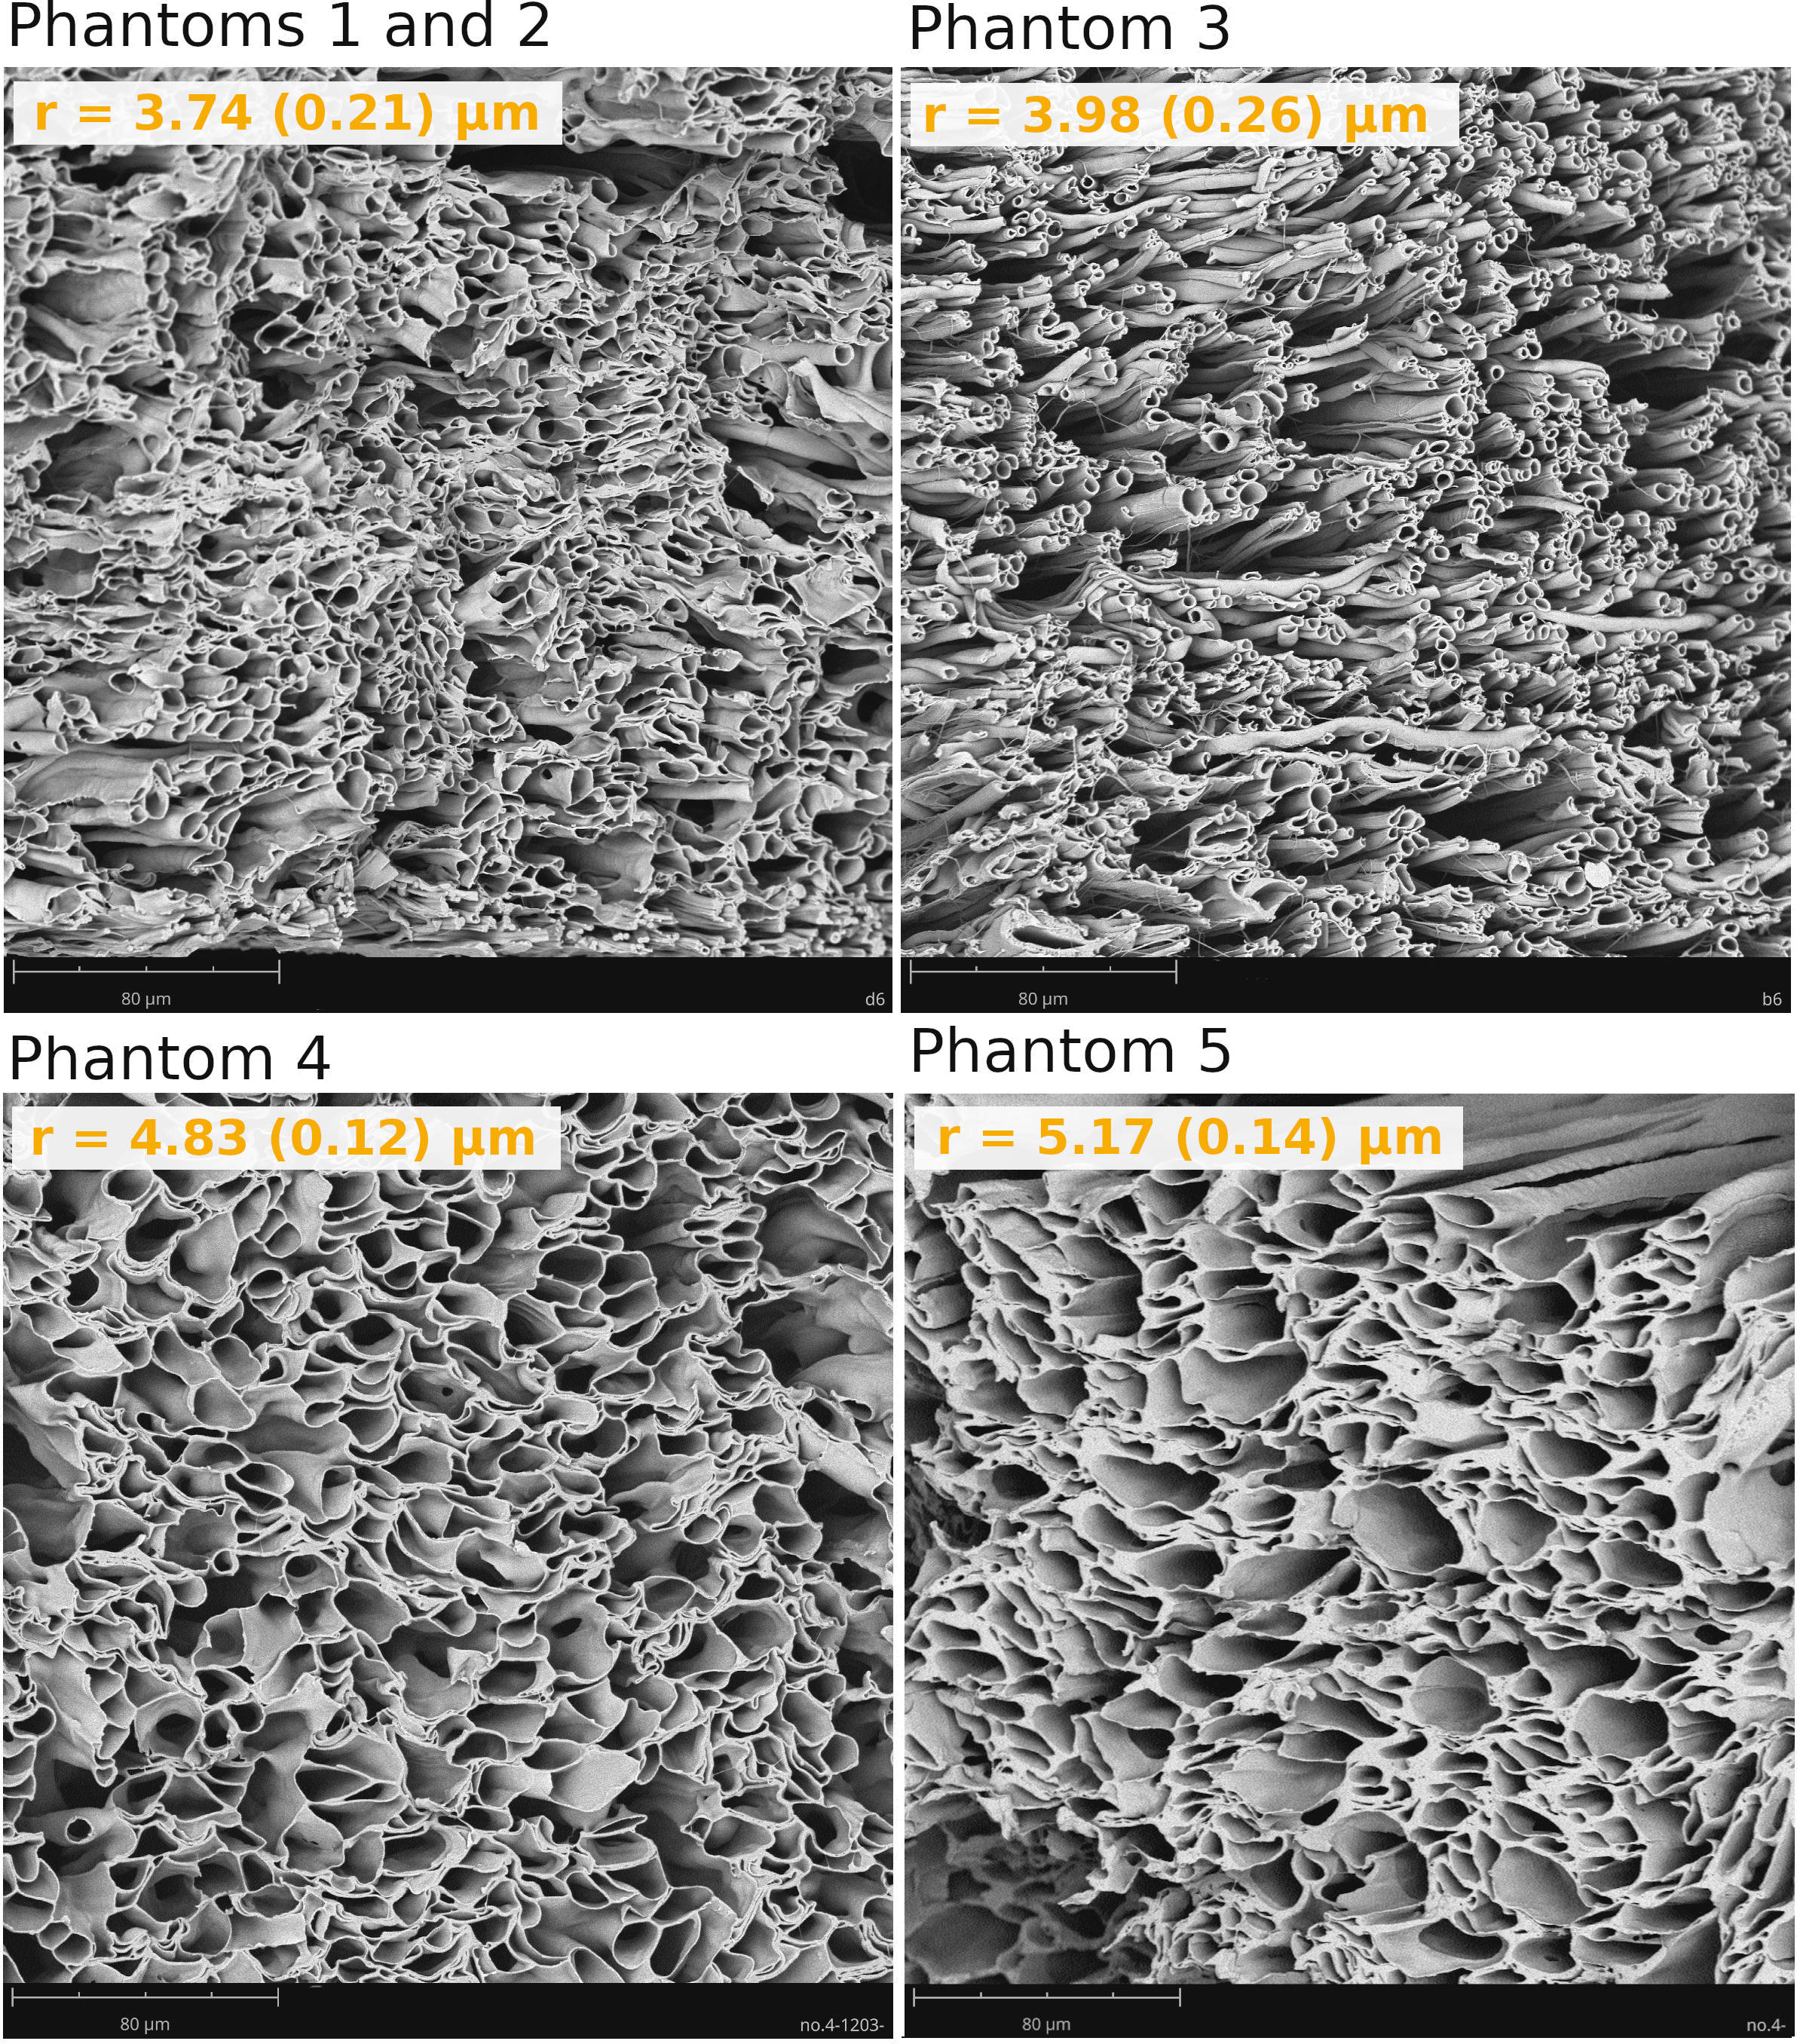
Phantom Construction and Characterisation: Five phantom samples consisting of micron-scale hollow fibres mimicking axons in white matter were built using the co-electrospinning technique17 to produce microfibres with a different distribution of inner fibre radius per sample. For each sample, the inner fibre radii were measured using SEM images and the ImageJ software18,19. Figure 1 shows SEM micrographs depicting the fibres’ morphology.All phantom samples were placed inside tubes filled with de-ionized water. An additional control tube only containing de-ionized free water was also studied.
Although the phantom samples were designed to only have “intra-fibre” pores, some large (e.g., >20 µm) “extra-fibre” pores were formed randomly because fibre deposition could not be controlled precisely during the co-electrospinning process19. Since the employed MRI sequences highly attenuate the MRI signals from these large pores, they were excluded from the SEM images during the calculation of the mean and standard deviation of the inner fibre radii.
Data acquisition: Diffusion-relaxation and multi-shell dMRI data were acquired using a 7T Bruker preclinical scanner at the Danish Research Center for Magnetic Resonance. The diffusion-relaxation protocol comprised the following acquisition parameters: diffusion-gradient=182 mT/m, diffusion-times Δ/δ=35/9 ms, TR=6100 ms, voxel-size=2x2x2 mm3, one b=0 s/mm2 image, number-of-diffusion-directions=48, b=6000 s/mm2. The acquisition was repeated for the following eight echo-times, TE=[51,75,100,150,200,250,275,300] ms. The multi-shell dMRI protocol employed four high b-values, b=[6000,7000,8000,10000] s/mm2 with TE=51 ms, and the other experimental parameters used in the diffusion-relaxation protocol.
Estimation: We assumed that for b≥6000 s/mm2, the signals from the water molecules outside the intra-fibre compartment are practically zero20. After computing the orientation-averaged mean signal for each diffusion-relaxation data with different TE, the intra-fibre T2 was estimated by fitting a mono-exponential relaxation model20–22. A calibration approach was implemented to transform the intra-fibre T2 times into inner fibre radii (see below).
Another independent estimation of the inner fibre radius was obtained from the multi-shell dMRI data by implementing the spherical mean power-law method2.
Calibration: The observed intra-fibre $$$T_2^i$$$ time can be modelled as a function of the inner fibre radius r as 16,24
$$ \frac{1}{T_2^i} = \frac{1}{T_2^b} + \frac{2 \rho_2}{r} \approx \frac{2\rho_2}{r}, \;\; Eq. \; (1)$$
where $$$T_2^b$$$ denotes the T2 of the free bulk de-ionized water estimated from the control tube (which can be neglected in Eq. (1) since $$$T_2^b>2s$$$) and $$$\rho_2$$$ is the surface relaxivity of the phantom material. We estimated $$$\rho_2$$$ from the mean $$$T_2^i$$$ values and the SEM-based effective (i.e., area-weighted) radii25, reff-SEM=˂r3˃/ ˂r2˃ , from Phantom1 and Phantom5 where the lowest and highest fibre radii were found, respectively. Then, $$$\rho_2$$$ was fixed, and the T2-based fibre radius of each phantom was predicted by inverting Eq. (1):
$$ r= 2\rho_2T_2^i. \;\; Eq. \; (2)$$
Results
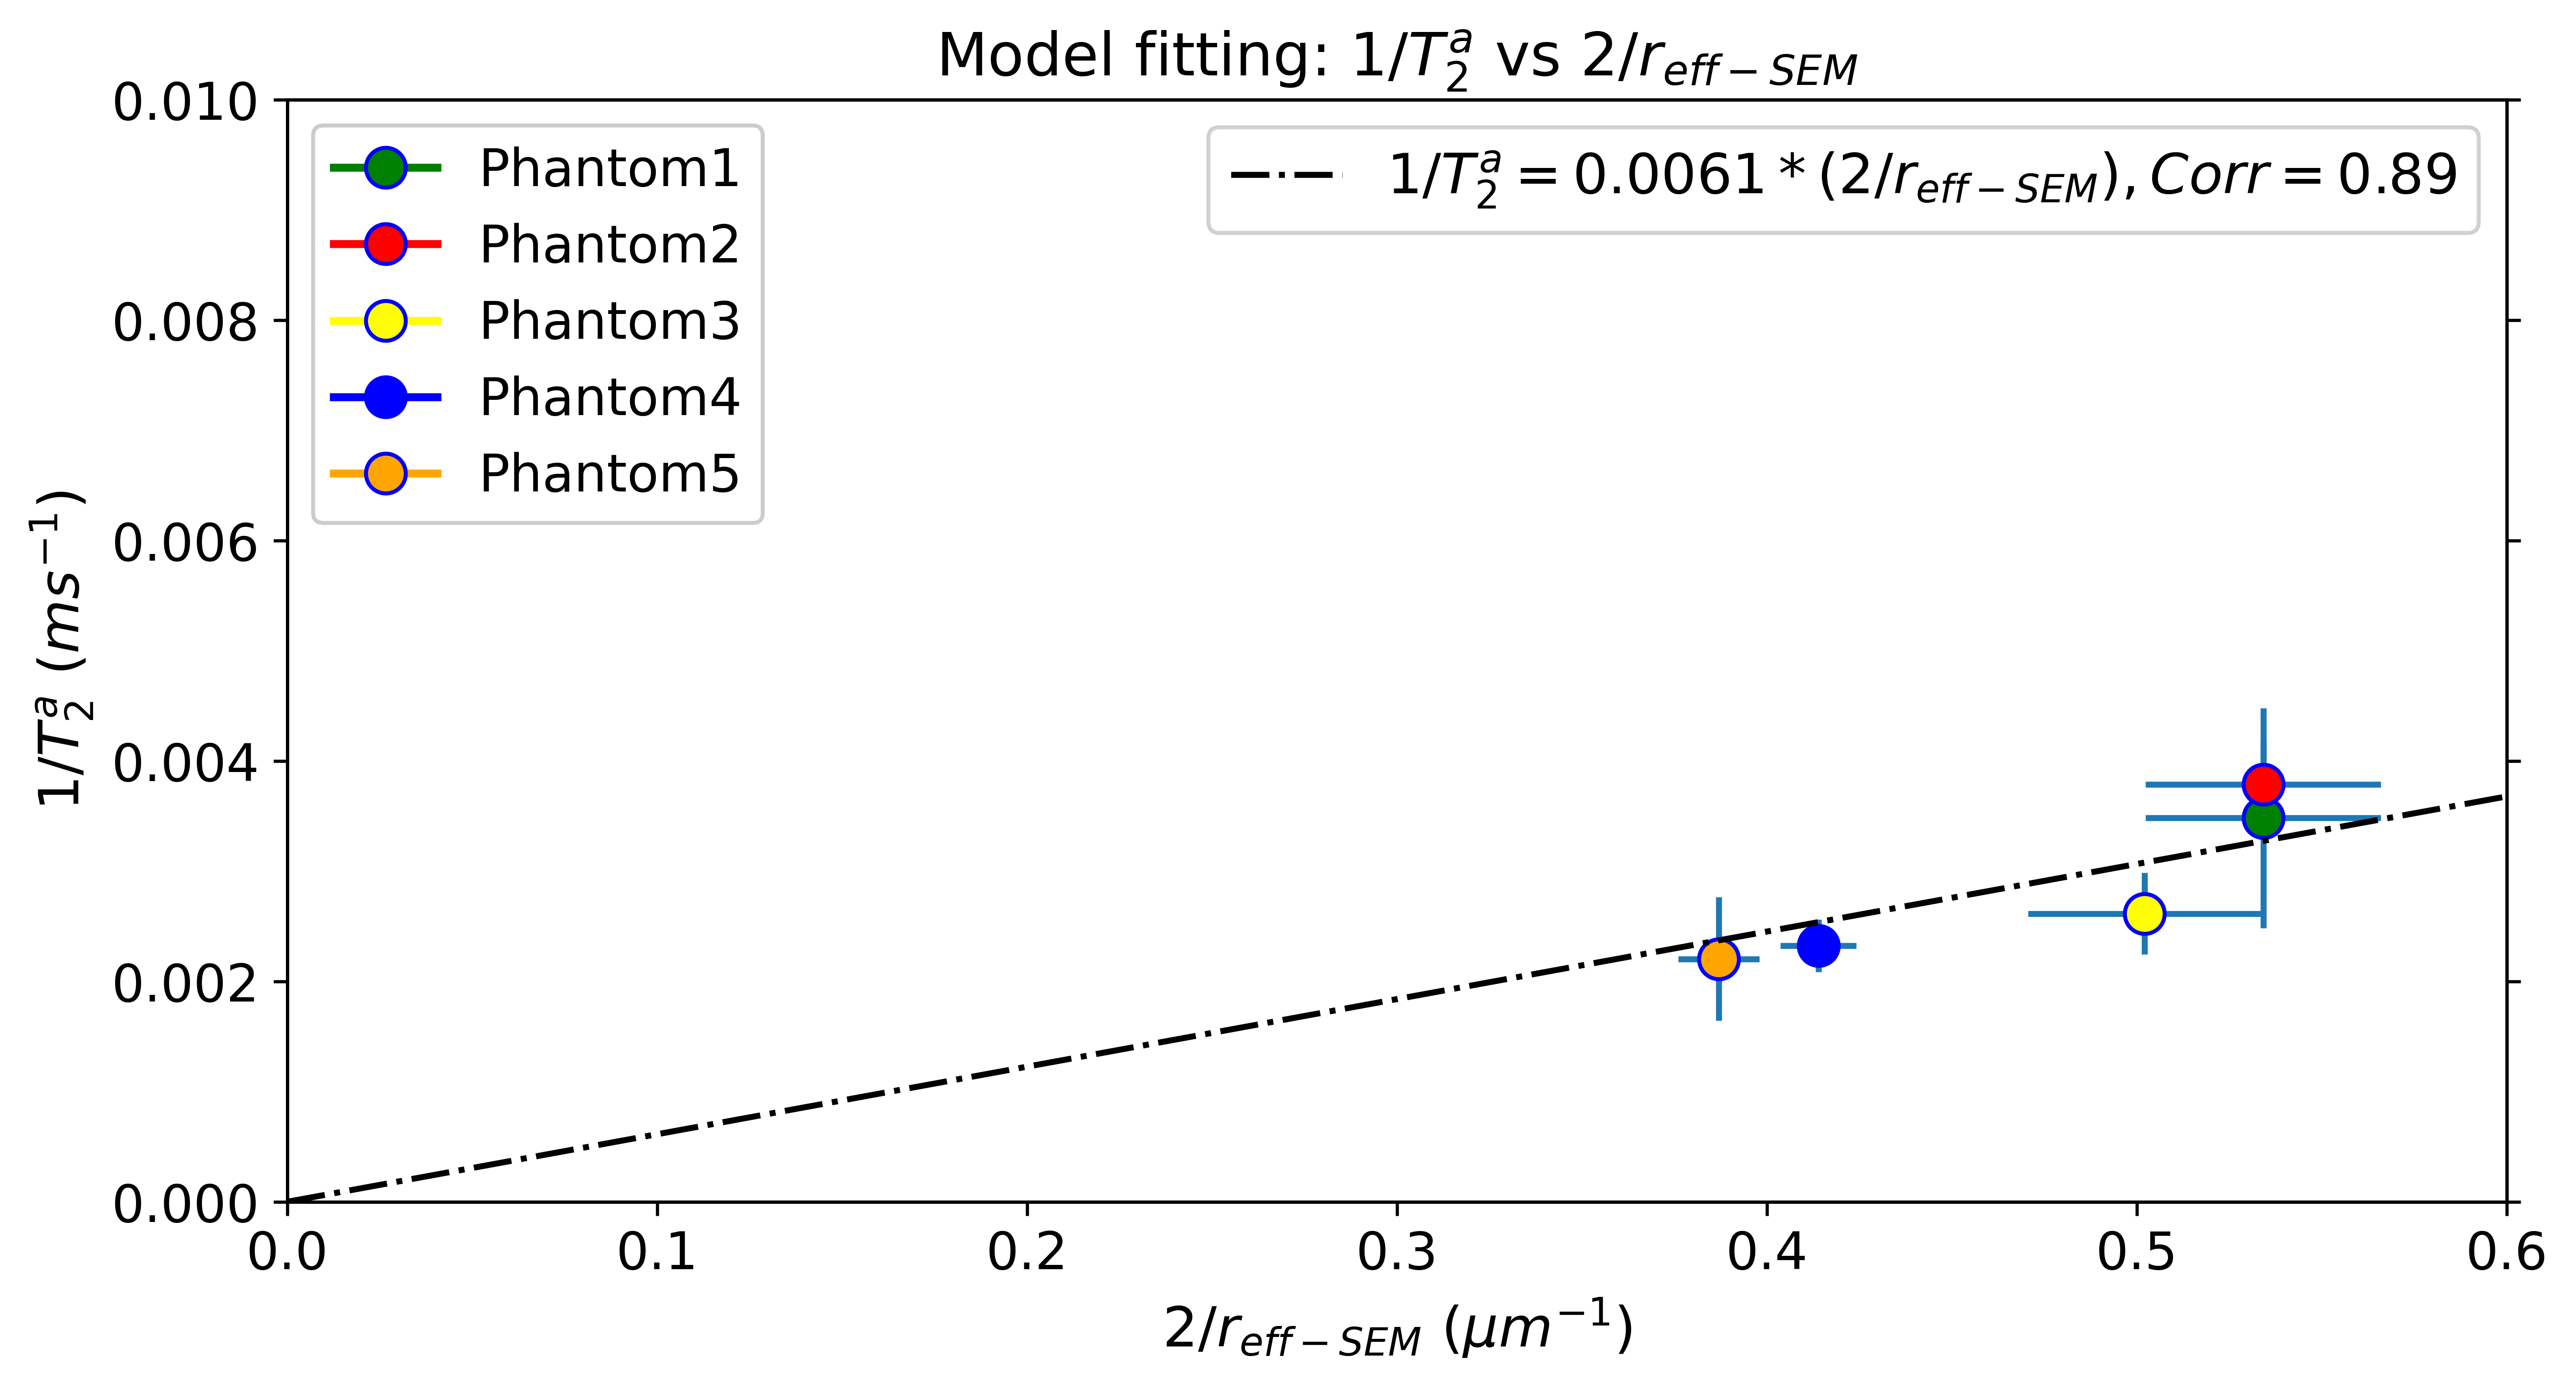
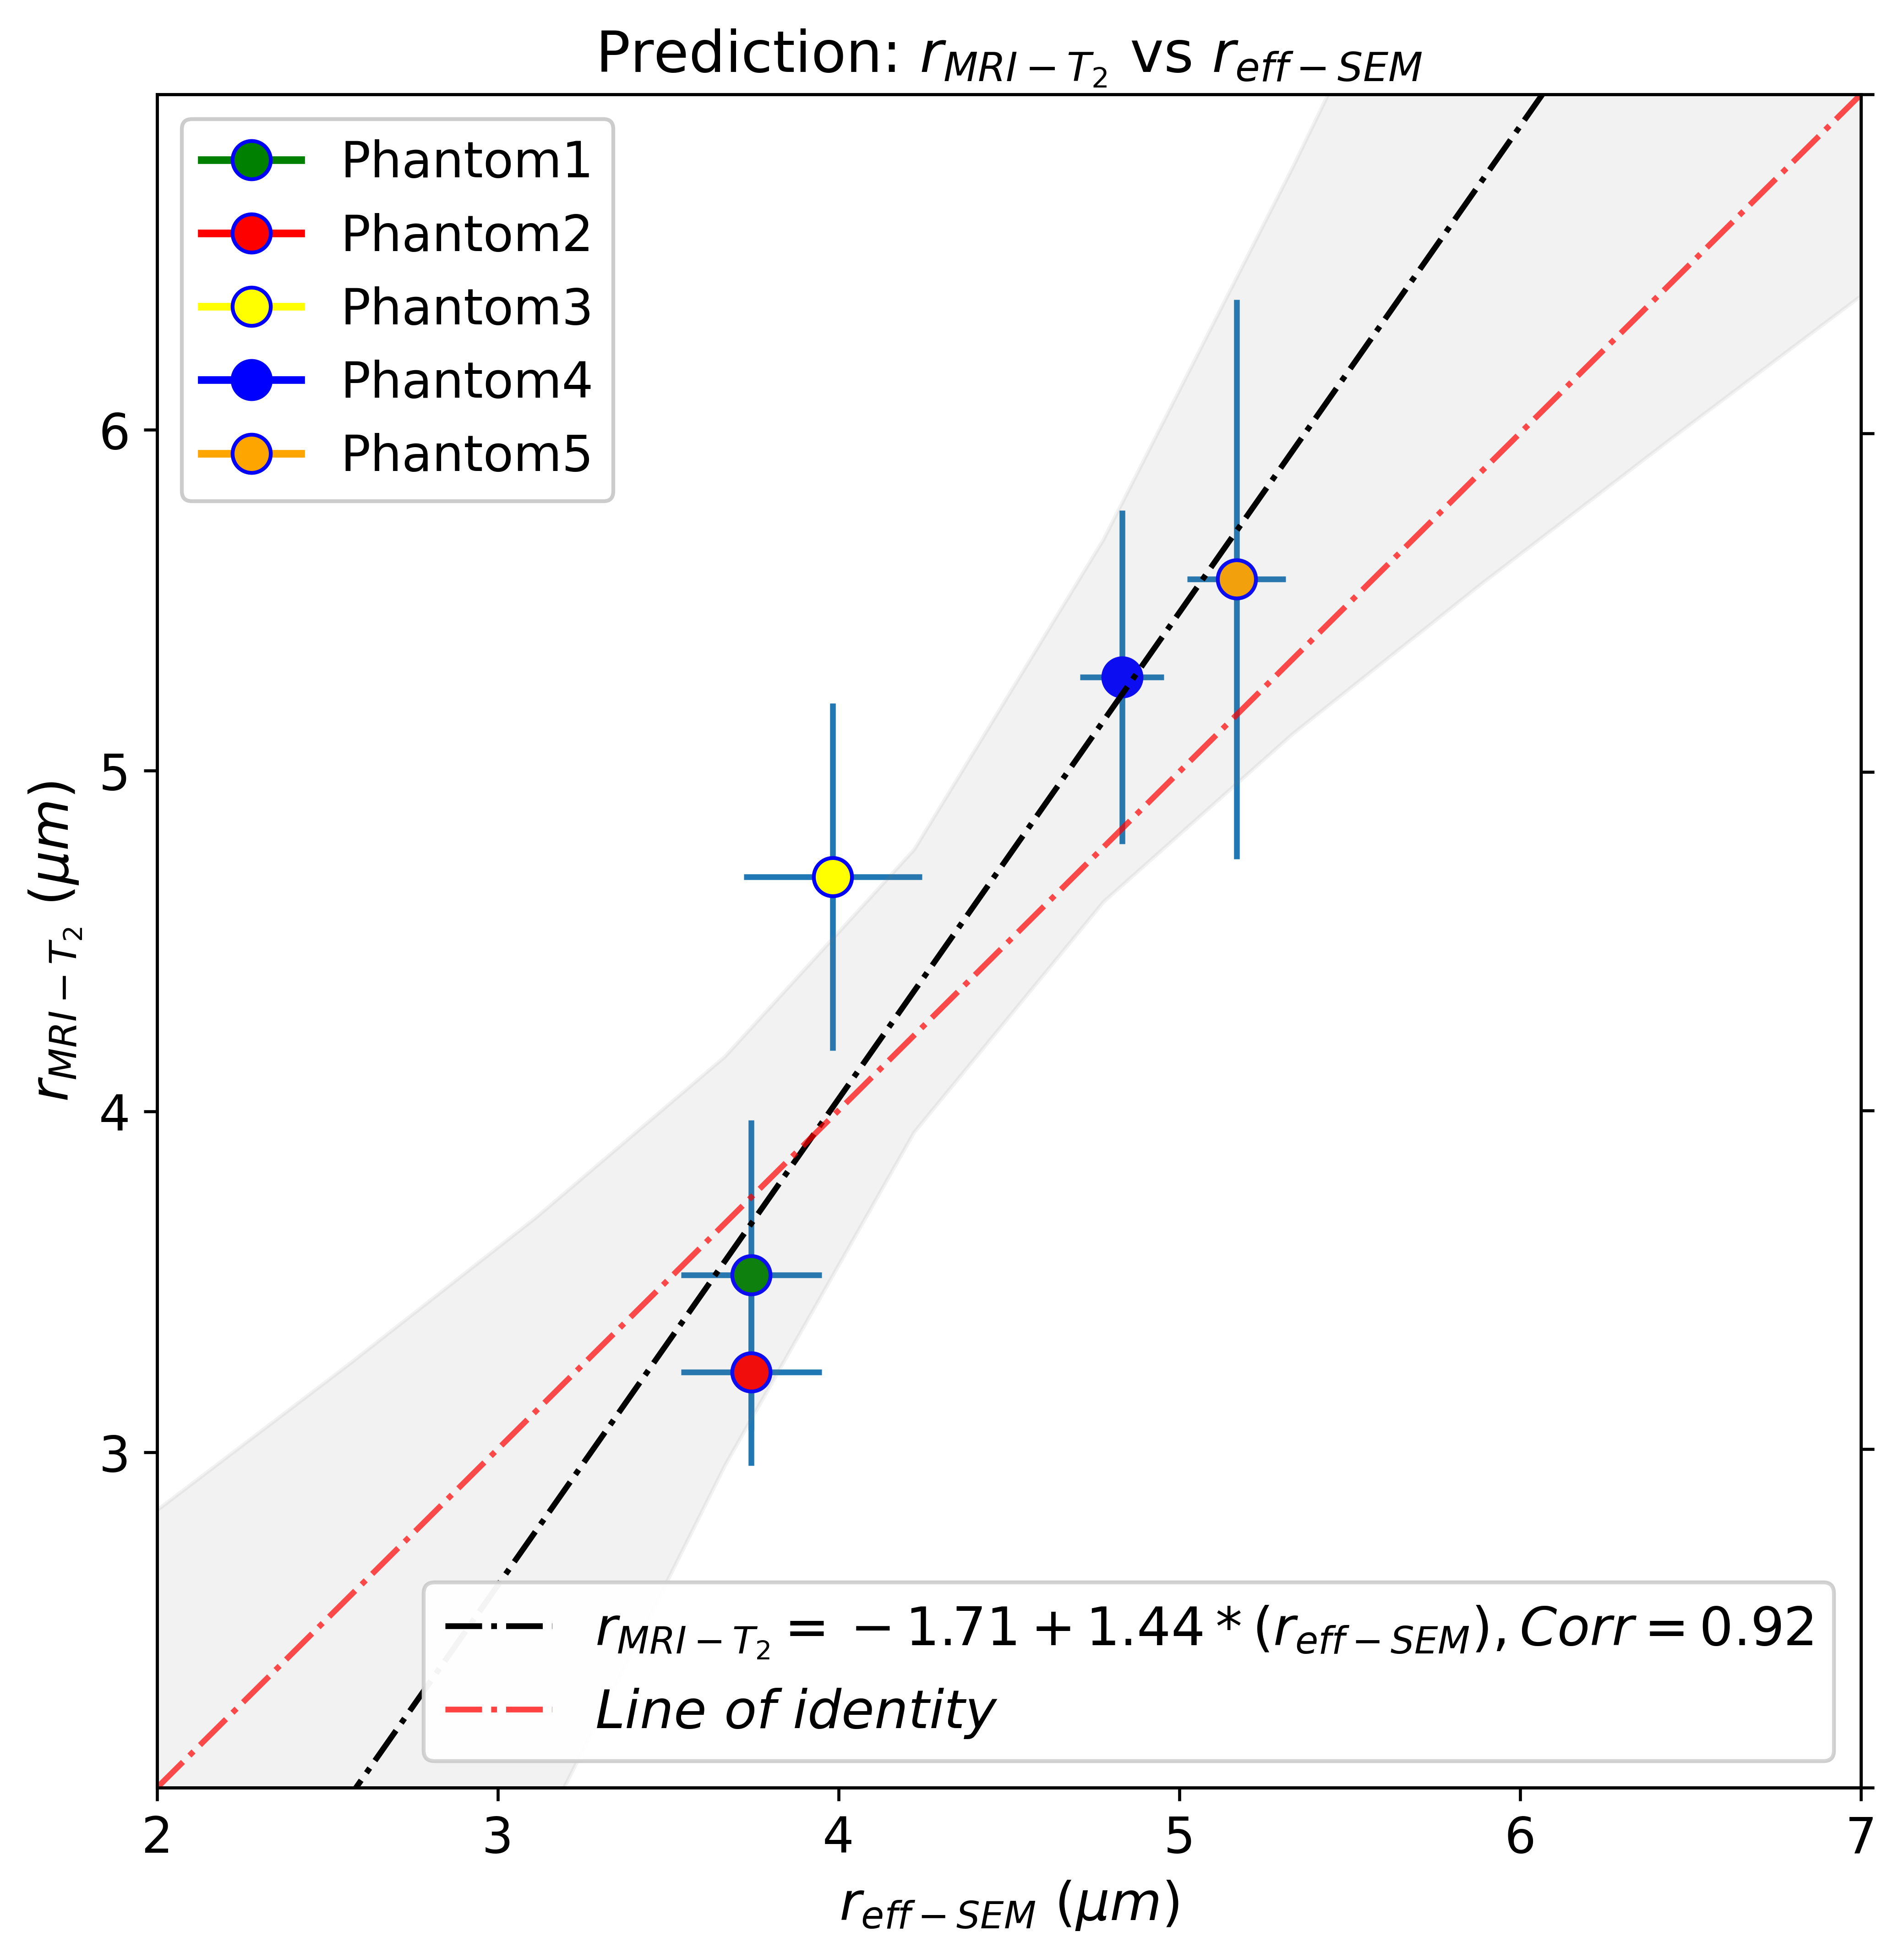
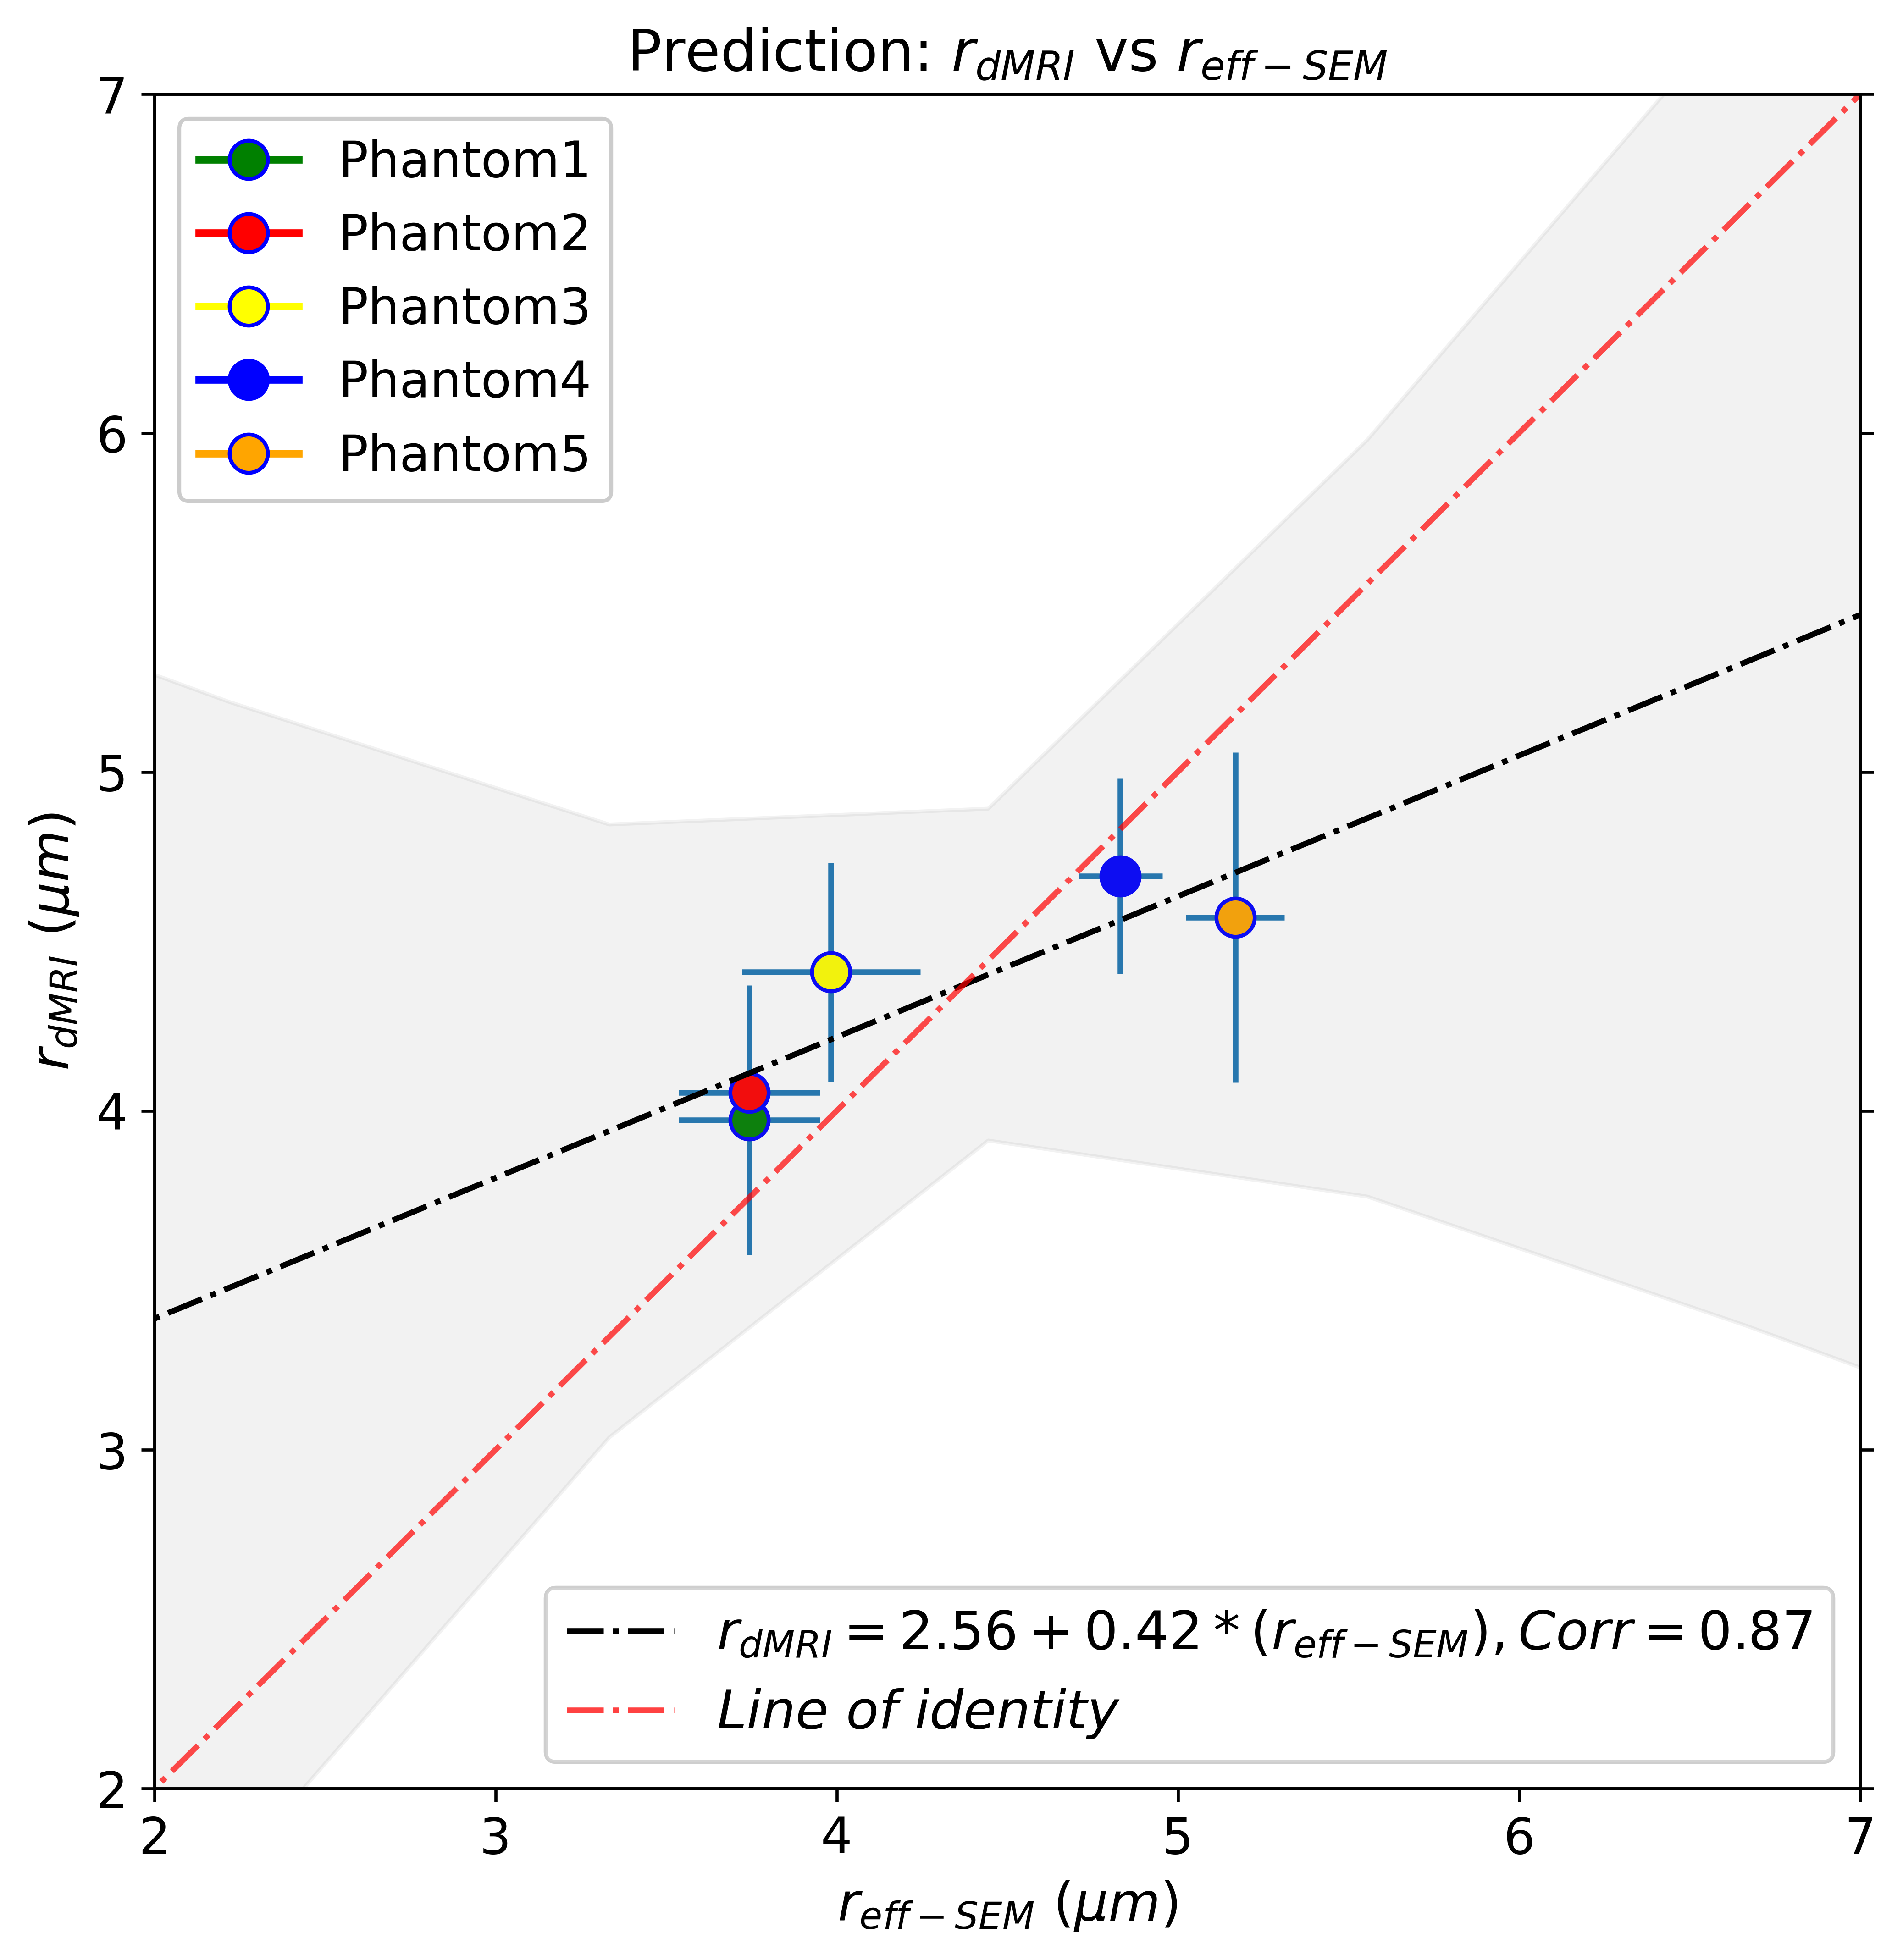
Figure 2 shows the regression line fitting the intra-fibre T2 times and SEM-based radii for the five phantoms. The correlation coefficient between both data was R=0.89 (p-value=0.043). From the estimated coefficients, we found that ρ2=6.1*10-3 µm/ms. The linear relationship between the SEM-based and T2-based fibre radii is shown in Figure 3. The line's slope was statistically significant (slope=1.44, p-value=0.029; under the null hypothesis that the slope is zero), as well as the linear correlation, R=0.92 (p-value=0.029). Figure 4 depicts the linear relationship between the SEM-based and dMRI-based fibre radii. The slope (slope=0.42, p-value=0.05) and the correlation (R=0.87, p-value=0.05) were significant.Conclusions
This validation study shows that the intra-fibre T2 is highly modulated by the inner fibre radii of five biomimetic phantoms, measured from SEM images. The correlation between the SEM-based and T2-based inner fibre radii was statistically significant and similar to that of the dMRI-based estimation. The dMRI-based radii showed less variability per phantom, but the regression line of the T2-based and SEM-based radii was closer to the ‘line of identity’ (see Figures 3-4). Our results support the hypothesis that the inner fibre radius can be estimated from the intra-fibre T2 time via a simple surface-based relaxation model.Acknowledgements
EJC-R is supported by the Swiss National Science Foundation (SNSF), Ambizione grant PZ00P2_185814. FLZ was supported by NIHR UCLH Biomedical Research Centre (BRC) grant. DKJ is supported by a Wellcome Trust Investigator Award (096646/Z/11/Z) and a Wellcome Trust Strategic Award (104943/Z/14/Z). TBD is funded by the European Union. Views and opinions expressed are however those of the author(s) only and do not necessarily reflect those of the European Union or the European Research Council. Neither the European Union nor the granting authority can be held responsible for them. (grant number: 101044180)
References
1. De Santis S, Jones DK, Roebroeck A. Including diffusion time dependence in the extra-axonal space improves in vivo estimates of axonal diameter and density in human white matter. Neuroimage. 2016;130:91-103. doi:10.1016/j.neuroimage.2016.01.047
2. Veraart J, Nunes D, Rudrapatna U, et al. Noninvasive quantification of axon radii using diffusion MRI. Elife. 2020;9. doi:10.7554/eLife.49855
3. Duval T, McNab JA, Setsompop K, et al. In vivo mapping of human spinal cord microstructure at 300 mT/m. Neuroimage. 2015;118:494-507. doi:10.1016/J.NEUROIMAGE.2015.06.038
4. Dyrby TB, Søgaard L V., Hall MG, Ptito M, Alexander DC. Contrast and stability of the axon diameter index from microstructure imaging with diffusion MRI. Magn Reson Med. 2013;70(3):711-721. doi:10.1002/mrm.24501
5. Assaf Y, Blumenfeld-Katzir T, Yovel Y, Basser PJ. AxCaliber: a method for measuring axon diameter distribution from diffusion MRI. Magn Reson Med. 2008;59(6):1347-1354. doi:10.1002/mrm.21577
6. Alexander DC. A general framework for experiment design in diffusion MRI and its application in measuring direct tissue-microstructure features. Magn Reson Med. 2008;60(2):439-448. doi:10.1002/mrm.21646
7. Assaf Y, Basser PJ. Composite hindered and restricted model of diffusion (CHARMED) MR imaging of the human brain. Neuroimage. 2005;27:48-58. doi:10.1016/j.neuroimage.2005.03.042
8. Assaf Y, Freidlin RZ, Rohde GK, Basser PJ. New modeling and experimental framework to characterize hindered and restricted water diffusion in brain white matter. Magn Reson Med. 2004;52(5):965-978. doi:10.1002/mrm.20274
9. Barakovic M, Girard G, Schiavi S, et al. Bundle-Specific Axon Diameter Index as a New Contrast to Differentiate White Matter Tracts. Front Neurosci. 2021;0:687. doi:10.3389/FNINS.2021.646034
10. Costa AR, Pinto-Costa R, Sousa SC, Sousa MM. The Regulation of Axon Diameter: From Axonal Circumferential Contractility to Activity-Dependent Axon Swelling. Front Mol Neurosci. 2018;0:319. doi:10.3389/FNMOL.2018.00319
11. Drakesmith M, Harms R, Rudrapatna SU, Parker GD, Evans CJ, Jones DK. Estimating axon conduction velocity in vivo from microstructural MRI. Neuroimage. 2019;203:116186. doi:10.1016/J.NEUROIMAGE.2019.116186
12. Waxman SG, Bennett MVI. Relative conduction velocities of small myelinated and non-myelinated fibres in the central nervous system. Nat New Biol. 1972;238(85):217-219. doi:10.1038/newbio238217a0
13. Nilsson M, Lasič S, Drobnjak I, et al. Resolution limit of cylinder diameter estimation by diffusion MRI: The impact of gradient waveform and orientation dispersion. NMR Biomed. 2017;30(7). doi:10.1002/nbm.3711
14. Muhamed B, Marco P, Cristina G, Jean-Philippe T, Derek K. J, Canales-Rodríguez EJ. Is the intra-axonal T2 relaxation time related to the axonal calibre? A diffusion-relaxation and histological data study. In: ISMRM 2022, Abstract 0180. ; 2022. Accessed November 1, 2022. https://archive.ismrm.org/2022/0180.html
15. Brownstein KR, Tarr CE. Spin-lattice relaxation in a system governed by diffusion. J Magn Reson. 1977;26(1):17-24. doi:10.1016/0022-2364(77)90230-X
16. Zimmerman JR, Brittin WE. Nuclear magnetic resonance studies in multiple phase systems: Lifetime of a water molecule in an adsorbing phase on silica gel. J Phys Chem. 1957;61(10):1328-1333. doi:10.1021/j150556a015
17. Hubbard PL, Zhou FL, Eichhorn SJ, Parker GJM. Biomimetic phantom for the validation of diffusion magnetic resonance imaging. Magn Reson Med. 2015;73(1):299-305. doi:10.1002/MRM.25107
18. Zhou FL, Parker GJM, Eichhorn SJ, Hubbard Cristinacce PL. Production and cross-sectional characterization of aligned co-electrospun hollow microfibrous bulk assemblies. Mater Charact. 2015;109:25-35. doi:10.1016/J.MATCHAR.2015.09.010
19. Huang CC, Hsu CCH, Zhou FL, et al. Validating pore size estimates in a complex microfiber environment on a human MRI system. Magn Reson Med. 2021;86(3):1514-1530. doi:10.1002/MRM.28810
20. McKinnon ET, Jensen JH. Measuring intra-axonal T2 in white matter with direction-averaged diffusion MRI. Magn Reson Med. 2019;81(5):2985-2994. doi:10.1002/MRM.27617
21. Barakovic M, Tax CMW, Rudrapatna U, et al. Resolving bundle-specific intra-axonal T2 values within a voxel using diffusion-relaxation tract-based estimation. Neuroimage. 2021;227:117617. doi:10.1016/j.neuroimage.2020.117617
22. Tax CMW, Kleban E, Chamberland M, Baraković M, Rudrapatna U, Jones DK. Measuring compartmental T2-orientational dependence in human brain white matter using a tiltable RF coil and diffusion-T2 correlation MRI. Neuroimage. 2021;236:117967. doi:10.1016/J.NEUROIMAGE.2021.117967
23. Virtanen P, Gommers R, Oliphant TE, et al. SciPy 1.0: fundamental algorithms for scientific computing in Python. Nat Methods. Published online 2020. doi:10.1038/s41592-019-0686-2
24. Brownstein KR, Tarr CE. Importance of classical diffusion in NMR studies of water in biological cells. Phys Rev A. 1979;19(6):2446-2453. doi:10.1103/PhysRevA.19.2446
25. Alexander DC, Hubbard PL, Hall MG, et al. Orientationally invariant indices of axon diameter and density from diffusion MRI. Neuroimage. 2010;52(4):1374-1389. doi:S1053-8119(10)00775-5 [pii]10.1016/j.neuroimage.2010.05.043
Figures