0680
COnstrained Reference frame diffusion TEnsor Correlation Spectroscopic (CORTECS) MRI1Eunice Kennedy Shriver National Institute of Child Health and Human Development, National Institutes of Health, Bethesda, MD, United States, 2Center for Neuroscience and Regenerative Medicine, Bethesda, MD, United States, 3Henry M. Jackson Foundation for the Advancement of Military Medicine Inc., Bethesda, MD, United States
Synopsis
Keywords: Diffusion/other diffusion imaging techniques, Microstructure, diffusion tensor distribution, DTD, gray matter, cortical layers, DTI
We propose a practical new framework for mapping non-parametric diffusion tensor distributions (DTDs). For diffusion MRI data with sufficiently high spatial resolution, we can constrain all microscopic diffusion tensors of the DTD to be diagonalized using a single orthonormal reference frame estimated from the entire mesoscopic voxel. The constrained DTD is determined by the correlation spectrum of the corresponding microscopic principal diffusivities and can be measured very efficiently using Inverse Laplace Transform methods and single diffusion encoded measurements. cDTD spectral components measured in cortical tissue show good sensitivity to cytoarchitectonic domains and reveal lamination patterns observed in corresponding histological images.Introduction
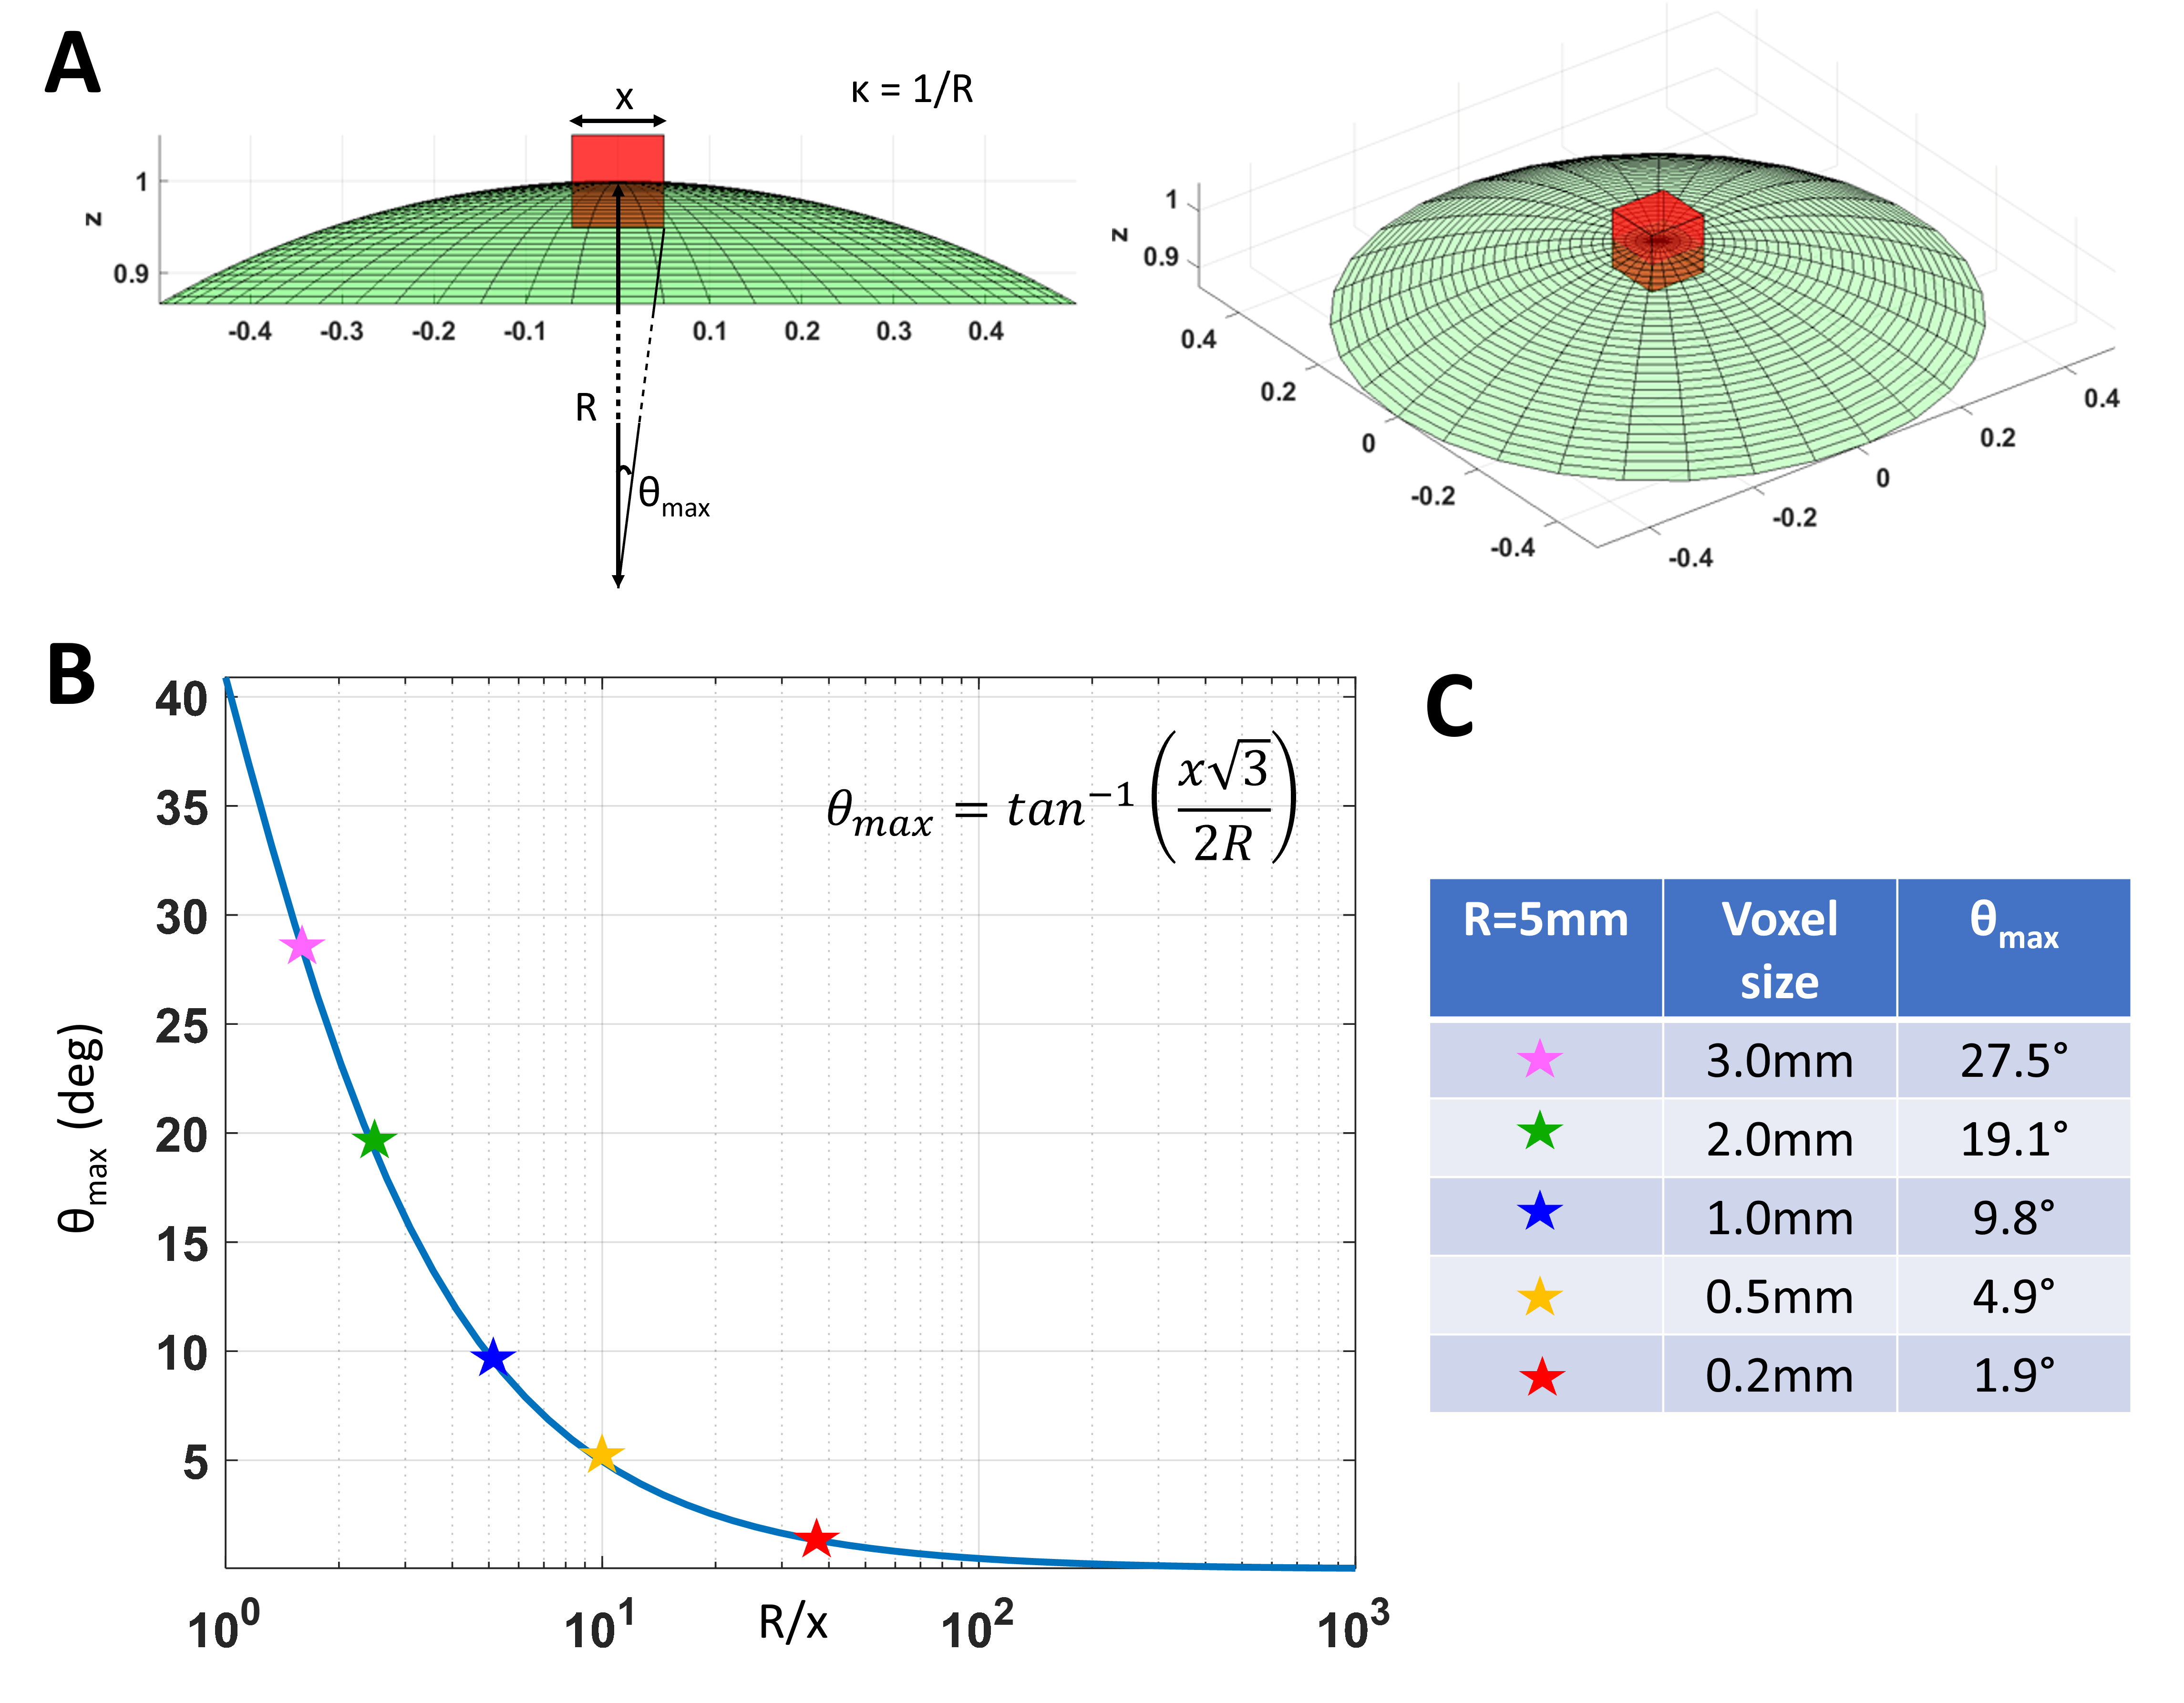
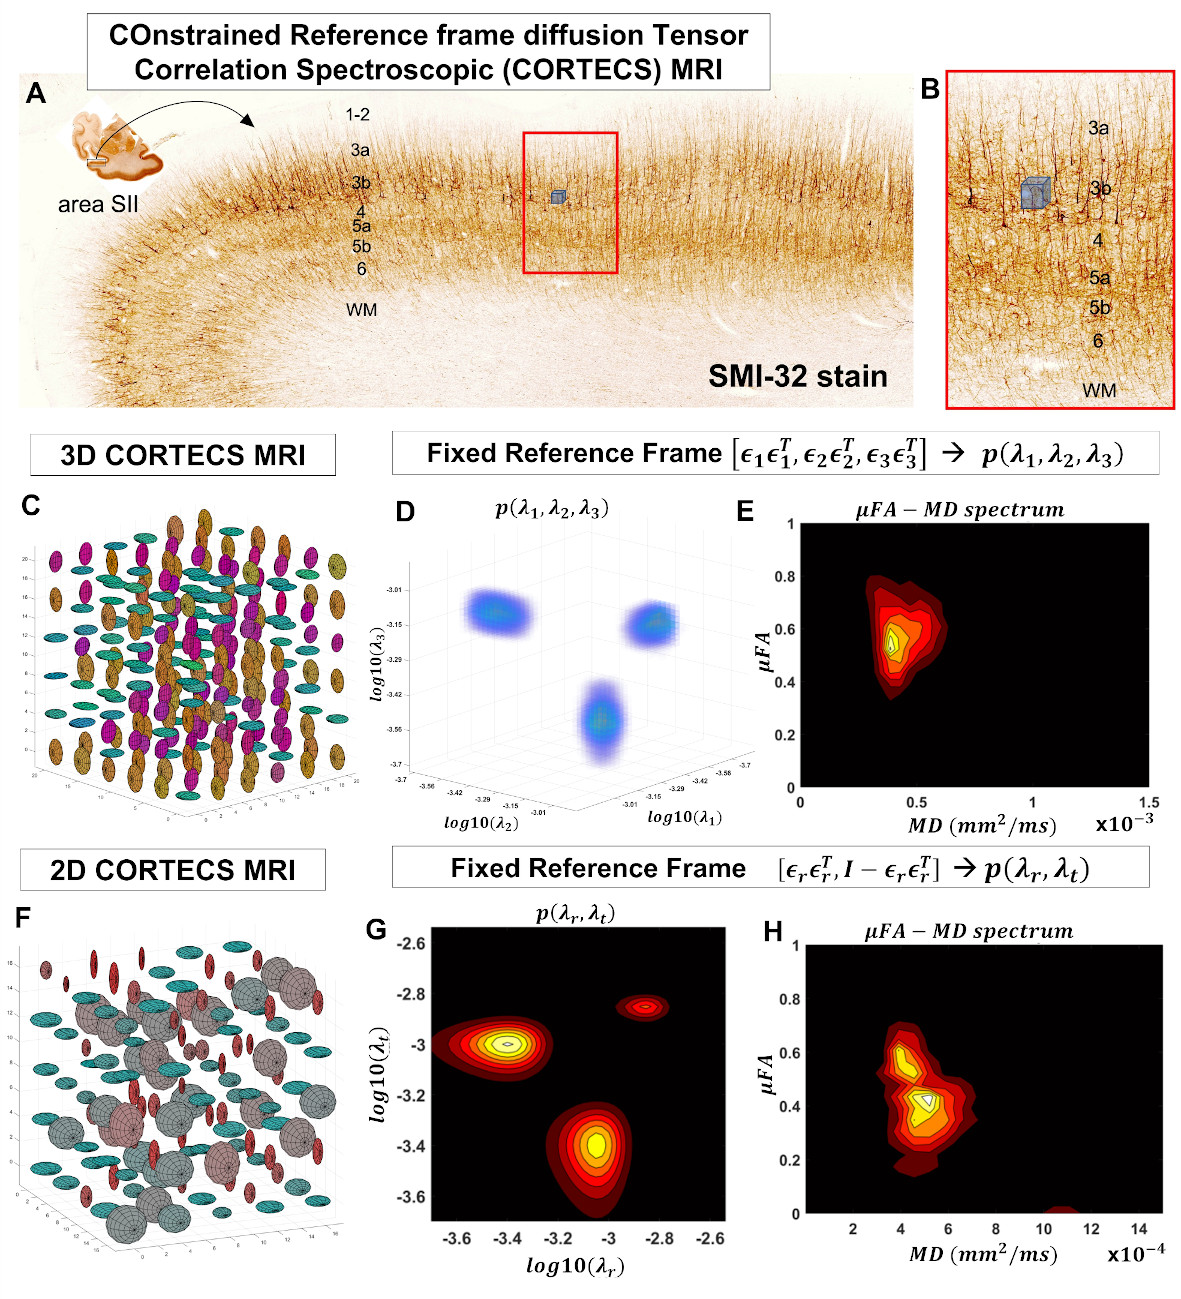
High-resolution cortical diffusion MRI (dMRI) studies1-3 have consistently shown that water diffuses preferentially along radial and tangential orientations with respect to the cortical surface4, in agreement with histological assessments of tissue microarchitecture5. These dominant orientations do not change significantly when the relative contributions of subvoxel water pools vary in experiments with different diffusion times, b-values, TEs, TRs3. Moreover, at ultra-high spatial resolutions (<700µm) the intravoxel orientation dispersion of the diffusion tensors associated with these microscopic pools is significantly decreased (Fig. 1). With this in mind, we propose a practical new framework, called COnstrained Reference frame diffusion TRnsor Correlation Spectroscopic (CORTECS) MRI. The framework simplifies the measurement of diffusion tensor distribution (DTD)6-8 from high-resolution dMRI data by constraining the microscopic diffusion tensors of the DTD to be diagonalized using the same orthonormal reference frame of the mesoscopic voxel (Fig. 2). In each voxel, the constrained DTD (cDTD), determined non-parametrically by the correlation spectrum of the microscopic principal diffusivities associated with the axes of the voxel reference frame, can be estimated efficiently using Inverse Laplace Transform (ILT) methods from only data acquired with single diffusion encoding (SDE).Theory and Methods
The DTD in each voxel, p(D), depends on the net diffusion-weighted voxel signal, S, and the encoding b-tensor, b:$$S\left(\mathbf{b}\right) = \int_{\mathcal{M}_{+}} p\left(\mathbf{D}\right) e^{-\mathbf{b}\cdot\mathbf{D}} \,d{\mathbf{D}}$$
In tissues with well-organized microstructure, such as the cortex, if the voxel is significantly smaller than the radius of curvature of the macroscopic anatomy, R, (e.g., cortical folding), the intravoxel orientational dispersion decreases significantly (Fig. 1). If we constrain the diffusion tensor random variable, D, to be diagonalized by a fixed orthonormal voxel reference frame (Fig. 2), defined by the principal axes of diffusion measured in the entire voxel, $$$\mathbf{\epsilon_1}\mathbf{\epsilon_1}^T,\mathbf{\epsilon_2}\mathbf{\epsilon_2}^T,\mathbf{\epsilon_3}\mathbf{\epsilon_3}^T$$$, we can write Eq. 1 as the Laplace Transform of the principal diffusivities measured along these orientations:
$$S\left(\mathbf{b}\right) = \int_{0}^{\infty} \int_{0}^{\infty} \int_{0}^{\infty} p(\lambda_1,\lambda_2,\lambda_3) e^{- \lambda_1 \mathbf{\epsilon_1}^T\mathbf{b}\mathbf{\epsilon_1} - \lambda_2 \mathbf{\epsilon_2}^T\mathbf{b}\mathbf{\epsilon_2} - \lambda_3 \mathbf{\epsilon_3}^T\mathbf{b}\mathbf{\epsilon_3}} \,d\lambda_1 d\lambda_2 d\lambda_3$$
The measured cDTDs are completely defined by the correlation spectrum of the principal diffusivities and can be estimated using conventional ILT methods and SDE data. If the tissue architecture varies along a single dominant orientation, we can describe the cDTDs more efficiently as a correlation spectrum of radial and tangential diffusivities, $$$\lambda_t$$$ and $$$\lambda_r$$$, respectively. For SDE data, the signal equation is:
$$S\left(\mathbf{b}\right) = \int_{0}^{\infty} \int_{0}^{\infty} p(\lambda_{r},\lambda_{t}) e^{- \lambda_{r} b \cos^2\phi_{\mathbf{g}}} e^{- \lambda_{t} b \sin^2\phi_{\mathbf{g}}} \,d\lambda_{r} d\lambda_{t}$$
, where $$$\phi_{\mathbf{g}}$$$ is the angle between the orientation of the applied diffusion gradient, $$$\mathbf{g}$$$, and the principal diffusion direction, $$$\mathbf{\epsilon_1}$$$.
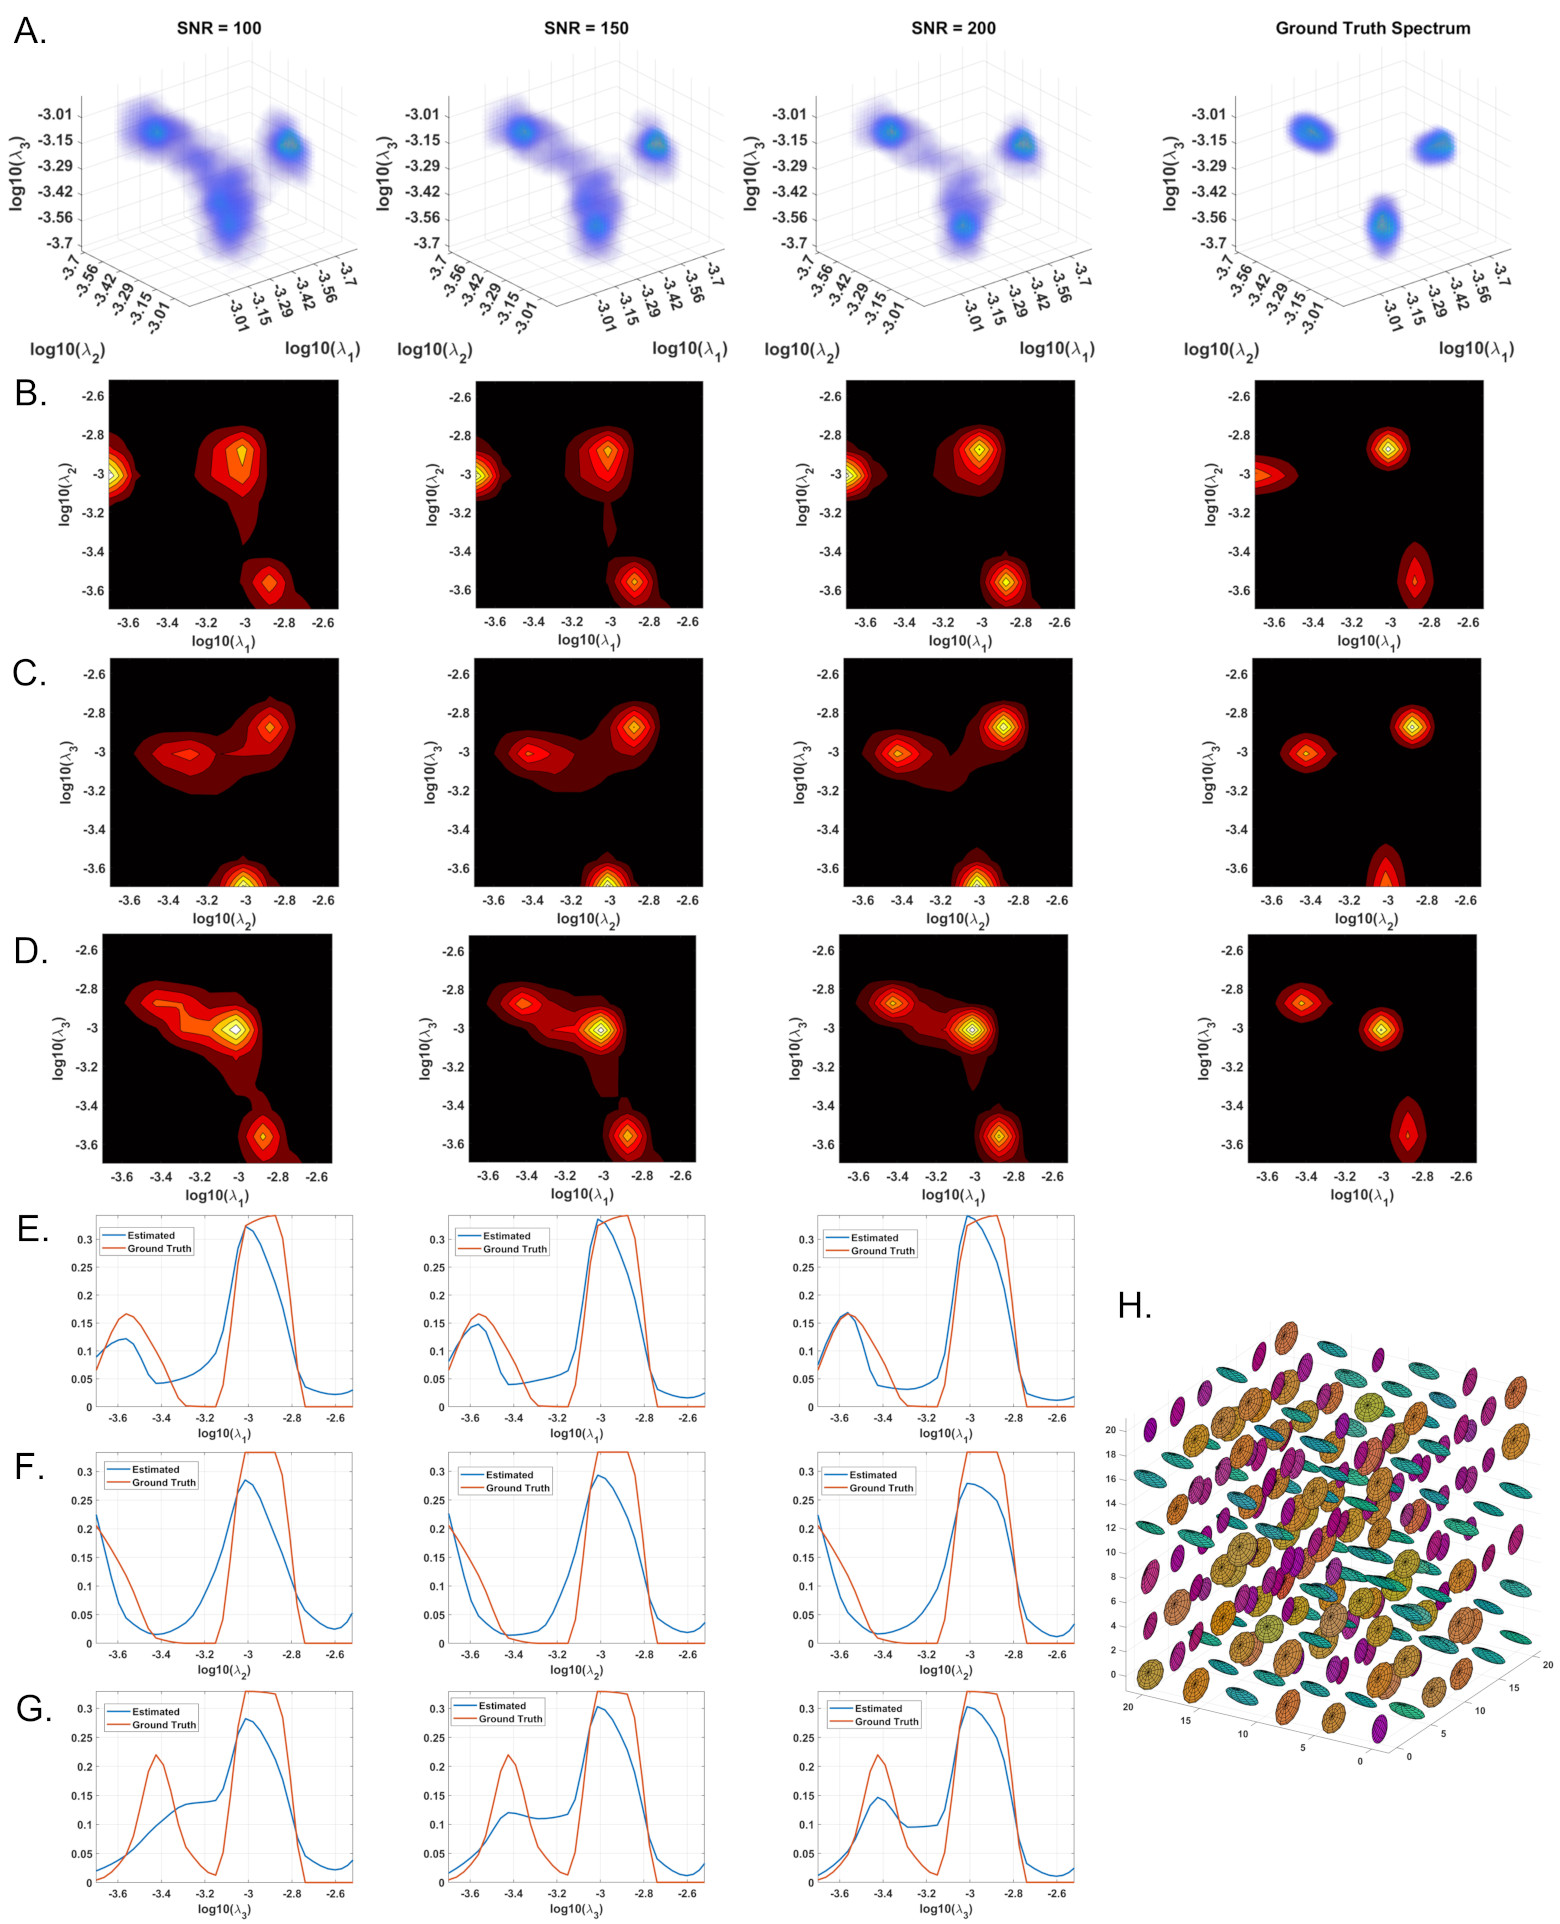
We conducted Monte Carlo simulations using 3D and 2D cDTDs. Starting from ground-truth distributions with multiple peaks we generated signals using the same experimental design as in our fixed brain experiment and added multiple instances of noise. We compared the mean estimated normalized cDTDs with the ground truth distributions, for different levels of noise.
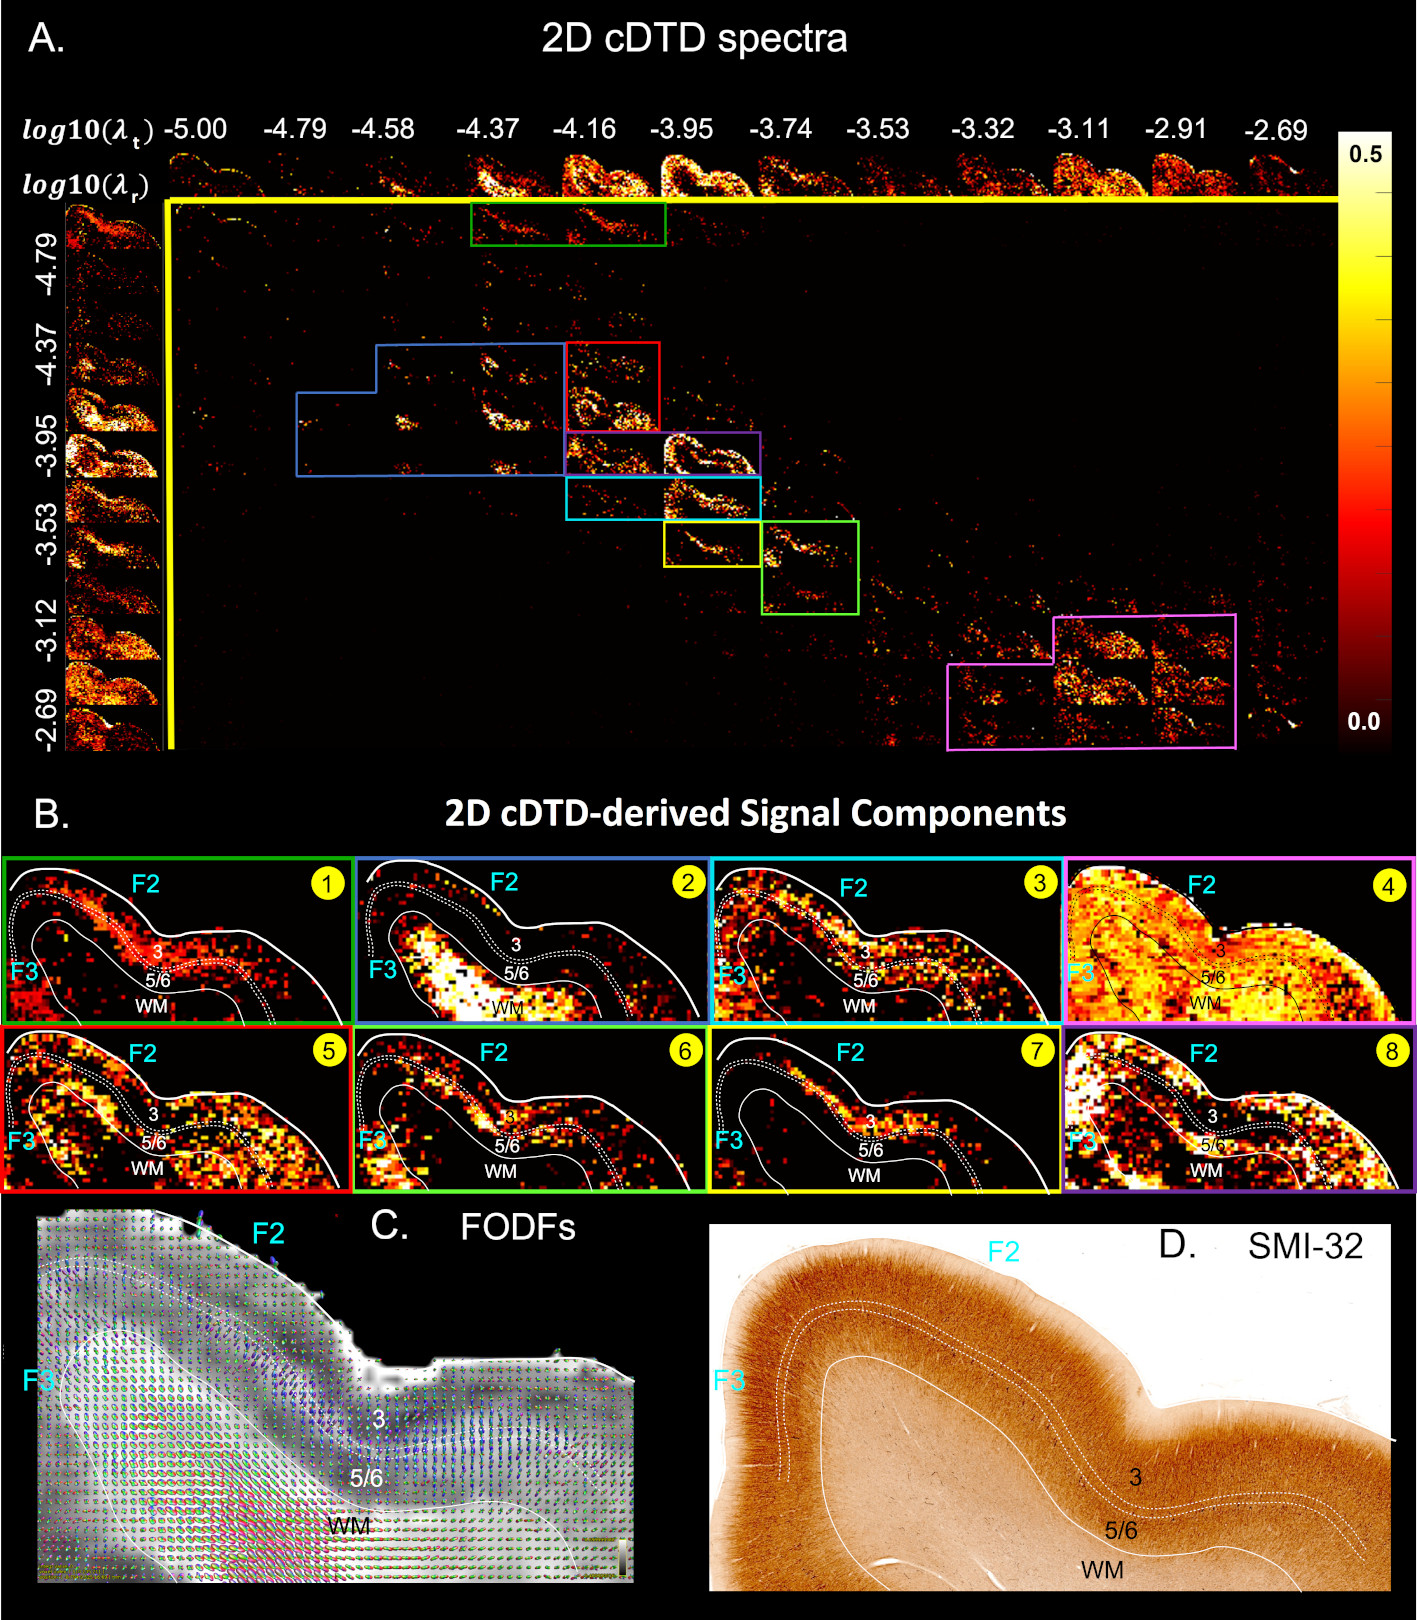
We acquired high-resolution dMRI data from a perfusion-fixed macaque brain with 200µm resolution, TE/TR=50/650ms, 112 SDE DWIs with multiple b-values and orientations. Using Eq. 3, we measured non-parametric 2D cDTDs, $$$p(\lambda_{r},\lambda_{t})$$$, and corresponding marginal distributions. To quantify the cDTD size-shape characteristics we derived 2D correlation spectra of microscopic FA (µFA) and MD values and their marginal distributions. Finally, we integrated the cDTDs over empirically-defined spectral domains to quantify subvoxel signal components with distinct diffusion properties.
Results
MC simulation results show that CORTECS MRI can disentangle multiple subvoxel diffusion tensor processes that are aligned in the same voxel reference frame based on differences in the correlations of their principal diffusivities using only SDE measurements (Fig. 3). While the locations and concentrations (i.e., areas under the peaks) of individual signal components (peaks) can be estimated reliably over a wide range of SNRs.In cortical gray matter, cDTDs reveal the presence of microscopic diffusion processes with distinct joint $$$\lambda_t-\lambda_r$$$ properties (Fig. 4). cDTDs with different mixtures of isotropic (close to the diagonal $$$\lambda_t = \lambda_r$$$) and anisotropic (off-diagonal) microscopic diffusion components have high specificity to cortical domains and layers (Fig. 4B) and are in good agreement with the corresponding histology.
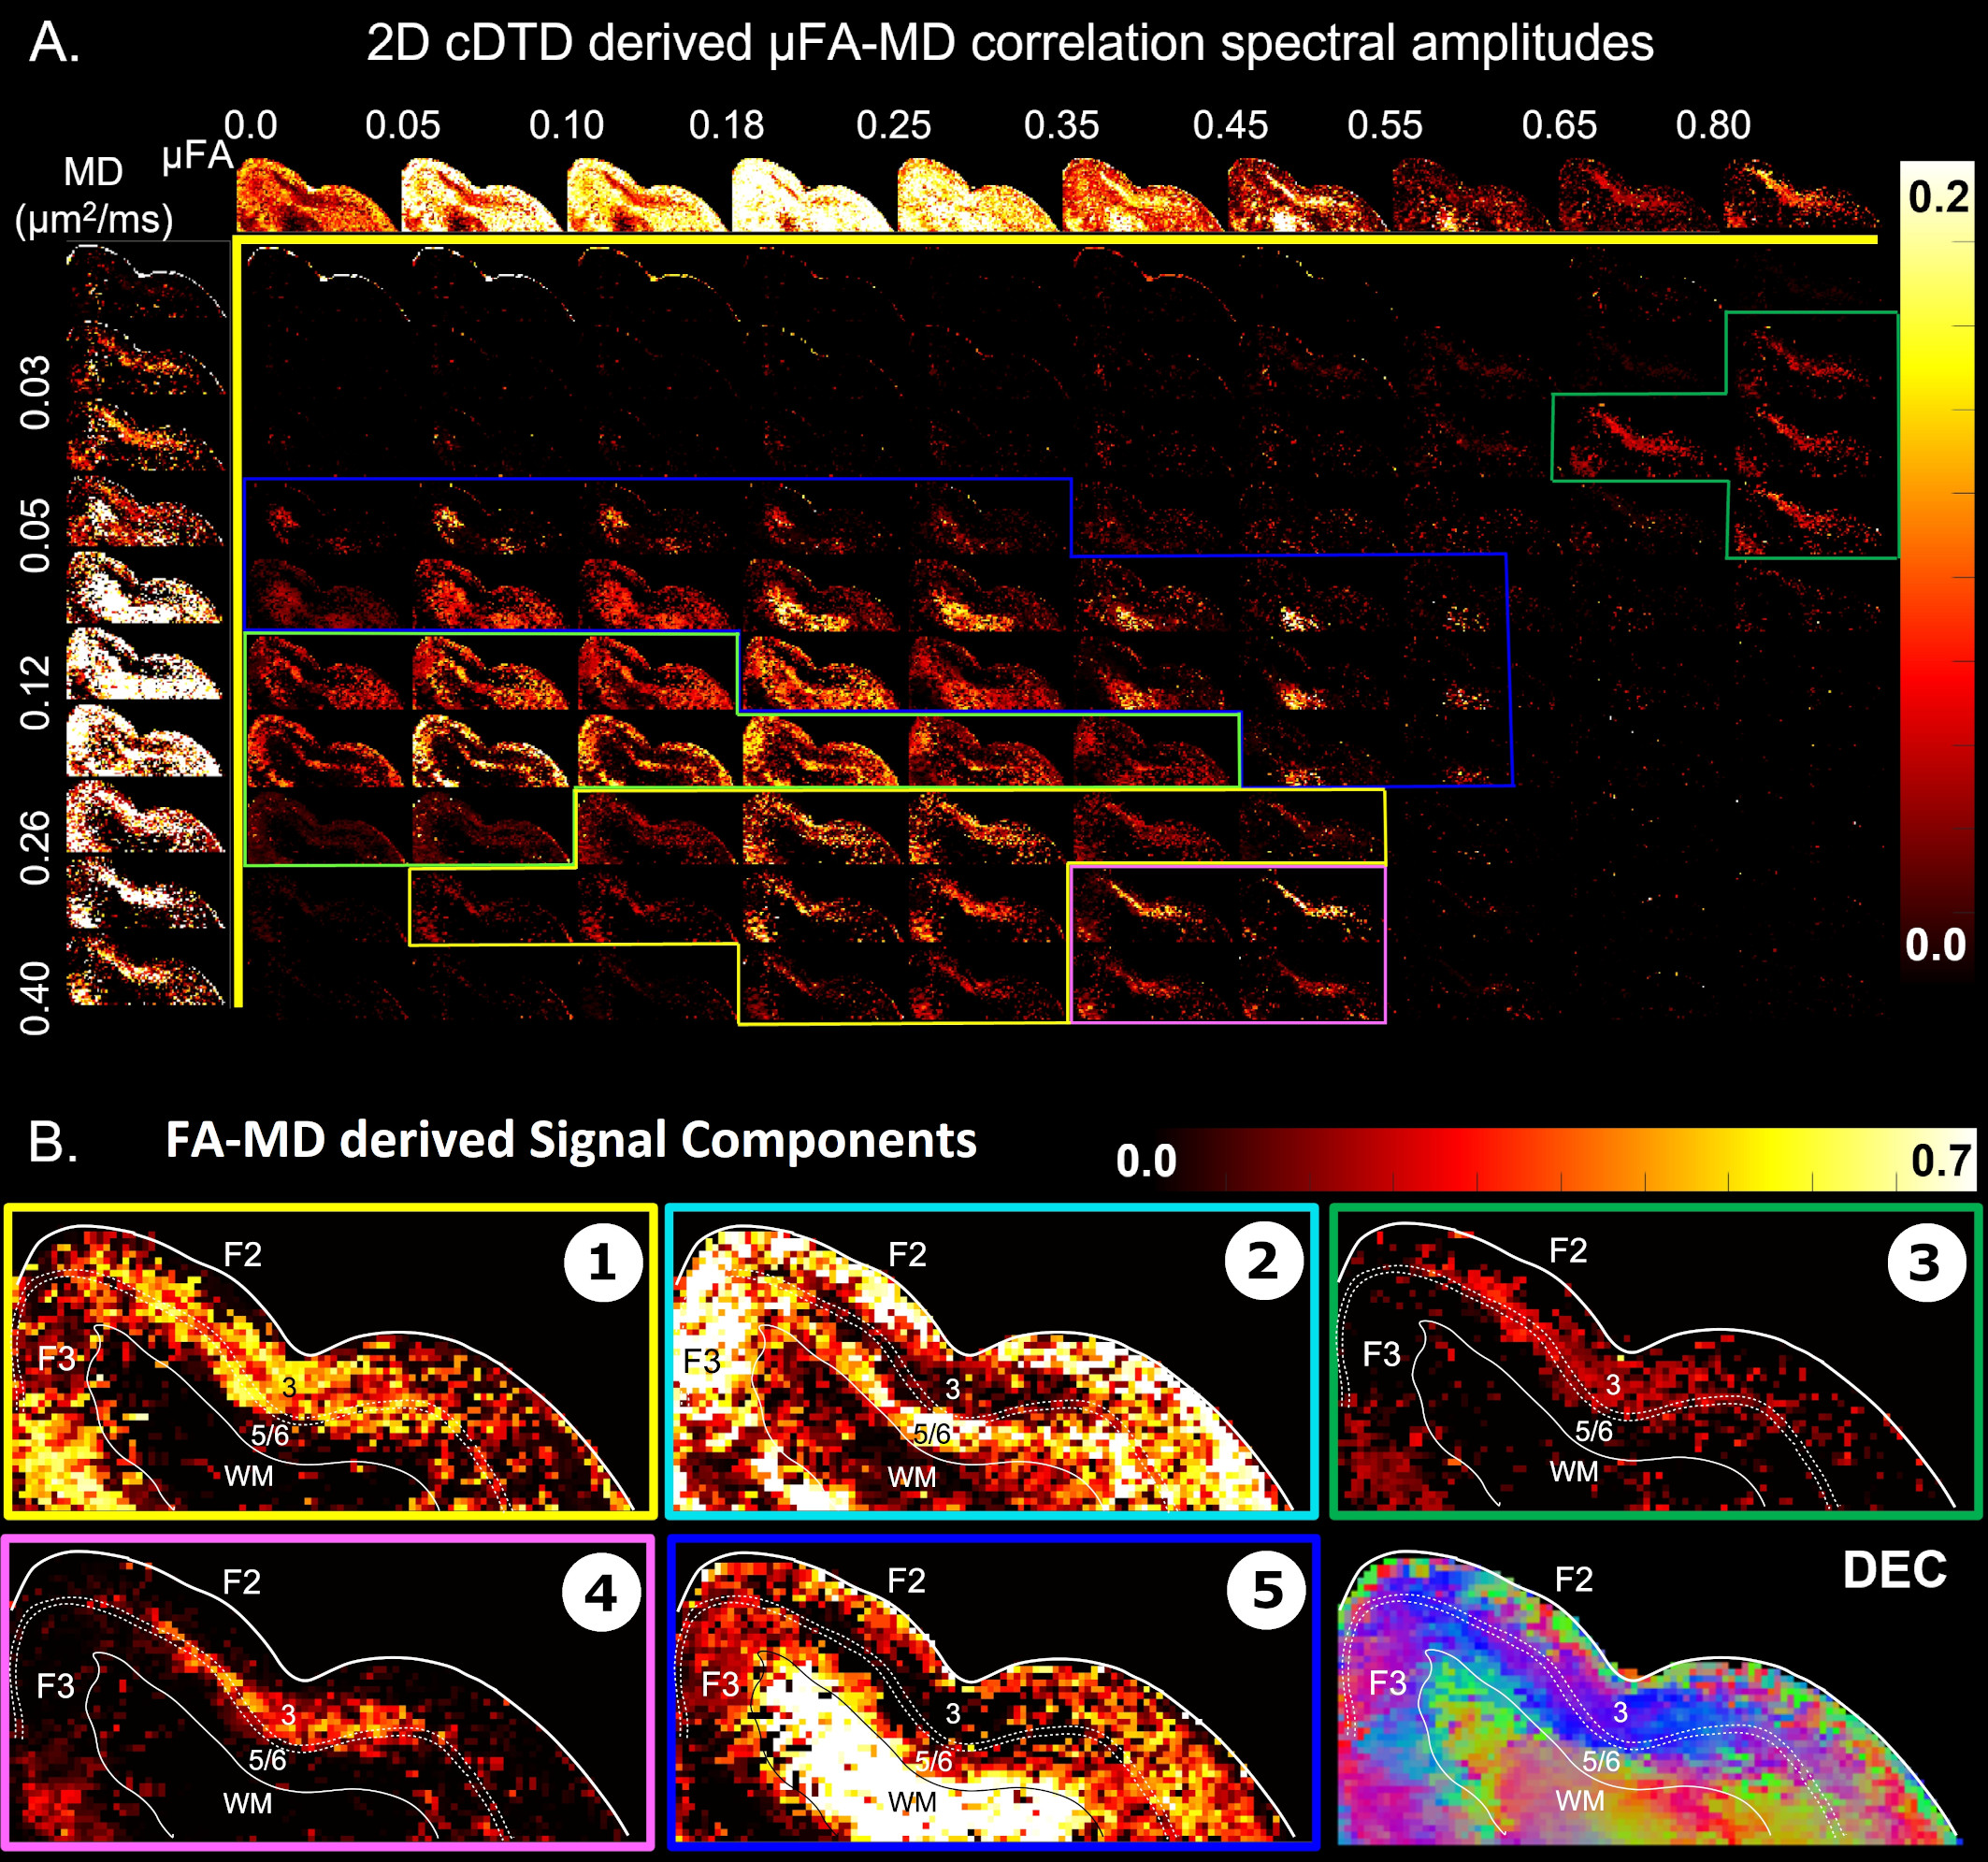
Maps of 2D µFA-MD correlation spectra (Fig. 5) provide a tally of the shape-size characteristics of diffusion tensors in subvoxel/microscopic water pools as a new means to characterize tissue microstructure. Large concentrations of isotropic diffusion processes (µFA<0.18) were observed in the upper cortical layers, and to a lesser extent, in layer 5. The most anisotropic diffusion processes (µFA>0.35) were localized in the mid-cortical layers and in subcortical white matter. The five tissue components with µFA-MD properties defined by the colored outlines in Fig. 5B show laminar patterns consistent with histology (Fig. 4)
Discussion and Conclusion
In tissues with consistent, well-defined architecture, CORTECS MRI greatly simplifies the data acquisition and spectral reconstruction requirements for high-resolution DTD MRI and can subsume many multi-tensor diffusion models. It reduces the dimensionality of non-parametric DTD MRI, allowing robust estimation of non-parametric cDTDs without the need for statistical reconstruction methods7,8 or multiple diffusion encoding acquisitions7-9, which are challenging in clinical practice. Given recent advances in the acquisition efficiency of high-resolution dMRI data10,11, CORTECS MRI could provide a practical approach to non-parametric quantitation of microstructural tissue heterogeneity.Acknowledgements
This work was supported by the Intramural Research Program (IRP) of the Eunice Kennedy Shriver National Institute of Child Health and Human Development, the NIH BRAIN Initiative grant “Connectome 2.0: Developing the next generation human MRI scanner for bridging studies of the micro-, meso- and macro-connectome” (1U01EB026996-01), and the CNRM Neuroradiology-Neuropathology Correlation/Integration Core, 309698-4.01-65310, (CNRM-89-9921). This work utilized computational resources of the NIH HPC Biowulf cluster (http://hpc.nih.gov). The opinions expressed herein are those of the authors and not necessarily representative of those of the Uniformed Services University of the Health Sciences (USUHS), the Department of Defense (DoD), VA, NIH or any other US government agency, or the Henry M. Jackson Foundation.References
1 Aggarwal, M., Nauen, D. W., Troncoso, J. C. & Mori, S. Probing region-specific microstructure of human cortical areas using high angular and spatial resolution diffusion MRI. NeuroImage 105, 198-207, doi:https://doi.org/10.1016/j.neuroimage.2014.10.053 (2015).
2 Leuze, C. W. et al. Layer-specific intracortical connectivity revealed with diffusion MRI. Cereb Cortex 24, 328-339, doi:10.1093/cercor/bhs311 (2014).
3 Assaf, Y. Imaging laminar structures in the gray matter with diffusion MRI. NeuroImage 197, 677-688, doi:https://doi.org/10.1016/j.neuroimage.2017.12.096 (2019).
4 McNab, J. A. et al. Surface-based analysis of diffusion orientation for identifying architectonic domains in the in vivo human cortex. NeuroImage 69, 87-100, doi:https://doi.org/10.1016/j.neuroimage.2012.11.065 (2013).
5 Budde, M. & Annese, J. Quantification of anisotropy and fiber orientation in human brain histological sections. Frontiers in Integrative Neuroscience 7, doi:10.3389/fnint.2013.00003 (2013).
6 Jian, B., Vemuri, B. C., Özarslan, E., Carney, P. R. & Mareci, T. H. A novel tensor distribution model for the diffusion-weighted MR signal. NeuroImage 37, 164-176 (2007).
7 Topgaard, D. Multidimensional diffusion MRI. Journal of Magnetic Resonance 275, 98-113 (2017).
8 Magdoom, K. N., Pajevic, S., Dario, G. & Basser, P. J. A new framework for MR diffusion tensor distribution. Scientific Reports 11, 2766, doi:10.1038/s41598-021-81264-x (2021).
9 Westin, C.-F. et al. Q-space trajectory imaging for multidimensional diffusion MRI of the human brain. NeuroImage 135, 345-362 (2016).
10 Wang, F. et al. In vivo human whole-brain Connectome diffusion MRI dataset at 760 µm isotropic resolution. Scientific Data 8, 122, doi:10.1038/s41597-021-00904-z (2021).
11 Huang, S. Y. et al. Connectome 2.0: Developing the next-generation ultra-high gradient strength human MRI scanner for bridging studies of the micro-, meso- and macro-connectome. NeuroImage 243, 118530, doi:https://doi.org/10.1016/j.neuroimage.2021.118530 (2021).
Figures