0679
Frequency-dependent diffusion-relaxation multidimensional MRI of the human brain1National Institute on Aging, Baltimore, MD, United States, 2National Institute on Drug Abuse, Baltimore, MD, United States, 3Lund University, Lund, Sweden
Synopsis
Keywords: Microstructure, Diffusion/other diffusion imaging techniques
Using an integrative acquisition and processing pipeline that joins concepts from oscillating gradients, tensor-valued encoding, and diffusion-relaxation correlation, we comprehensively explored microstructure and local chemical composition in the human brain. Using both frequency-dependent and tensorial aspects of the encoding spectrum b(ω), we designed an in vivo, whole brain, 40-min 7D D(ω)-R1-R2 distribution acquisition protocol at 2mm isotropic resolution. Scanning eleven healthy participants, we demonstrated frequency/time-dependent changes of diffusion-relaxation correlations measures in the human brain. Finally, intra-scan test–retest repeatability of a range of reconstructed parametric maps was investigated.
Introduction
Diffusion-relaxation correlation NMR1-5 maximizes the amount of encoded chemical and microstructural information by probing relaxation and diffusion mechanisms simultaneously. Over the past decade, these methods were combined with spatially resolved measurements6-8 and applied ex- and in vivo.9-14 Recently, acquisition schemes with free gradient waveforms exploring both the frequency-dependent and tensorial aspects of the encoding spectrum b(ω) have enabled estimation of nonparametric distributions of frequency-dependent diffusion tensors.15We have incorporated the concepts of diffusion tensor distributions,16-18 tensor-valued encoding,19-21 Monte Carlo inversion,22,23 and frequency-dependent diffusion tensors15 into a single framework. Building on previous 7D D(ω)-R1-R2 “massively multidimensional” MRI ex vivo study,24 we adapt this method to a 40 min whole brain in vivo acquisition protocol at 2 mm isotropic resolution, perform brain imaging on healthy participants, and asses test-retest reliability.
Methods
Eleven healthy participants (ages 37.8±11.0 years, 7 women) were scanned on a 3T system (MAGNETOM Prisma, Siemens Healthcare AG, Erlangen, Germany) with a 32-channel head coil. A subset of three participants were scanned twice, a few weeks apart, to allow assessment of test-retest reliability. Data were acquired using a single-shot spin-echo EPI sequence modified for tensor-valued diffusion encoding.25 Numerically optimized26 linear, planar, and spherical b-tensors were employed with b-values ranging between 0.1 and 3ms/µm2. Here we augment the data acquisition scheme with exploration of the ω-dimension of b(ω) in the range of 6.5-21.5Hz centroid frequencies to allow decoupling of frequency-dependent diffusion components. Sensitivity to R1 and R2 was achieved by acquiring data with different combinations of repetition- and echo times (Figure 1).The data were first preprocessed using the TORTOISE package,27-29 and subsequently processed in Matlab R2019b (MathWorks, Natick, MA) using the 7D Monte Carlo inversion algorithm24 as implemented in the multidimensional diffusion MRI toolbox.30 The components of the inversion, i.e., axial and radial diffusivities [D||,D⊥], azimuthal and polar angles [Θ,Φ], longitudinal and transversal relaxation rates [R1,R2], along with high frequency isotropic diffusivity D0, and axial and radial transition frequencies, $$$\Gamma_{||}$$$ and $$$\Gamma_{\bot}$$$,15 were sampled in the ranges 0.05$$$\leq$$$D||/⊥/0$$$\leq$$$5µm2/ms,0$$$\leq$$$Θ$$$\leq$$$p,0$$$\leq$$$Φ$$$\leq$$$2p,0.2$$$\leq$$$R1$$$\leq$$$2s-1,1$$$\leq$$$R2$$$\leq$$$30s-1,0.01$$$\leq\Gamma_{\bot/||}\leq$$$10000s-1.
The dimensions of the D(ω)-R1-R2 distributions in the primary analysis space [D||,D⊥,Θ,Φ,D0,G||,G⊥,R1,R2] were evaluated at selected values of ω within the narrow 6.5-21.5Hz window actually probed by the gradient waveforms, giving a set of ω-dependent distributions in the [D||(ω),D⊥(ω),Θ,Φ,R1,R2] space. For each value of ω, the results are visualized as ω-independent distributions by projecting D||(ω) and D⊥(ω) to the dimensions of isotropic diffusivity Diso(ω) and squared normalized anisotropy DΔ2(ω),24 and mapping means, variances, and covariances over relevant dimensions and sub-divisions (“bins”) of the distribution space, roughly corresponding to white matter (WM), gray matter (GM), and CSF. Following conventions often used to display results from oscillating gradient encoding,31 the effects of restricted diffusion were quantified by a finite difference approximation of the rate of change of the diffusivity metrics with frequency within the investigated window, which in our case was 21.5Hz and 6.5Hz.
Using a subset of three participants with repeat visits, test-retest variability (VAR) was calculated as percentage of difference in proportion to average of test and retest acquisitions (|scan1-scan2|/[[scan1+scan2]/2]) of whole-brain average values of seven parametric maps: E[Diso], E[DΔ2], E[R1], E[R2], fbin1, fbin2, and fbin3. In addition, we computed the intra class correlation coefficient for single measurement (ICC(3,1)) to evaluate the reliability of these measures.32-34
Results
Figure 2 shows experimental and fitted signals and corresponding 2D projections from full D(ω)-R1-R2 distributions in four representative voxels associated with WM in the corpus callosum, cortical GM, border of cortex and WM, and CSF in the ventricles. The distributions reflect the microstructural differences of the respective tissue type, e.g., comparable Diso yet high DΔ2 in WM compared with GM, and fastest relaxation in WM. Note the strong frequency dependency at the border of cerebral cortex and WM, where a highly anisotropic component at low frequency vanishes at 23Hz.Figure 3 displays axial maps of global and bin-specific statistical descriptors of D(ω)-R1-R2 from a representative subject. The contrasts are in good agreement with previously published D-R1-R2 data.25 We observed spatial patterns of rate of frequency change of the diffusivity metrics, e.g., predominantly positive or negative values of Diso or DΔ2, respectively, in the occipital cortex. To get a more comprehensive description of the diffusion frequency dependencies in the brain, we used the earth mover’s distance (EMD)35 to quantify the voxelwise difference between 7D D(ω)-R1-R2 spectra at given diffusion frequency. Pairwise EMD values at 6 diffusion frequencies are summarized in a distance matrix, shown in Figure 4. Strongest frequency dependencies were observed in deep WM and cortical brain regions. Lastly, the ICC(3,1) and VAR values for repeatability and variability were generally high or low, respectively, for all measures (Figure 5).
Discussion
We showed that “massively” multidimensional diffusion-relaxation correlation MRI, which joins diffusion-relaxation correlation, time/frequency dependent diffusion, and tensor-valued encoding, is feasible on a clinical system at whole-brain 2mm isotropic resolution using a 40-min acquisition protocol. The resulting voxelwise nonparametric D(ω)-R1-R2 distributions provide unprecedented level of detail with respect to local chemical composition and microstructure. While we intend to carefully map brain regions and expand the diffusion frequency range in the future, our preliminary results show a clear pattern of frequency-dependent diffusion-relaxation correlation in the human brain.Acknowledgements
This work was supported by the Intramural Research Program of the National Institute on Aging and the National Institute on Drug Abuse of the National Institutes of Health.References
1. Galvosas, P. and P.T. Callaghan, Multi-dimensional inverse Laplace spectroscopy in the NMR of porous media. Comptes Rendus Physique, 2010. 11(2): p. 172-180
2. Bernin, D. and D. Topgaard, NMR diffusion and relaxation correlation methods: New insights in heterogeneous materials. Current Opinion in Colloid & Interface Science, 2013. 18(3): p. 166-172
3. Song, Y.-Q., et al., Chapter 4: Two-dimensional NMR of Diffusion and Relaxation, in Diffusion NMR of Confined Systems: Fluid Transport in Porous Solids and Heterogeneous Materials. 2017, The Royal Society of Chemistry. p. 111-155
4. Tax, C.M., Estimating Chemical and Microstructural Heterogeneity by Correlating Relaxation and Diffusion. Advanced Diffusion Encoding Methods in MRI, 2020. 24: p. 186
5. Benjamini, D. and P.J. Basser, Multidimensional correlation MRI. NMR in Biomedicine, 2020. 33(12): p. e4226
6. Zhang, Y. and B. Blümich, Spatially resolved D–T2 correlation NMR of porous media. Journal of Magnetic Resonance, 2014. 242: p. 41-48
7. Kim, D., et al., Diffusion-relaxation correlation spectroscopic imaging: A multidimensional approach for probing microstructure. Magnetic Resonance in Medicine, 2017. 78(6): p. 2236-2249
8. Benjamini, D. and P.J. Basser, Magnetic resonance microdynamic imaging reveals distinct tissue microenvironments. NeuroImage, 2017. 163: p. 183-196
9. De Santis, S., et al., T1 relaxometry of crossing fibres in the human brain. NeuroImage, 2016. 141: p. 133-142
10. De Santis, S., et al., Resolving relaxometry and diffusion properties within the same voxel in the presence of crossing fibres by combining inversion recovery and diffusion-weighted acquisitions. Magnetic Resonance in Medicine, 2016. 75(1): p. 372-380
11. Veraart, J., D.S. Novikov, and E. Fieremans, TE dependent Diffusion Imaging (TEdDI) distinguishes between compartmental T2 relaxation times. NeuroImage, 2018. 182: p. 360-369
12. Veraart, J., et al., Model-based Analysis of Advanced Diffusion Data. Advanced Diffusion Encoding Methods in MRI, 2020. 24: p. 317
13. Slator, P.J., et al., Combined diffusion-relaxometry MRI to identify dysfunction in the human placenta. Magnetic Resonance in Medicine, 2019. 82(1): p. 95-106
14. Benjamini, D., Priemer, D.S., Perl, D.P., Brody, D.L., and Basser, P.J. Mapping astrogliosis in the individual human brain using multidimensional MRI. Brain, awac298, https://doi.org/10.1093/brain/awac298
15. Narvaez O, et al. Model-free Approach to the Interpretation of Restricted and Anisotropic Self-Diffusion in Magnetic Resonance of Biological Tissues. arXiv [Preprint], 2021.
16. Basser, P.J. and S. Pajevic, A normal distribution for tensor-valued random variables: applications to diffusion tensor MRI. IEEE Transactions on Medical Imaging, 2003. 22(7): p. 785-794
17. Jian, B., et al., A novel tensor distribution model for the diffusion-weighted MR signal. NeuroImage, 2007. 37(1): p. 164-176
18. Topgaard, D., Diffusion tensor distribution imaging. NMR in Biomedicine, 2019. 32(5): p. e4066
19. Westin, C.-F., et al. Measurement Tensors in Diffusion MRI: Generalizing the Concept of Diffusion Encoding. 2014. Cham: Springer International Publishing
20. Topgaard, D., Multidimensional diffusion MRI. Journal of Magnetic Resonance, 2017. 275: p. 98-113
21. Reymbaut, A., Diffusion Anisotropy and Tensor-valued Encoding. Advanced Diffusion Encoding Methods in MRI, 2020. 4: p. 68
22. Prange, M. and Y.-Q. Song, Quantifying uncertainty in NMR T2 spectra using Monte Carlo inversion. Journal of Magnetic Resonance, 2009. 196(1): p. 54-60
23. de Kort, D.W., et al., NMR Nanoparticle Diffusometry in Hydrogels: Enhancing Sensitivity and Selectivity. Analytical Chemistry, 2014. 86(18): p. 9229-9235
24. Narvaez, O., et al. Massively Multidimensional Diffusion-Relaxation Correlation MRI. Frontiers in Physics, 2022. 9.
25. Martin, J., et al. Nonparametric D-R1-R2 distribution MRI of the living human brain. NeuroImage, 2021. 245: 118753.
26. Sjölund, J., et al., Constrained optimization of gradient waveforms for generalized diffusion encoding. Journal of Magnetic Resonance, 2015. 261: p. 157-168
27. Pierpaoli C, Walker L, Irfanoglu MO, Barnett AS, Chang LC, Koay CG et al. TORTOISE: An integrated software package for processing of diffusion MRI data. In Proceedings of International Society of Magnetic Resonance in Medicine; 2010, p.1597.
28. Irfanoglu M.O., Nayak A, Jenkins J, Pierpaoli C. TORTOISEV3: Improvements and New Features of the NIH Diffusion MRI Processing Pipeline, In Proceedings of International Society of Magnetic Resonance in Medicine; 2017, p.3540.
29. Johnson JTE, Irfanoglu MO, Ross TJ, Yang Y, Topgaard D, Benjamini D. Evaluating preprocessing strategies for diffusion-relaxation correlation multidimensional MRI, In Proceedings of International Society of Magnetic Resonance in Medicine; 2023.
30. Nilsson, M., et al. An open-source framework for analysis of multidimensional diffusion MRI data implemented in MATLAB. in Proc Intl Soc Mag Reson Med. 2018
31. Aggarwal, M., et al. Probing mouse brain microstructure using oscillating gradient diffusion MRI. Magnetic Resonance in Medicine, 2012. 67(1): 98–109.
32. Shrout, P.E., & Fleiss, J.L. Intraclass correlations: Uses in assessing rater reliability. Psychological Bulletin, 1979. 86(2), 420–428.
33. Koo, T. K., & Li, M. Y. A Guideline of Selecting and Reporting Intraclass Correlation Coefficients for Reliability Research. Journal of Chiropractic Medicine, 2016. 15(2), 155–163.
34. Landis, J.R., & Koch, G.G. The Measurement of Observer Agreement for Categorical Data. Biometrics, 1977. 33(1), 159.
35. Rubner, Y., Tomasi, C., & Guibas, L. J. A metric for distributions with applications to image databases. Sixth International Conference on Computer Vision (IEEE Cat. No.98CH36271). 1998, 59–66.
Figures
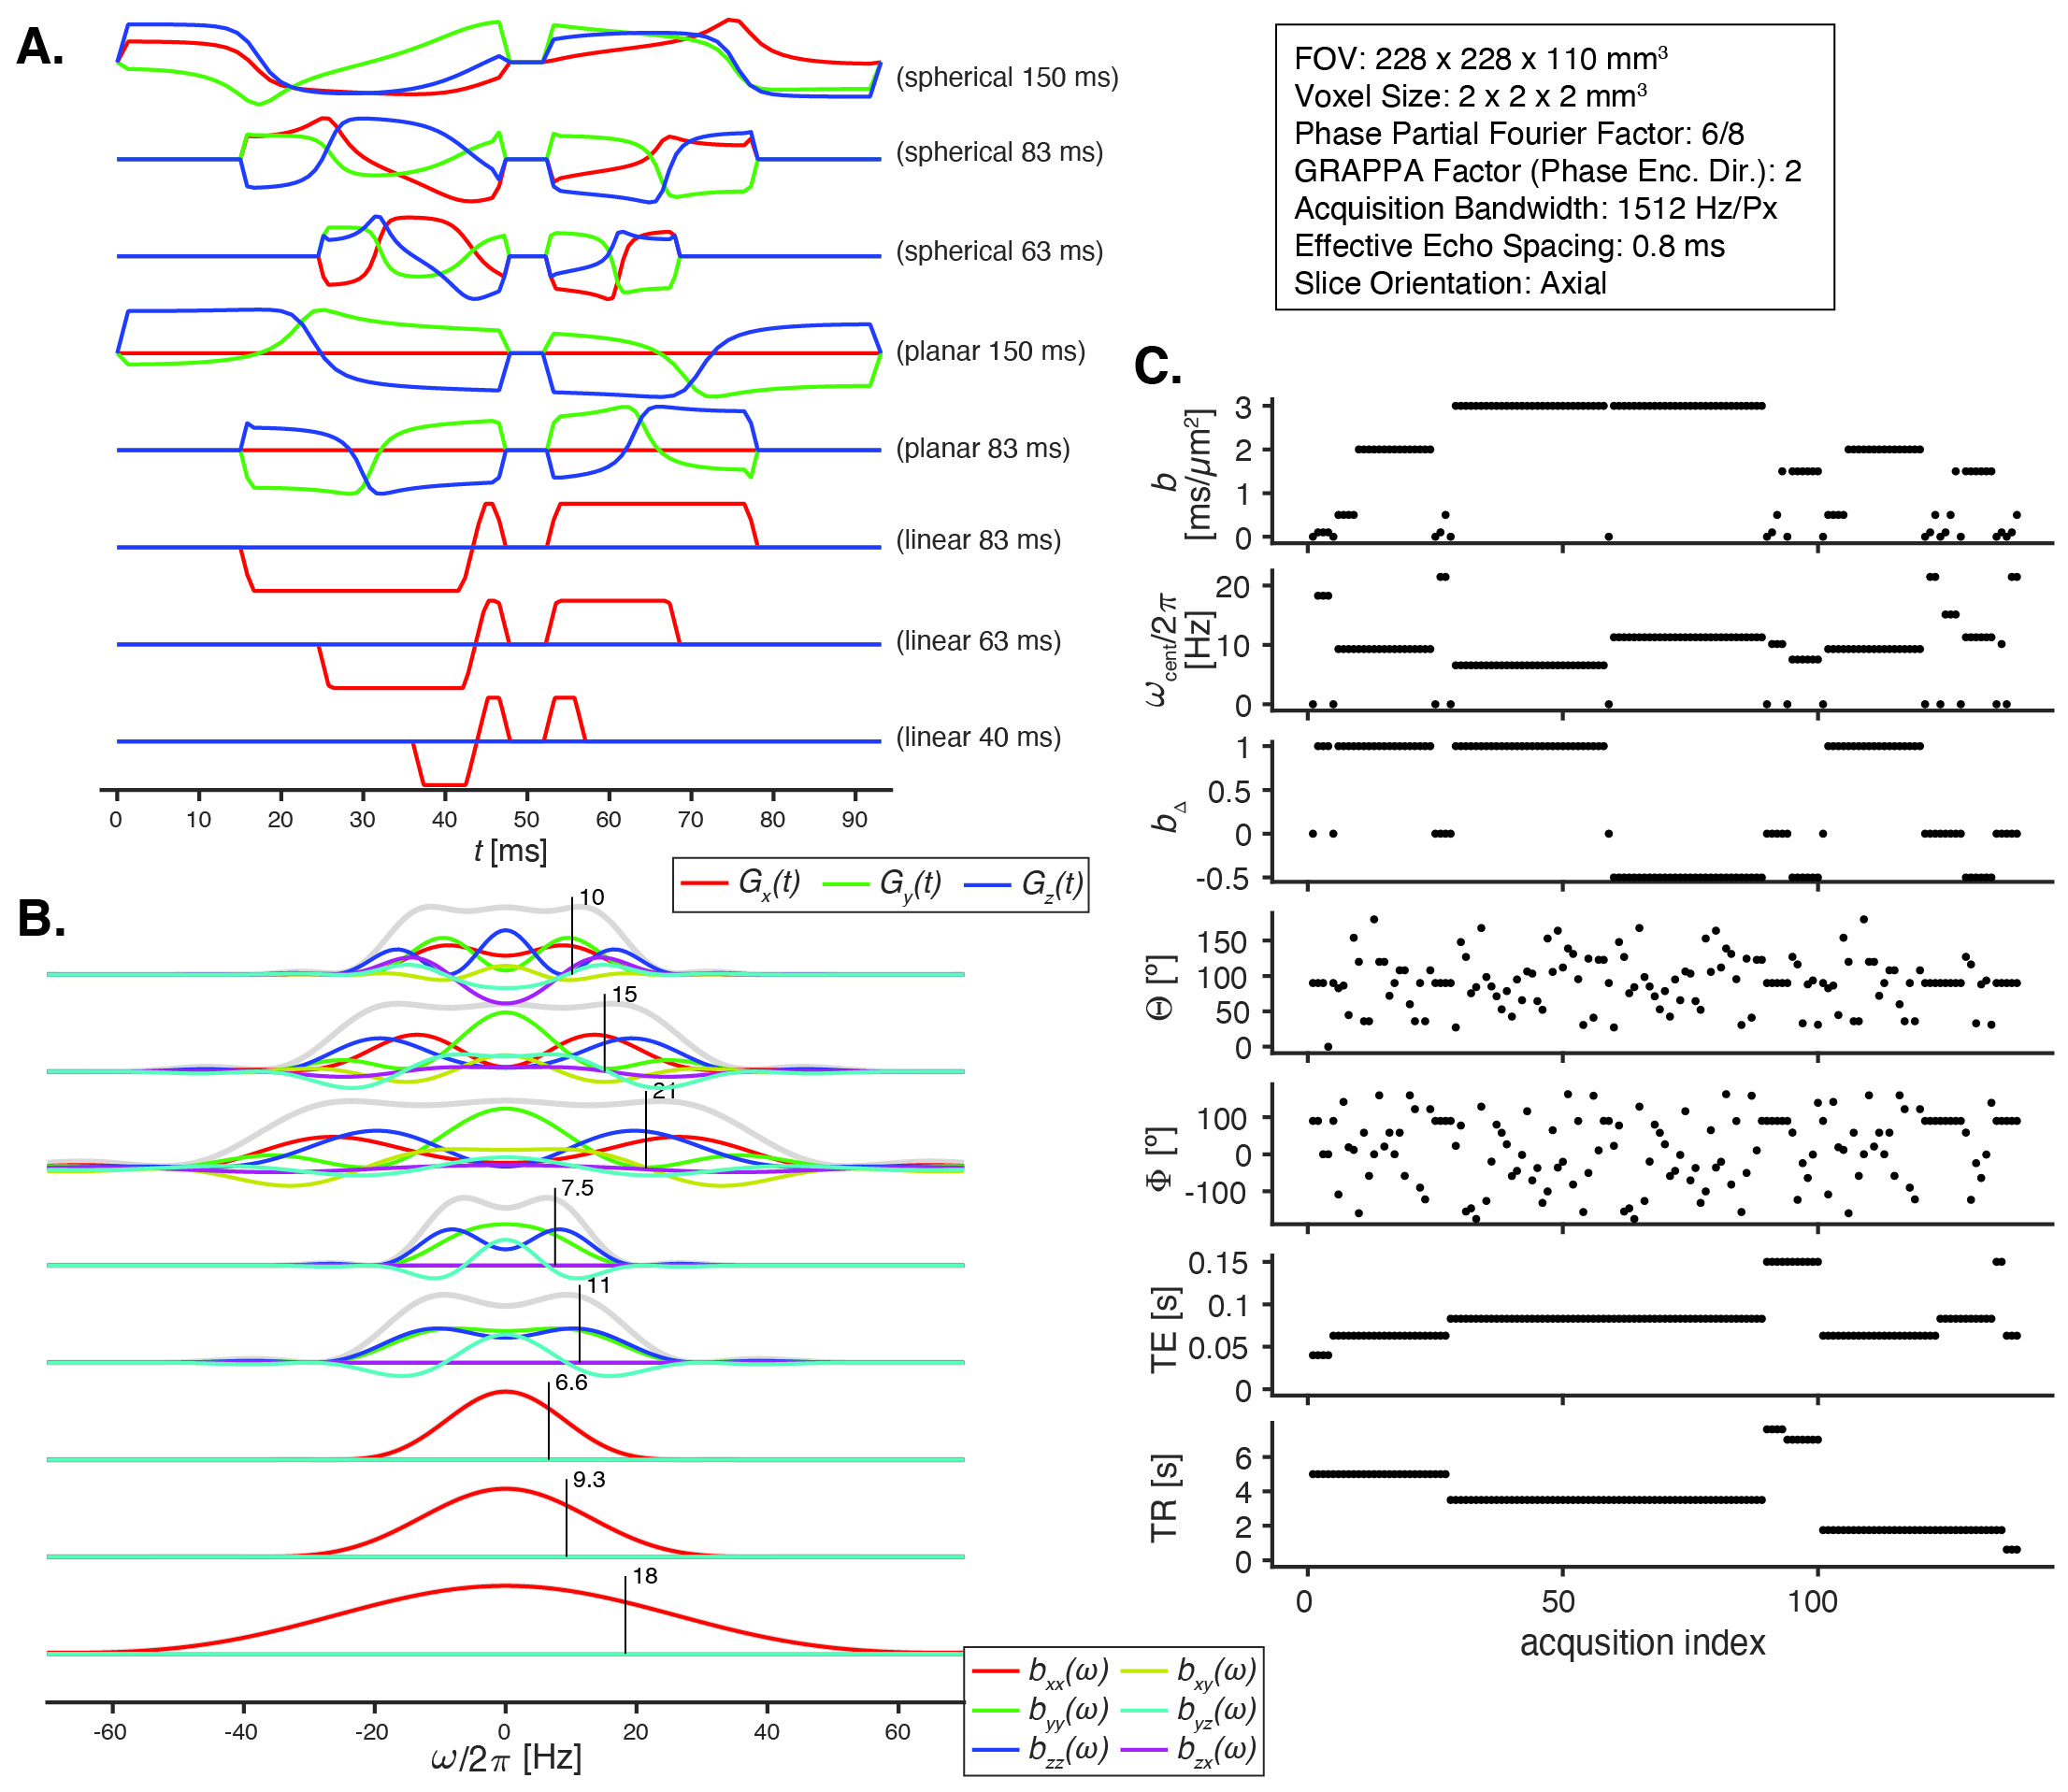
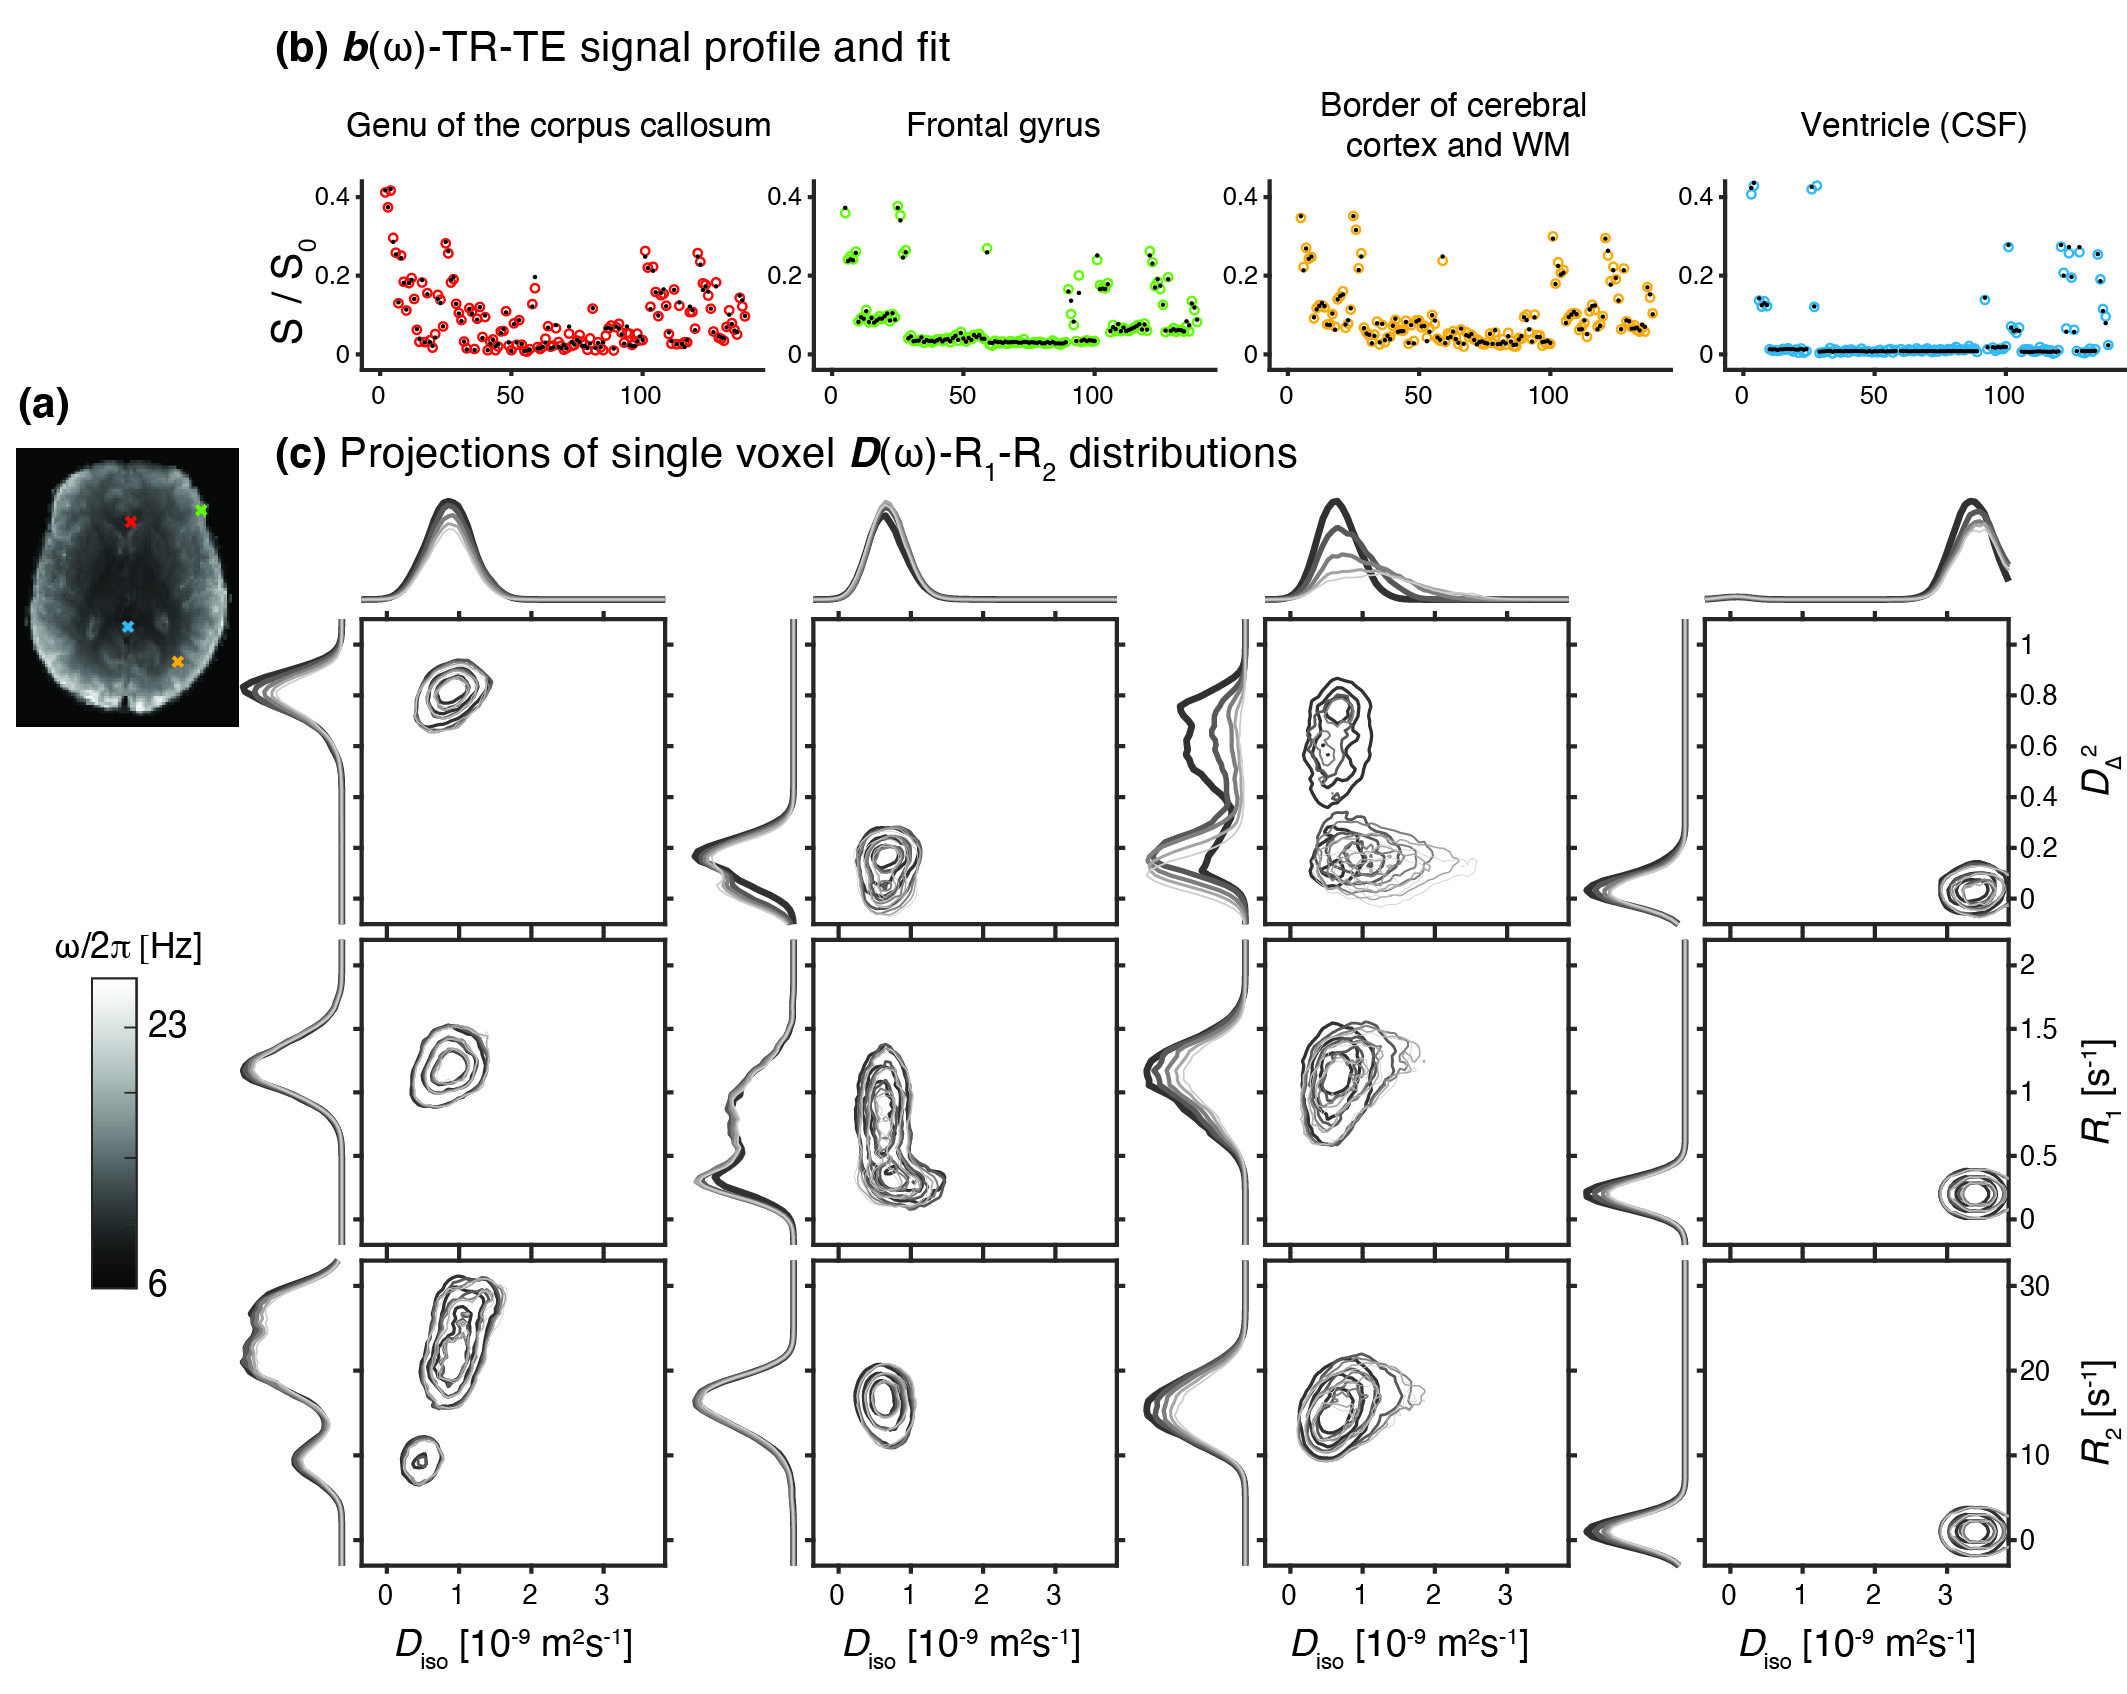
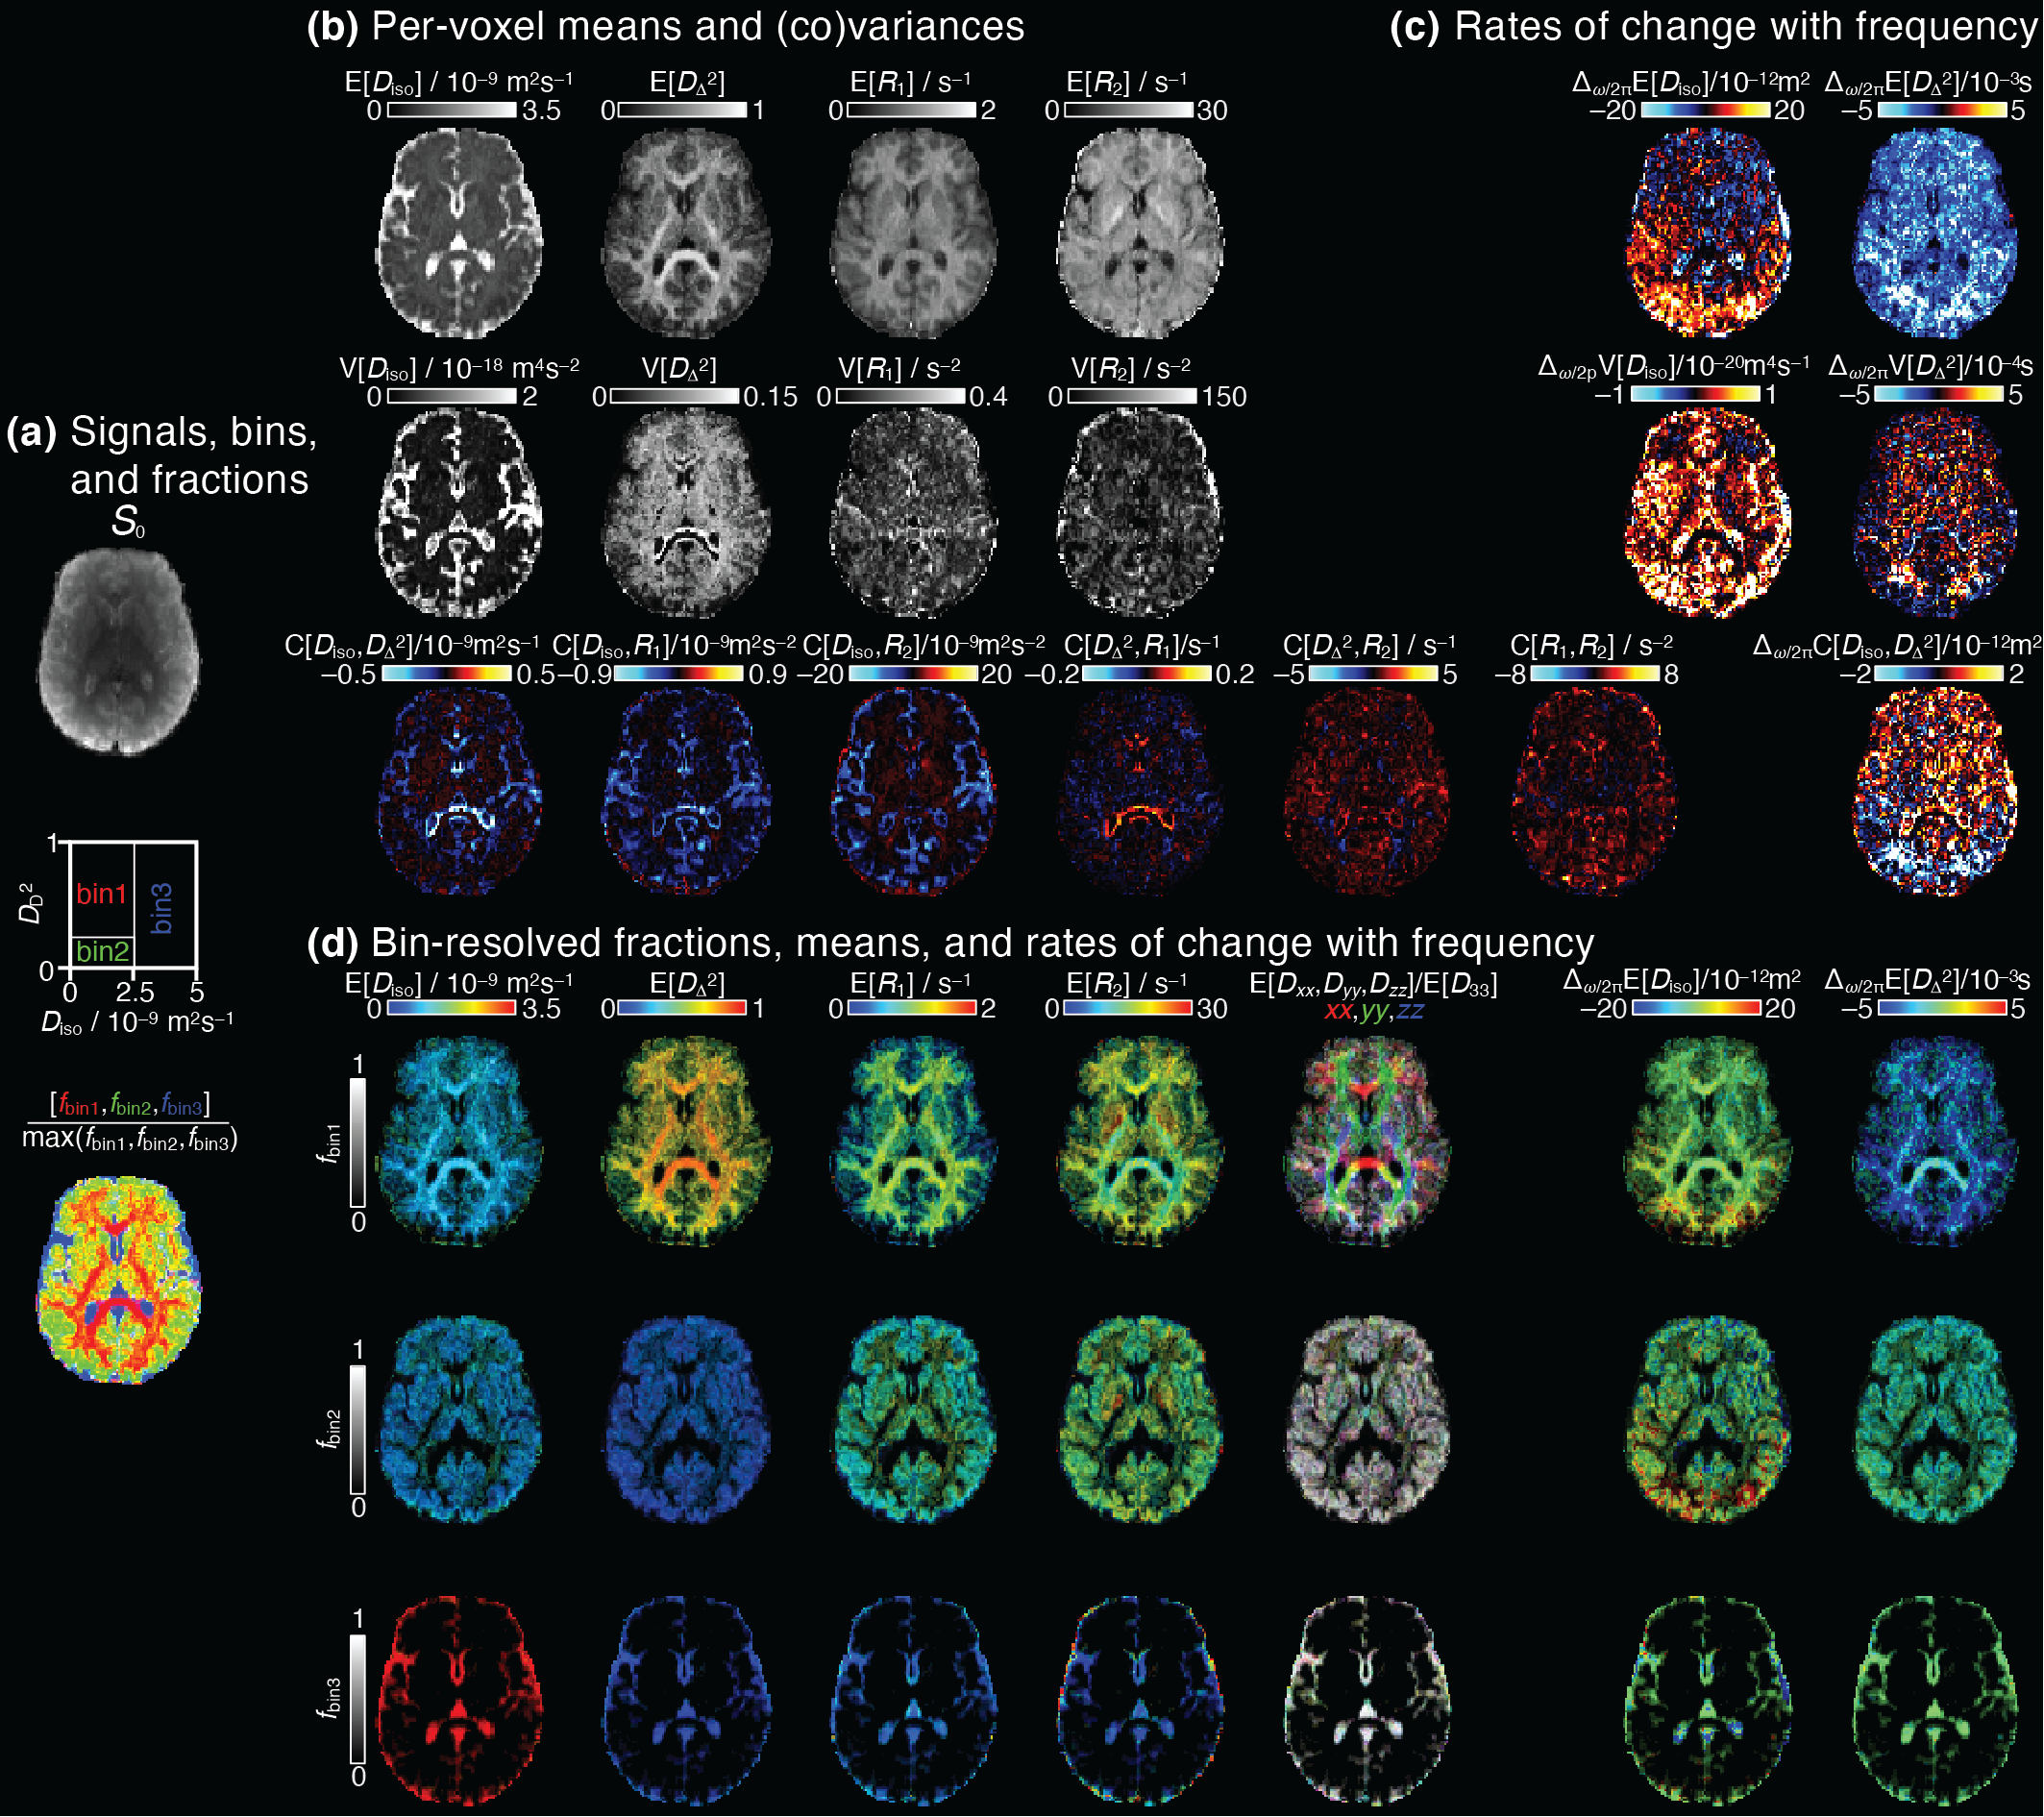
Figure 3. Parameter maps derived from voxelwise D(ω)-R1-R2 distributions. (a) S0 map displayed in gray scale, diagram with the division of the 2D Diso-DΔ2 projection into three bins (bin1,bin2,bin3), and the resulting signal fractions (fbin1,fbin2,fbin3) coded into RGB color. (b) Per-voxel means E[x], variances V[x], and covariances C[x,y] at frequency 6.5Hz. (c) Parameter maps of the rate of change with frequency, Δω/2π. (d) Bin-resolved maps of E[x] and Δω/2πE[x]. The brightness and color scales represent, respectively, the signal fractions and the values of each parameter.
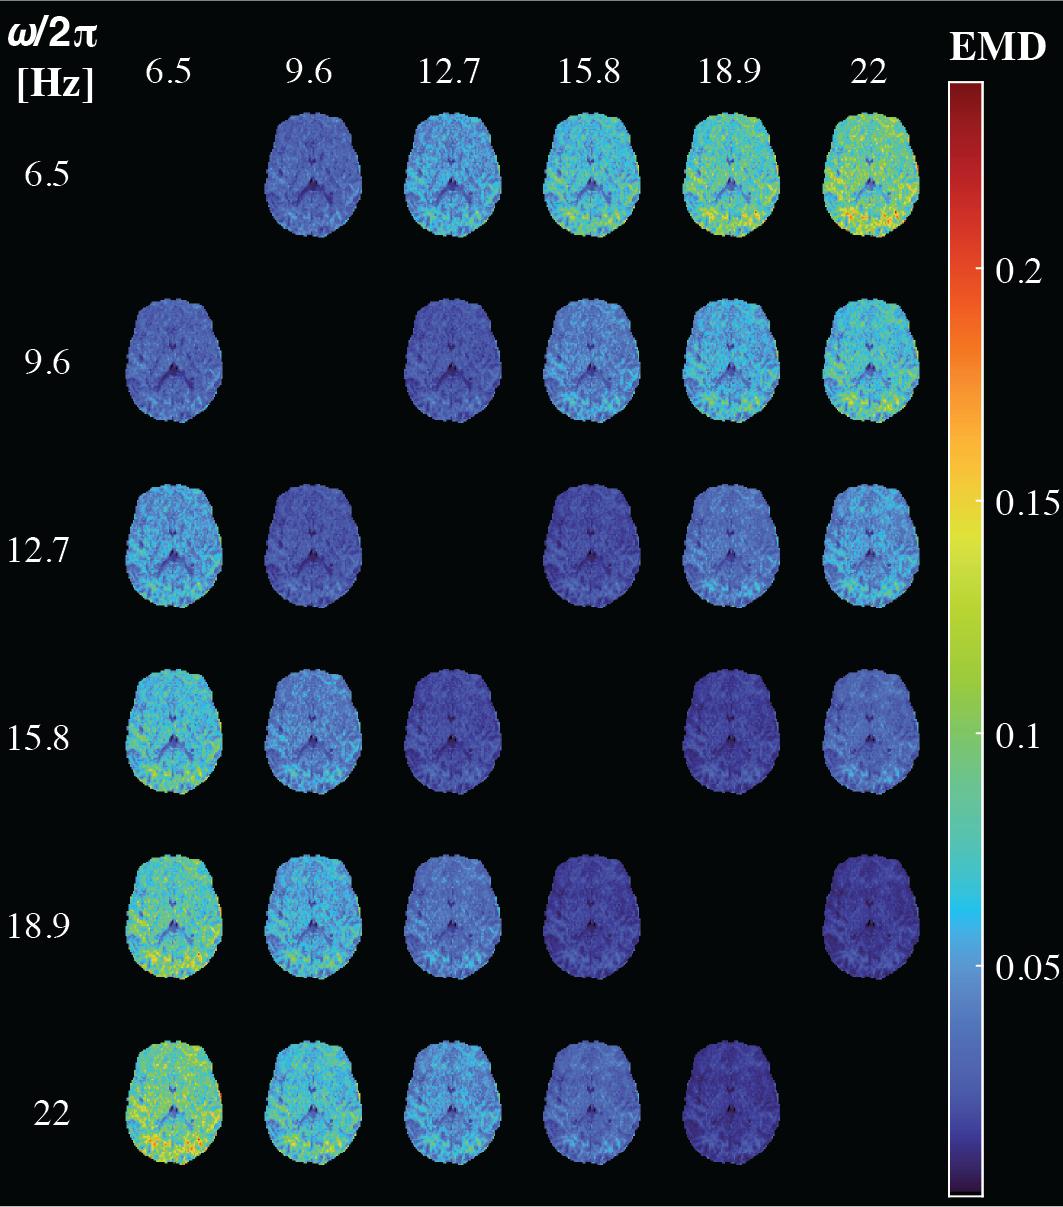
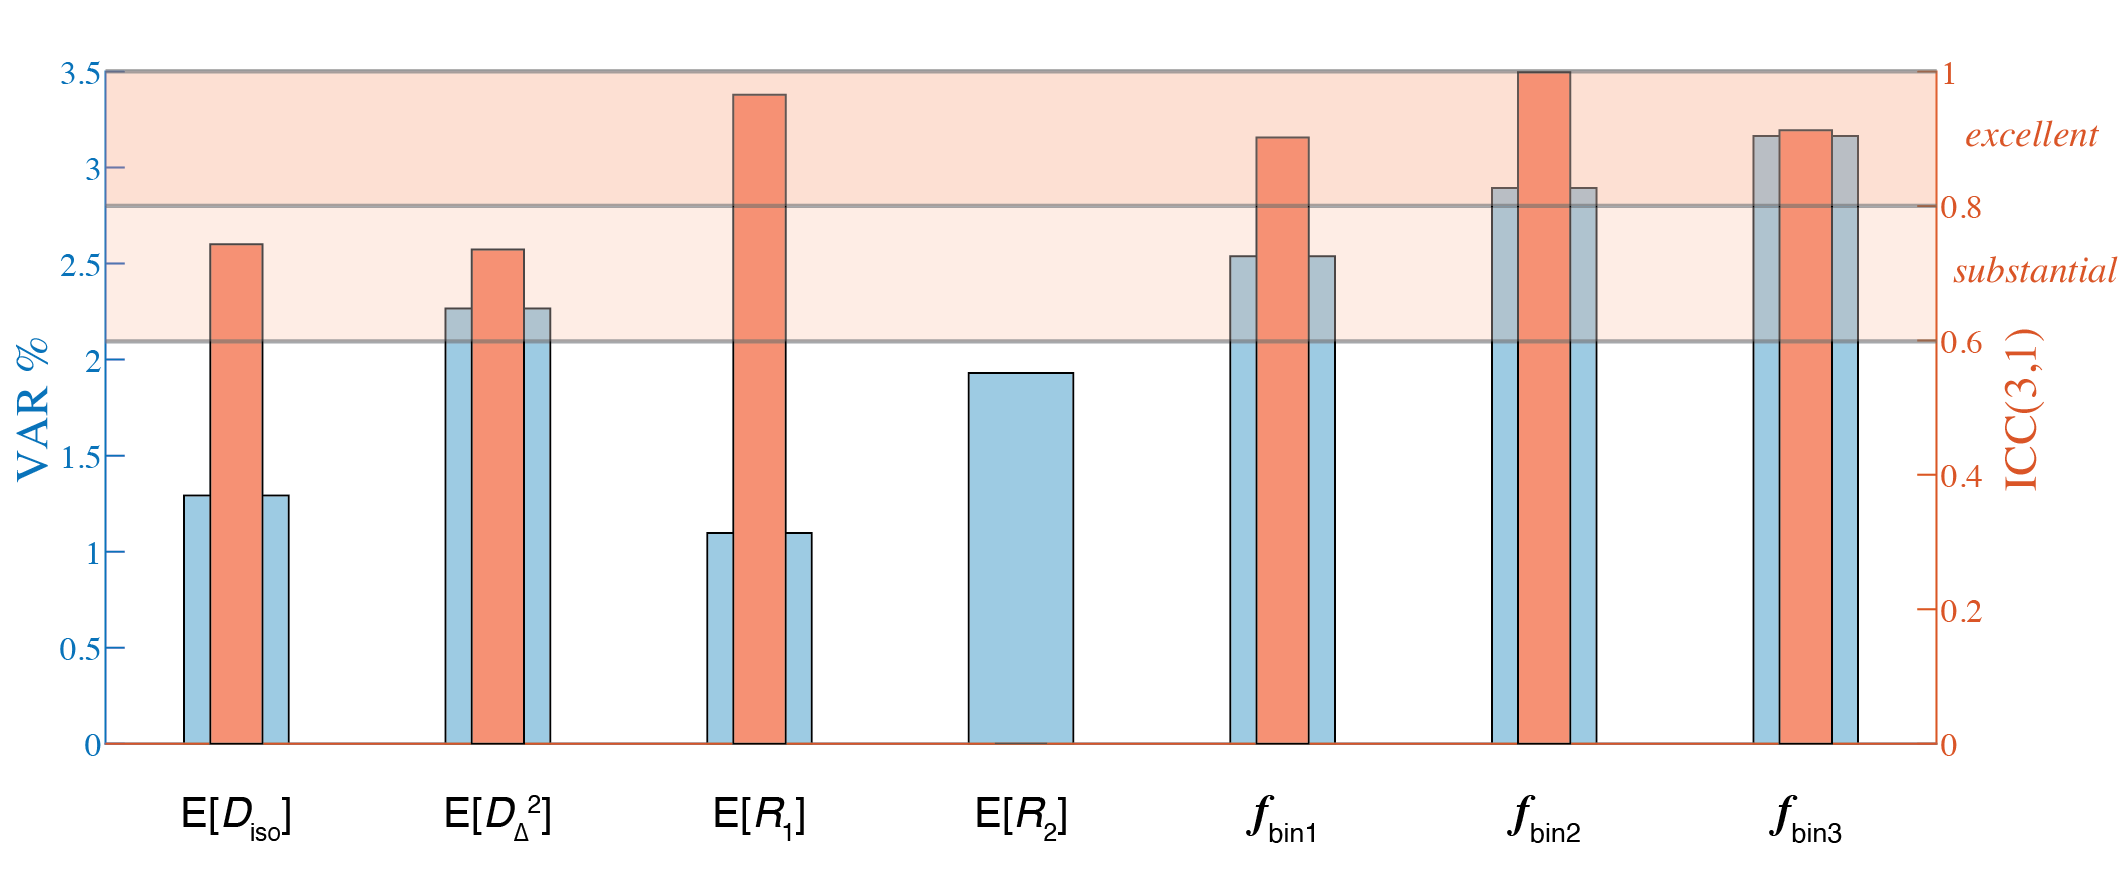
Figure 5. Test-retest variability (VAR) and repeatability (ICC(3,1)) calculated from a subset of three participants with repeat visits. Whole-brain averages were used, and VAR and ICC(3,1) are shown for seven parametric maps: E[Diso], E[DΔ2], E[R1], E[R2], fbin1, fbin2, and fbin3. E[R2] yielded negative ICC, which is theoretically difficult to interpret, and therefore was set to zero.