0674
Quantifying Free-breathing Murine Tracheal Dynamics Using Retrospectively-Gated Ultra-short Echo-time (UTE) in MRI1Pulmonary Medicine, Cincinnati Children's Hospital Medical Center, Cincinnati, OH, United States, 2Radiology, Cincinnati Children's Hospital Medical Center, Cincinnati, OH, United States, 3Pediatrics, University of Cincinnati, Cincinnati, OH, United States, 4Biomedical Engineering, University of Cincinnati, Cincinnati, OH, United States
Synopsis
Keywords: Quantitative Imaging, Preclinical, Ultra-short Echo-time (UTE), trachea
The trachea expands and retracts almost uniformly while breathing, but these dynamics are altered by congenital malformation and injury to tracheal cartilage. Tracheal collapse—tracheomalacia—is a common comorbidity in of disorders, including bronchopulmonary dysplasia (BPD), idiopathic pulmonary fibrosis (IPF) and cystic fibrosis (CF) and can cause life-threatening airway obstruction. While tracheomalacia is clinically diagnosed via bronchoscopy, no tool exists to noninvasively assess tracheal dynamics in small animal models. Here we use retrospectively gated, 3D UTE to resolve changes in tracheal caliber during tidal breathing and show these dynamics change as a function of tracheal position and breathing rate.Introduction
The healthy trachea remains cylindrical, while lengthening and widening during inspiration, but these dynamics are altered in a range of disorders. Obstructive sleep apnea is associated with abnormally large tracheal displacement during breathing[1]. Tracheomalacia is dynamic tracheal collapse during exhalation and results from congenital malformation, chronic infection, and acute or recurrent injury to normally rigid tracheal cartilage [2]. Tracheomalacia, can cause life-threatening breathing obstruction, is associated with cardiac abnormalities and developmental delay, and is a common comorbidity in important pulmonary disease, including bronchopulmonary dysplasia, idiopathic pulmonary fibrosis, cystic fibrosis, and emphysema [3-8].For many pulmonary diseases, life-extending therapies have emerged—in part due to mechanistic understanding obtained via mouse models [9-11]. However, relating molecular insights from small animals to pathophysiology remains challenging. This is especially true for tracheomalacia, because bronchoscopy is the clinical standard for diagnosis, and it is almost impossible to perform similar, minimally invasive examinations on ~25-g animals [12]. We address this methodological gap by quantifying airway dynamics noninvasively in mice using retrospectively-gated, 3D ultra-short echo-time (UTE) MRI [13-16].
Methods
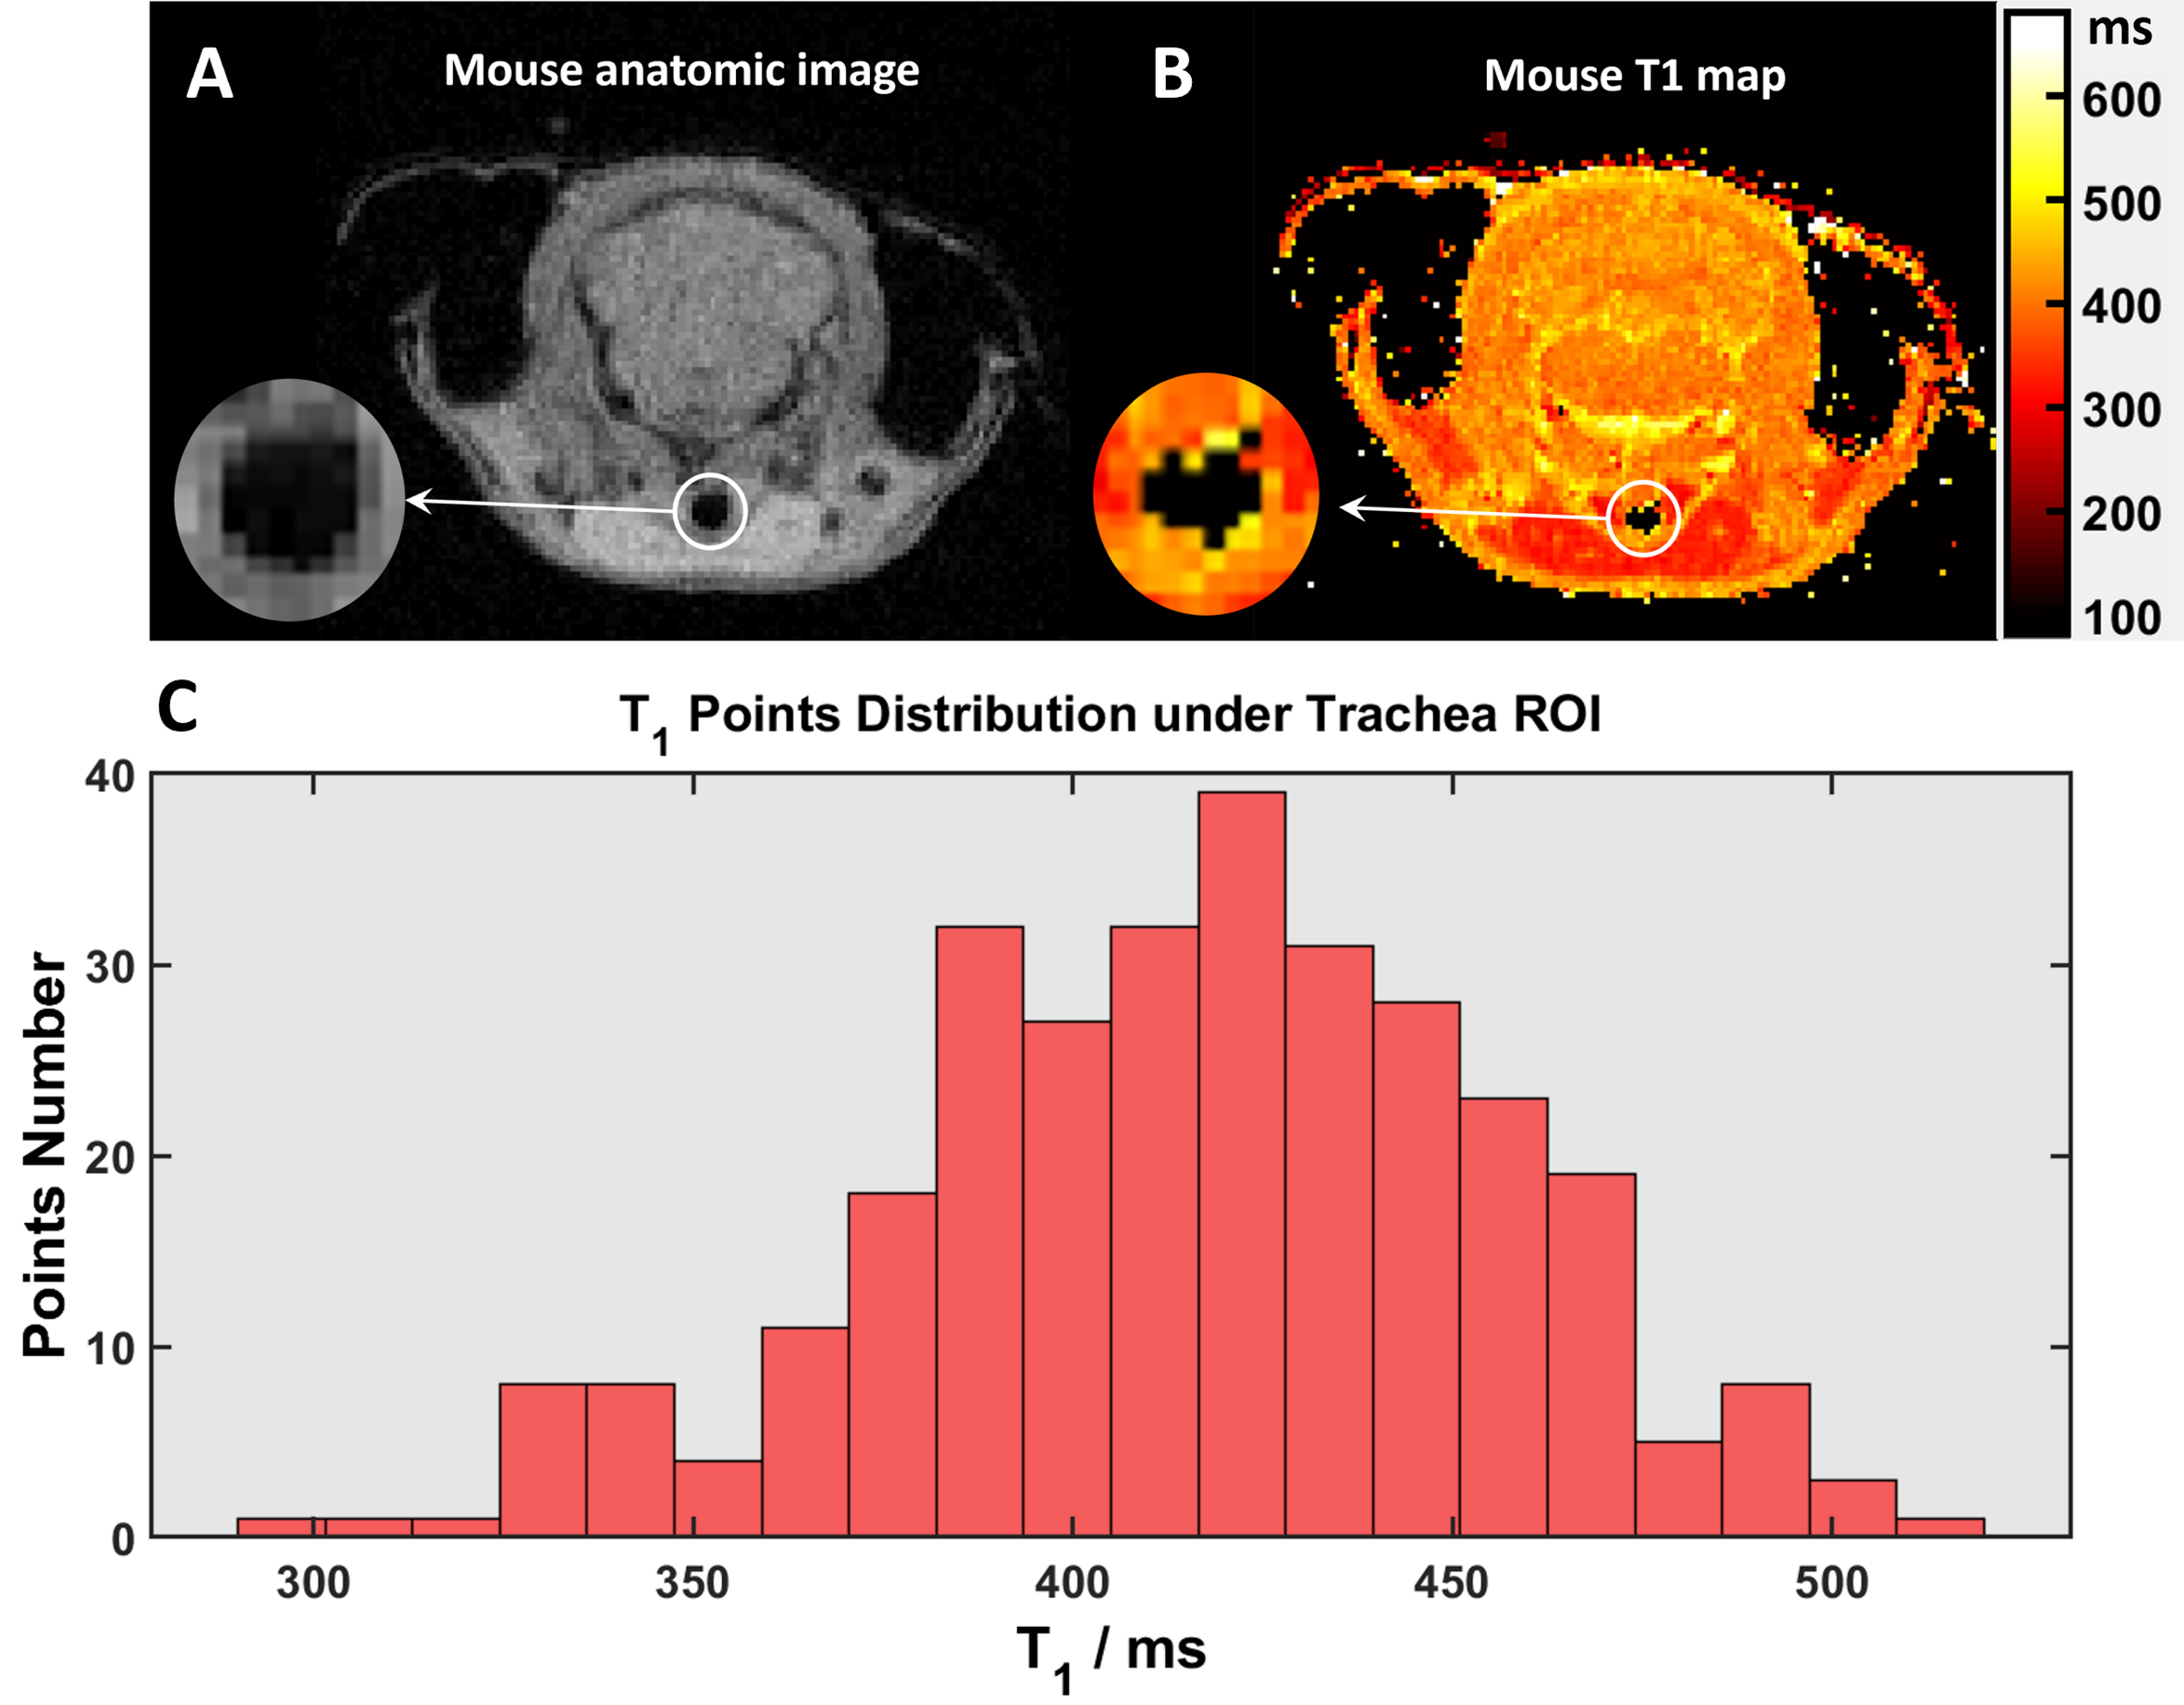
Animal Handling: Procedures were approved by CCHMC IACUC. Fifteen free-breathing, isoflurane-anesthetized C57BL/6 mice (Jackson Laboratory, Bar Harbor, ME) were imaged using a 7 T Bruker BioSpin (Billerica, MA). Three mice (1 female, 2 male) underwent T1 measurements (~90 breaths/minute). Twelve mice (6 female, 6 male) were anesthetized to maintain low (60 breaths/minute; ~2.3% isoflurane) then high (120 breaths/minute; ~1.7% isoflurane) breathing rates. Mice were positioned head-in prone with front teeth on a home-made bite bar. Body temperature was maintained at 36oC using warm air. Respiration and body temperature were monitored during scans (SAI Inc., Stony Brook NY). After imaging, mice were recovered in an isolated, heated cage.MRI: Tracheal T1 was measured via a Look Locker sequence; sequence parameter included: TI Images=16, matrix=200x200, FOV=32x32mm, TR=2175ms, TE=1.4ms, flip angle=30o, averages=4, slice thickness=0.5mm. UTE parameters included: FOV=48x48x48mm, matrix=3203, TE=0.085ms, TR=5ms, bandwidth=277kHz, points/FID=256, projections=321,700, and golden means k-space sampling [17-19]. Mouse trachea T1 (Figure 1, pooled measurements) was 420 ± 40ms, allowing UTE images to be acquired with Ernst angle=9°. UTE acquisition was ~26 min.
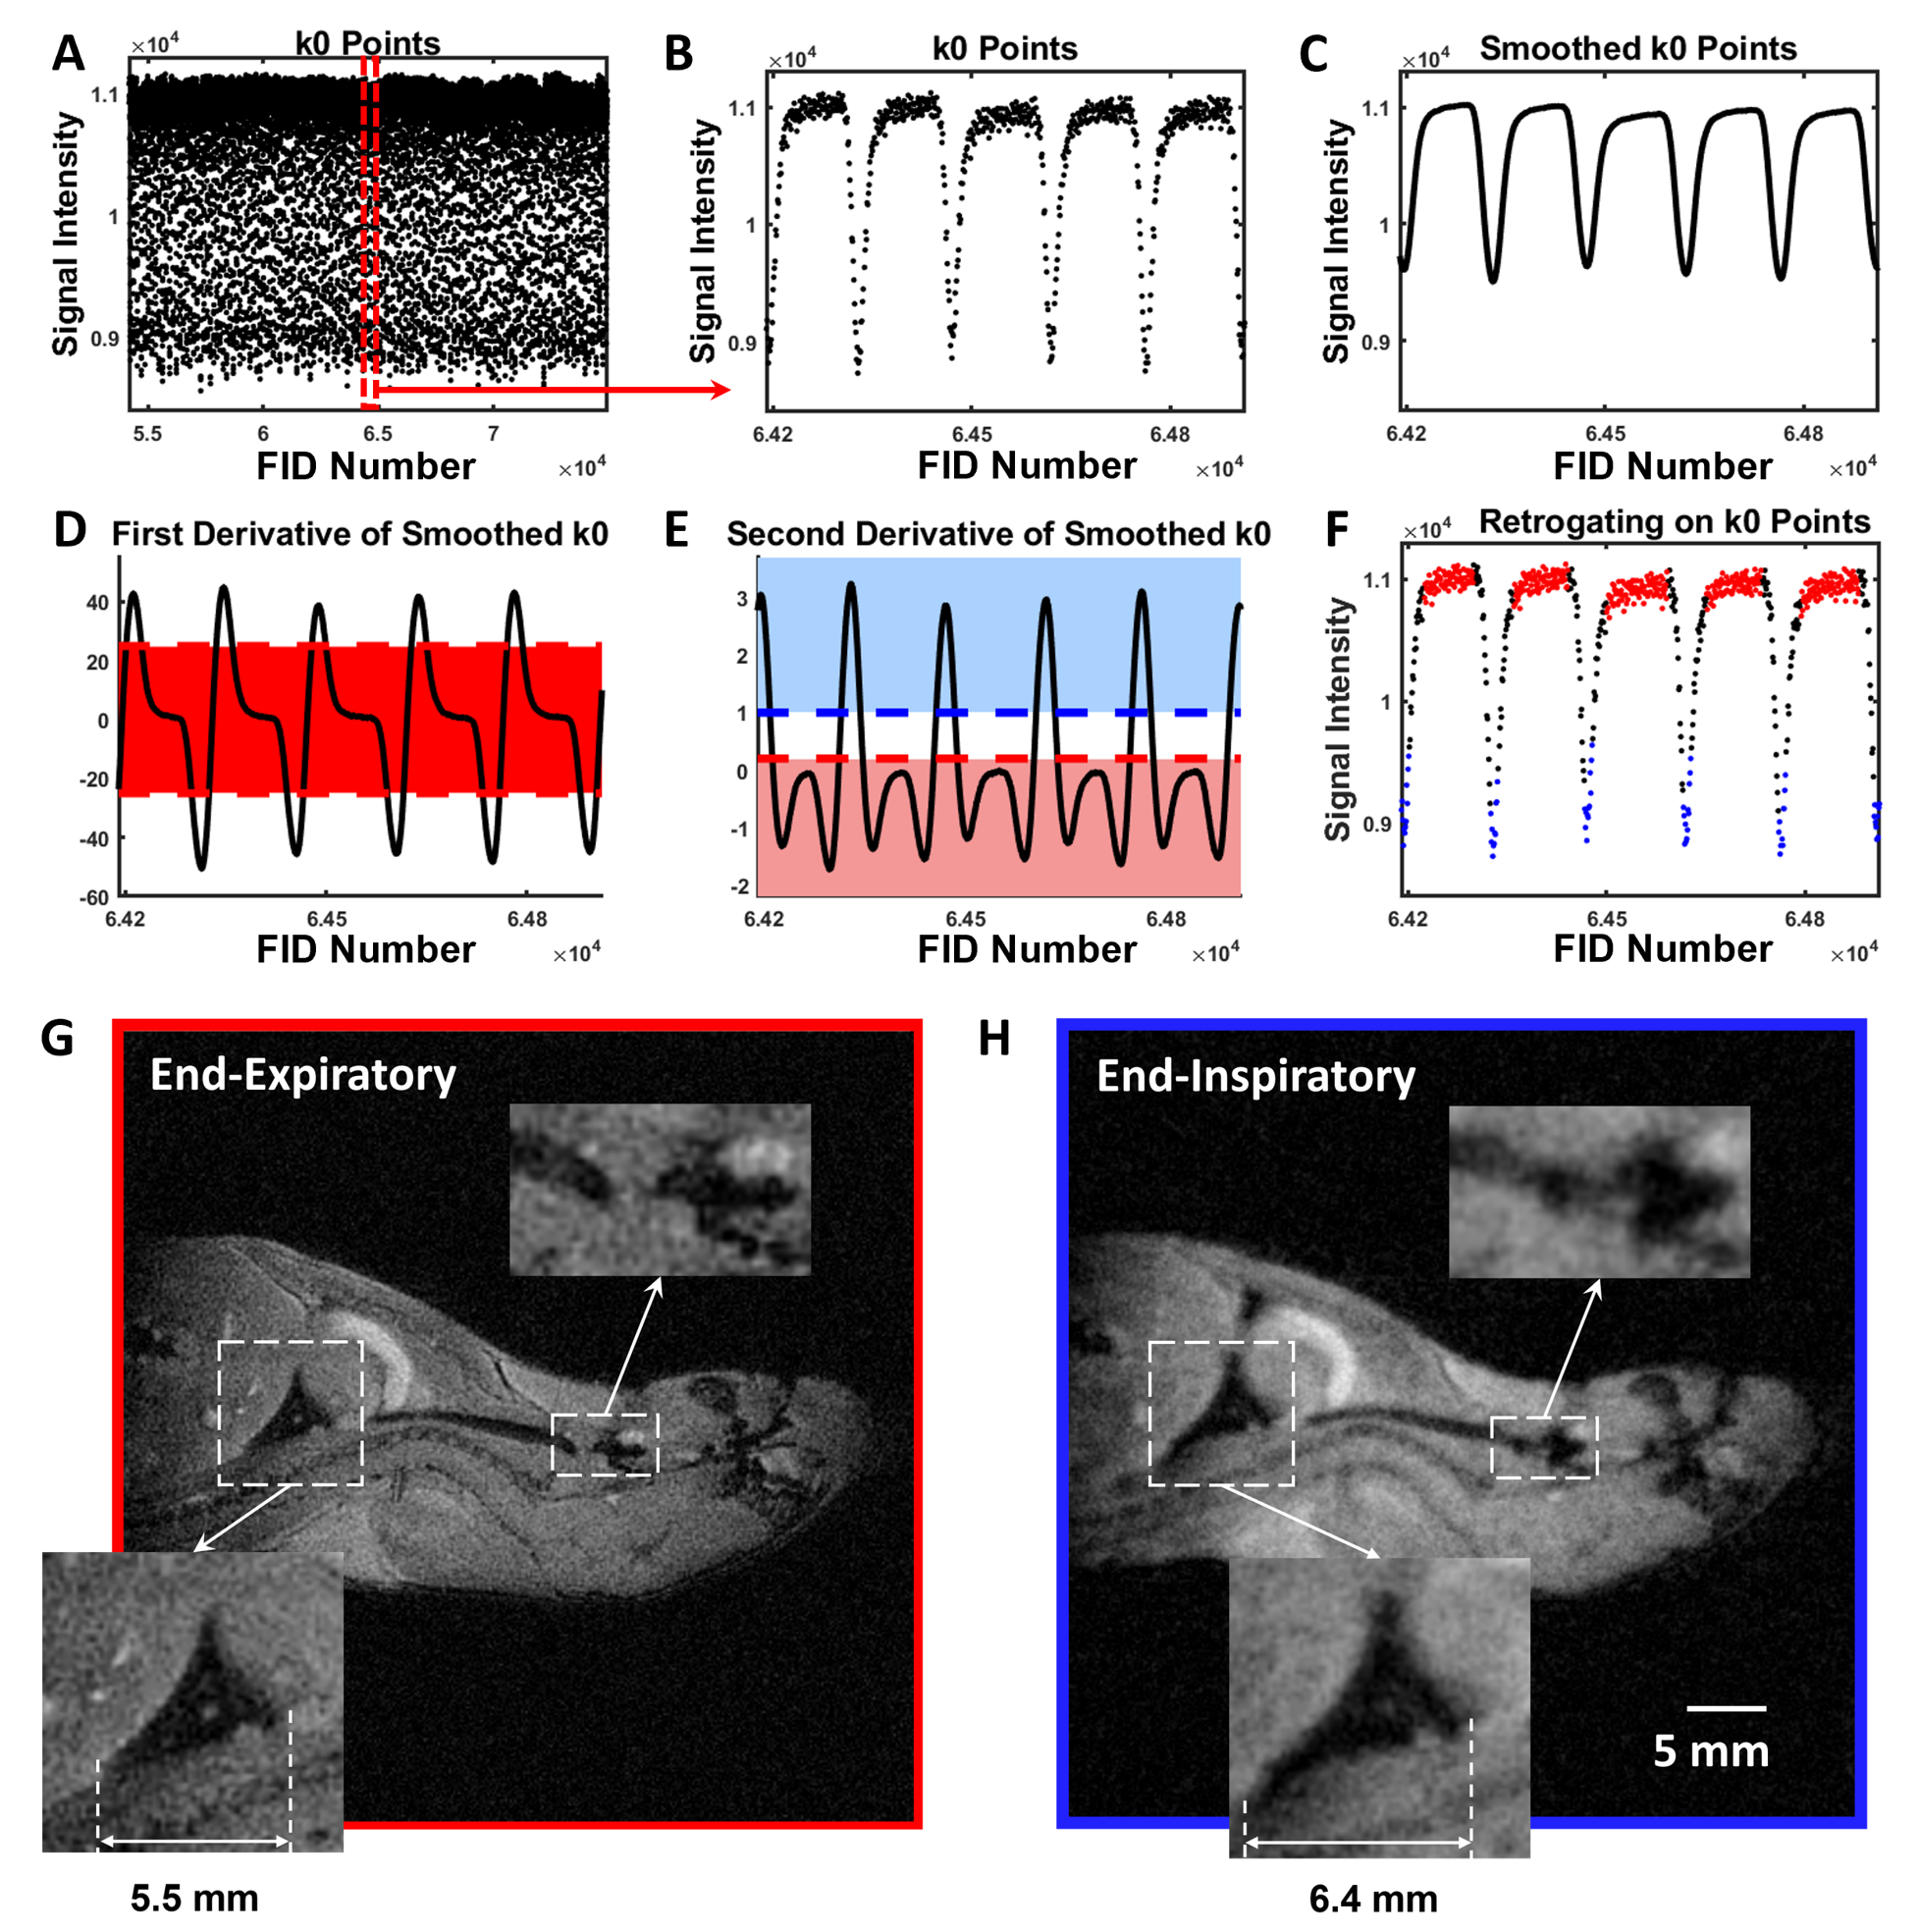
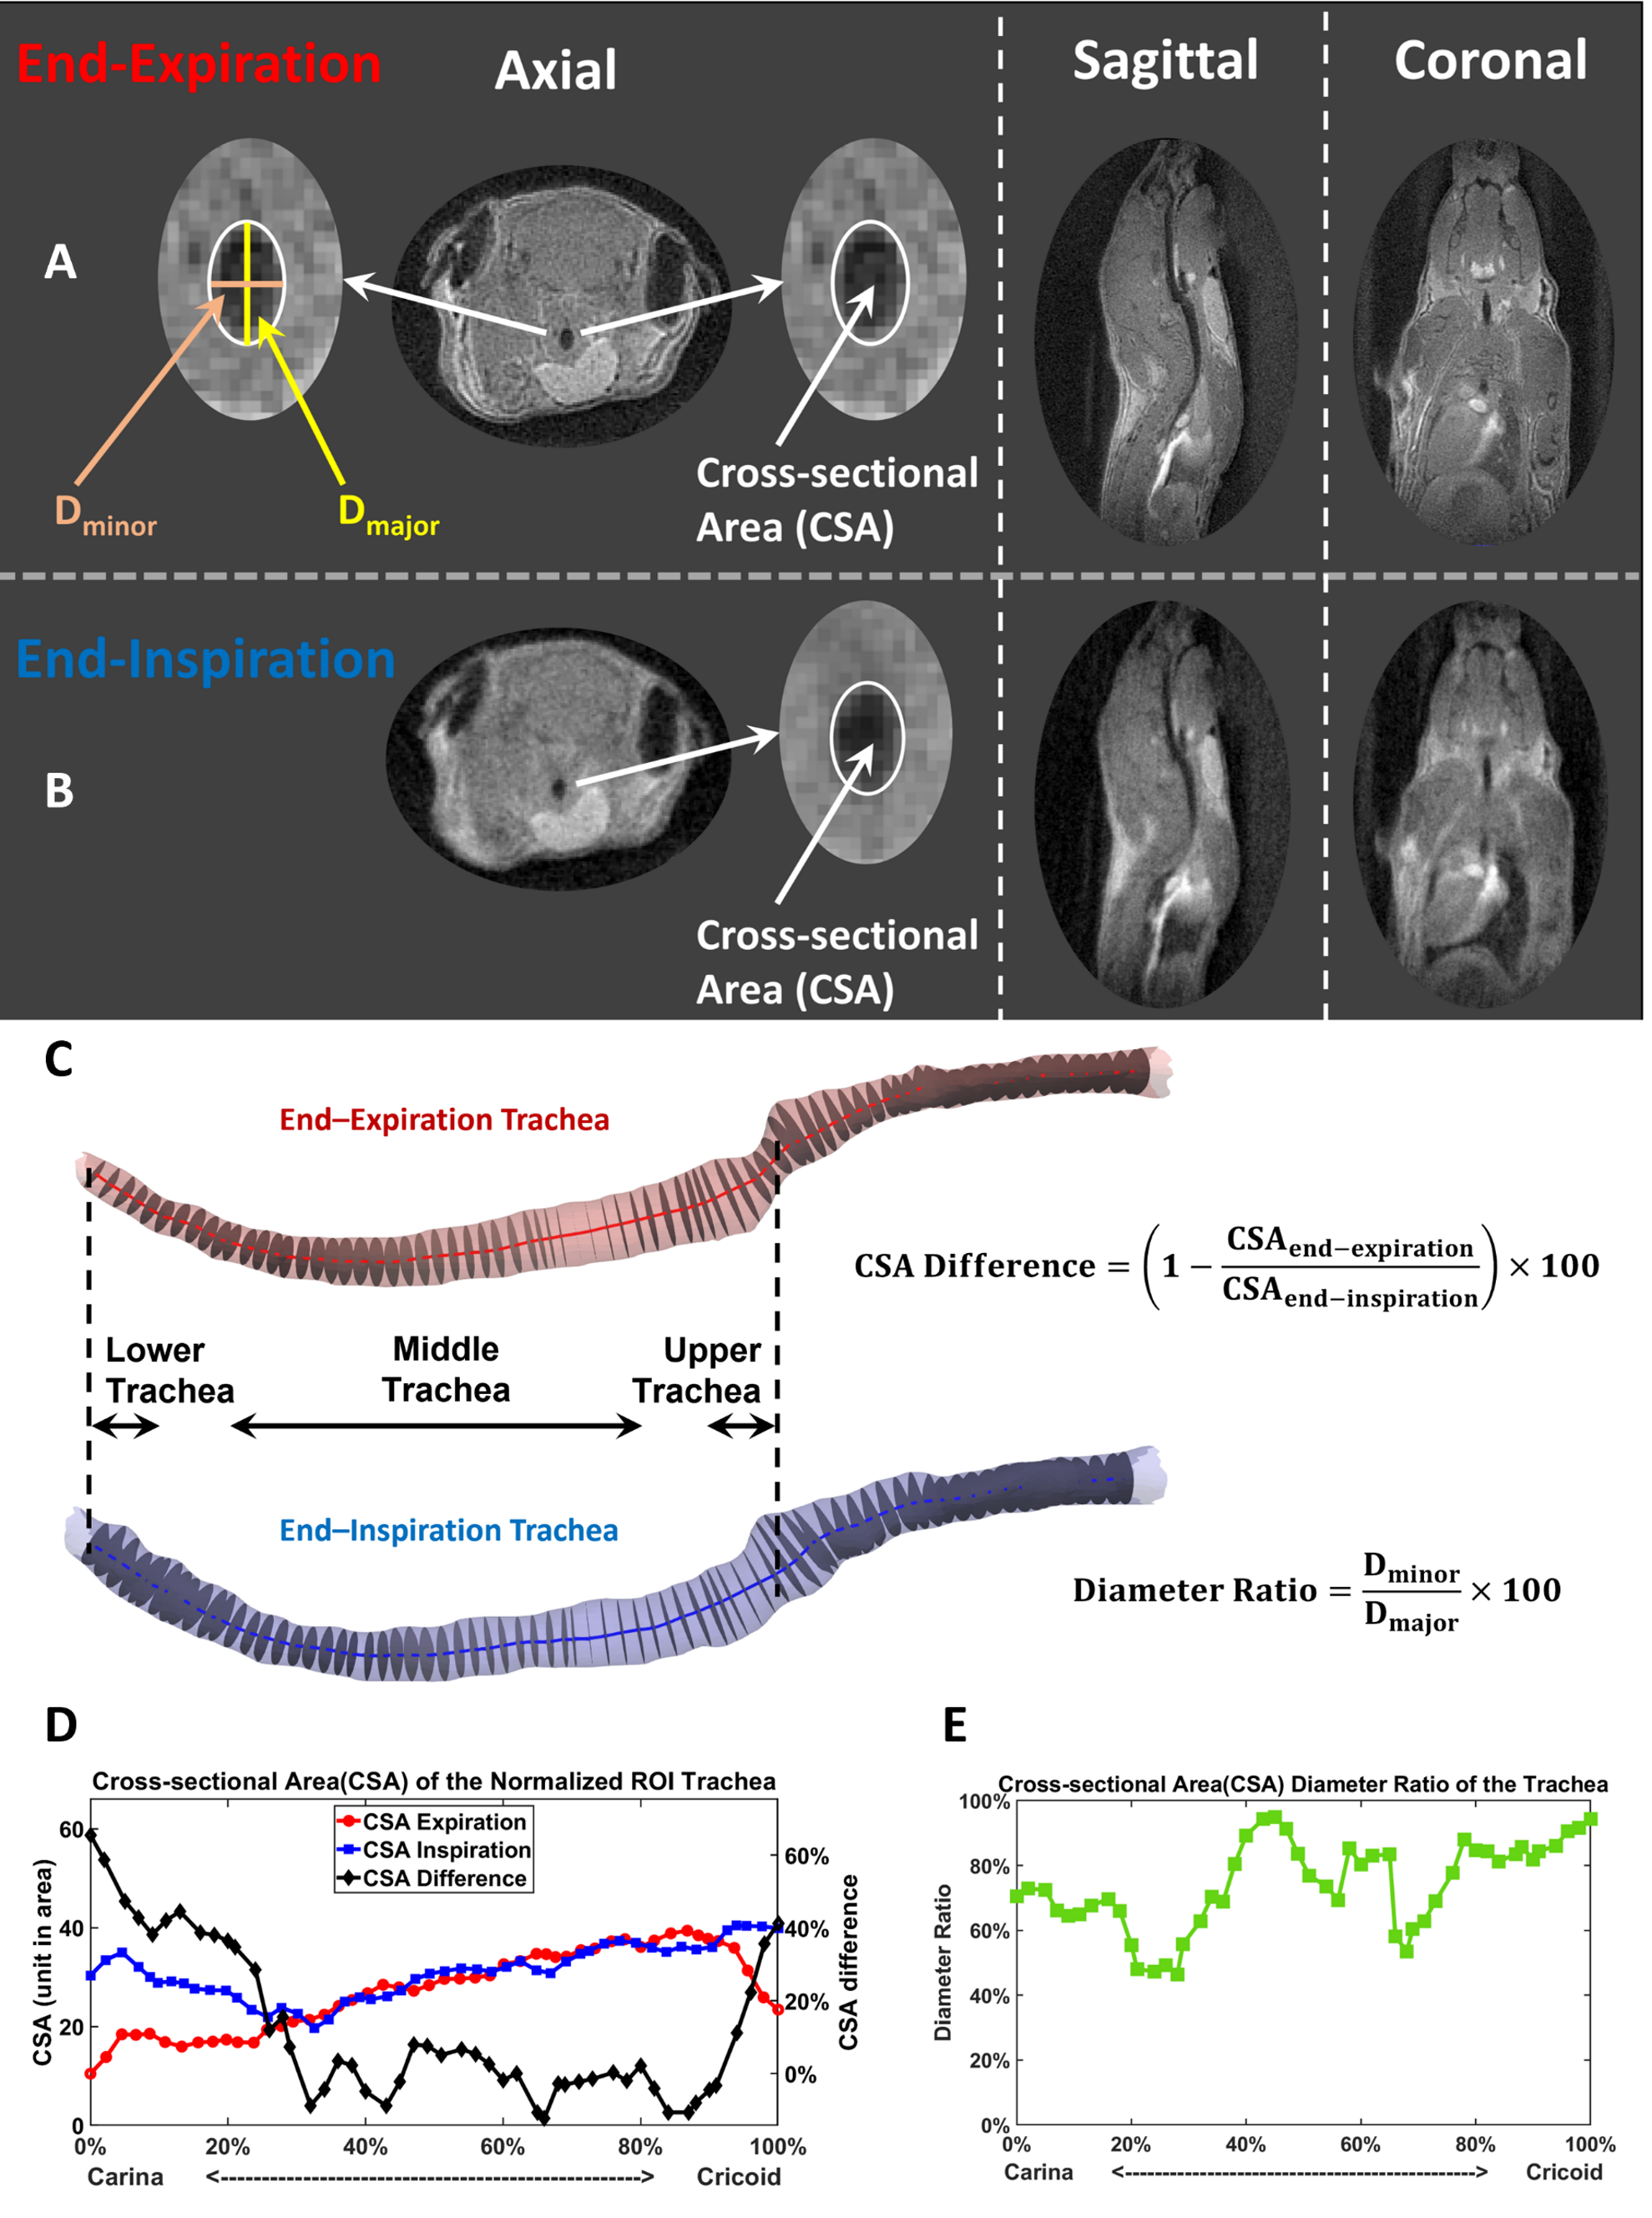
Image Reconstruction and Analysis: Images were reconstructed in MATLAB R2020b (MathWorks, Natick, MA)[20-23]. Retrospective gating based on k0 magnitude sorted FID data into inspiratory and expiratory bins before reconstruction (Figure 2). Briefly, k0 magnitude was smoothed as a function of FID number using a moving average filter, and numerical first and second derivatives were calculated from smoothed data [14, 16, 24] to select two respiratory phases and images (end-expiration and end-inspiration) for reconstruction [16, 23]. Mouse tracheas were segmented using ITK-SNAP (3.8.0, Penn Image Computing and Science Laboratory, USA) and tracheal centerline was calculated in VMTK 1.10 (Orobix, Bergamo, Italy). Luminal, cross-sectional planes were drawn orthogonal to centerline and bounded by trachea surface using MATLAB to calculate cross-sectional area (CSA) at end-expiration and end-inspiration and maximum/minimum tracheal diameter ratio at expiration [13, 14].
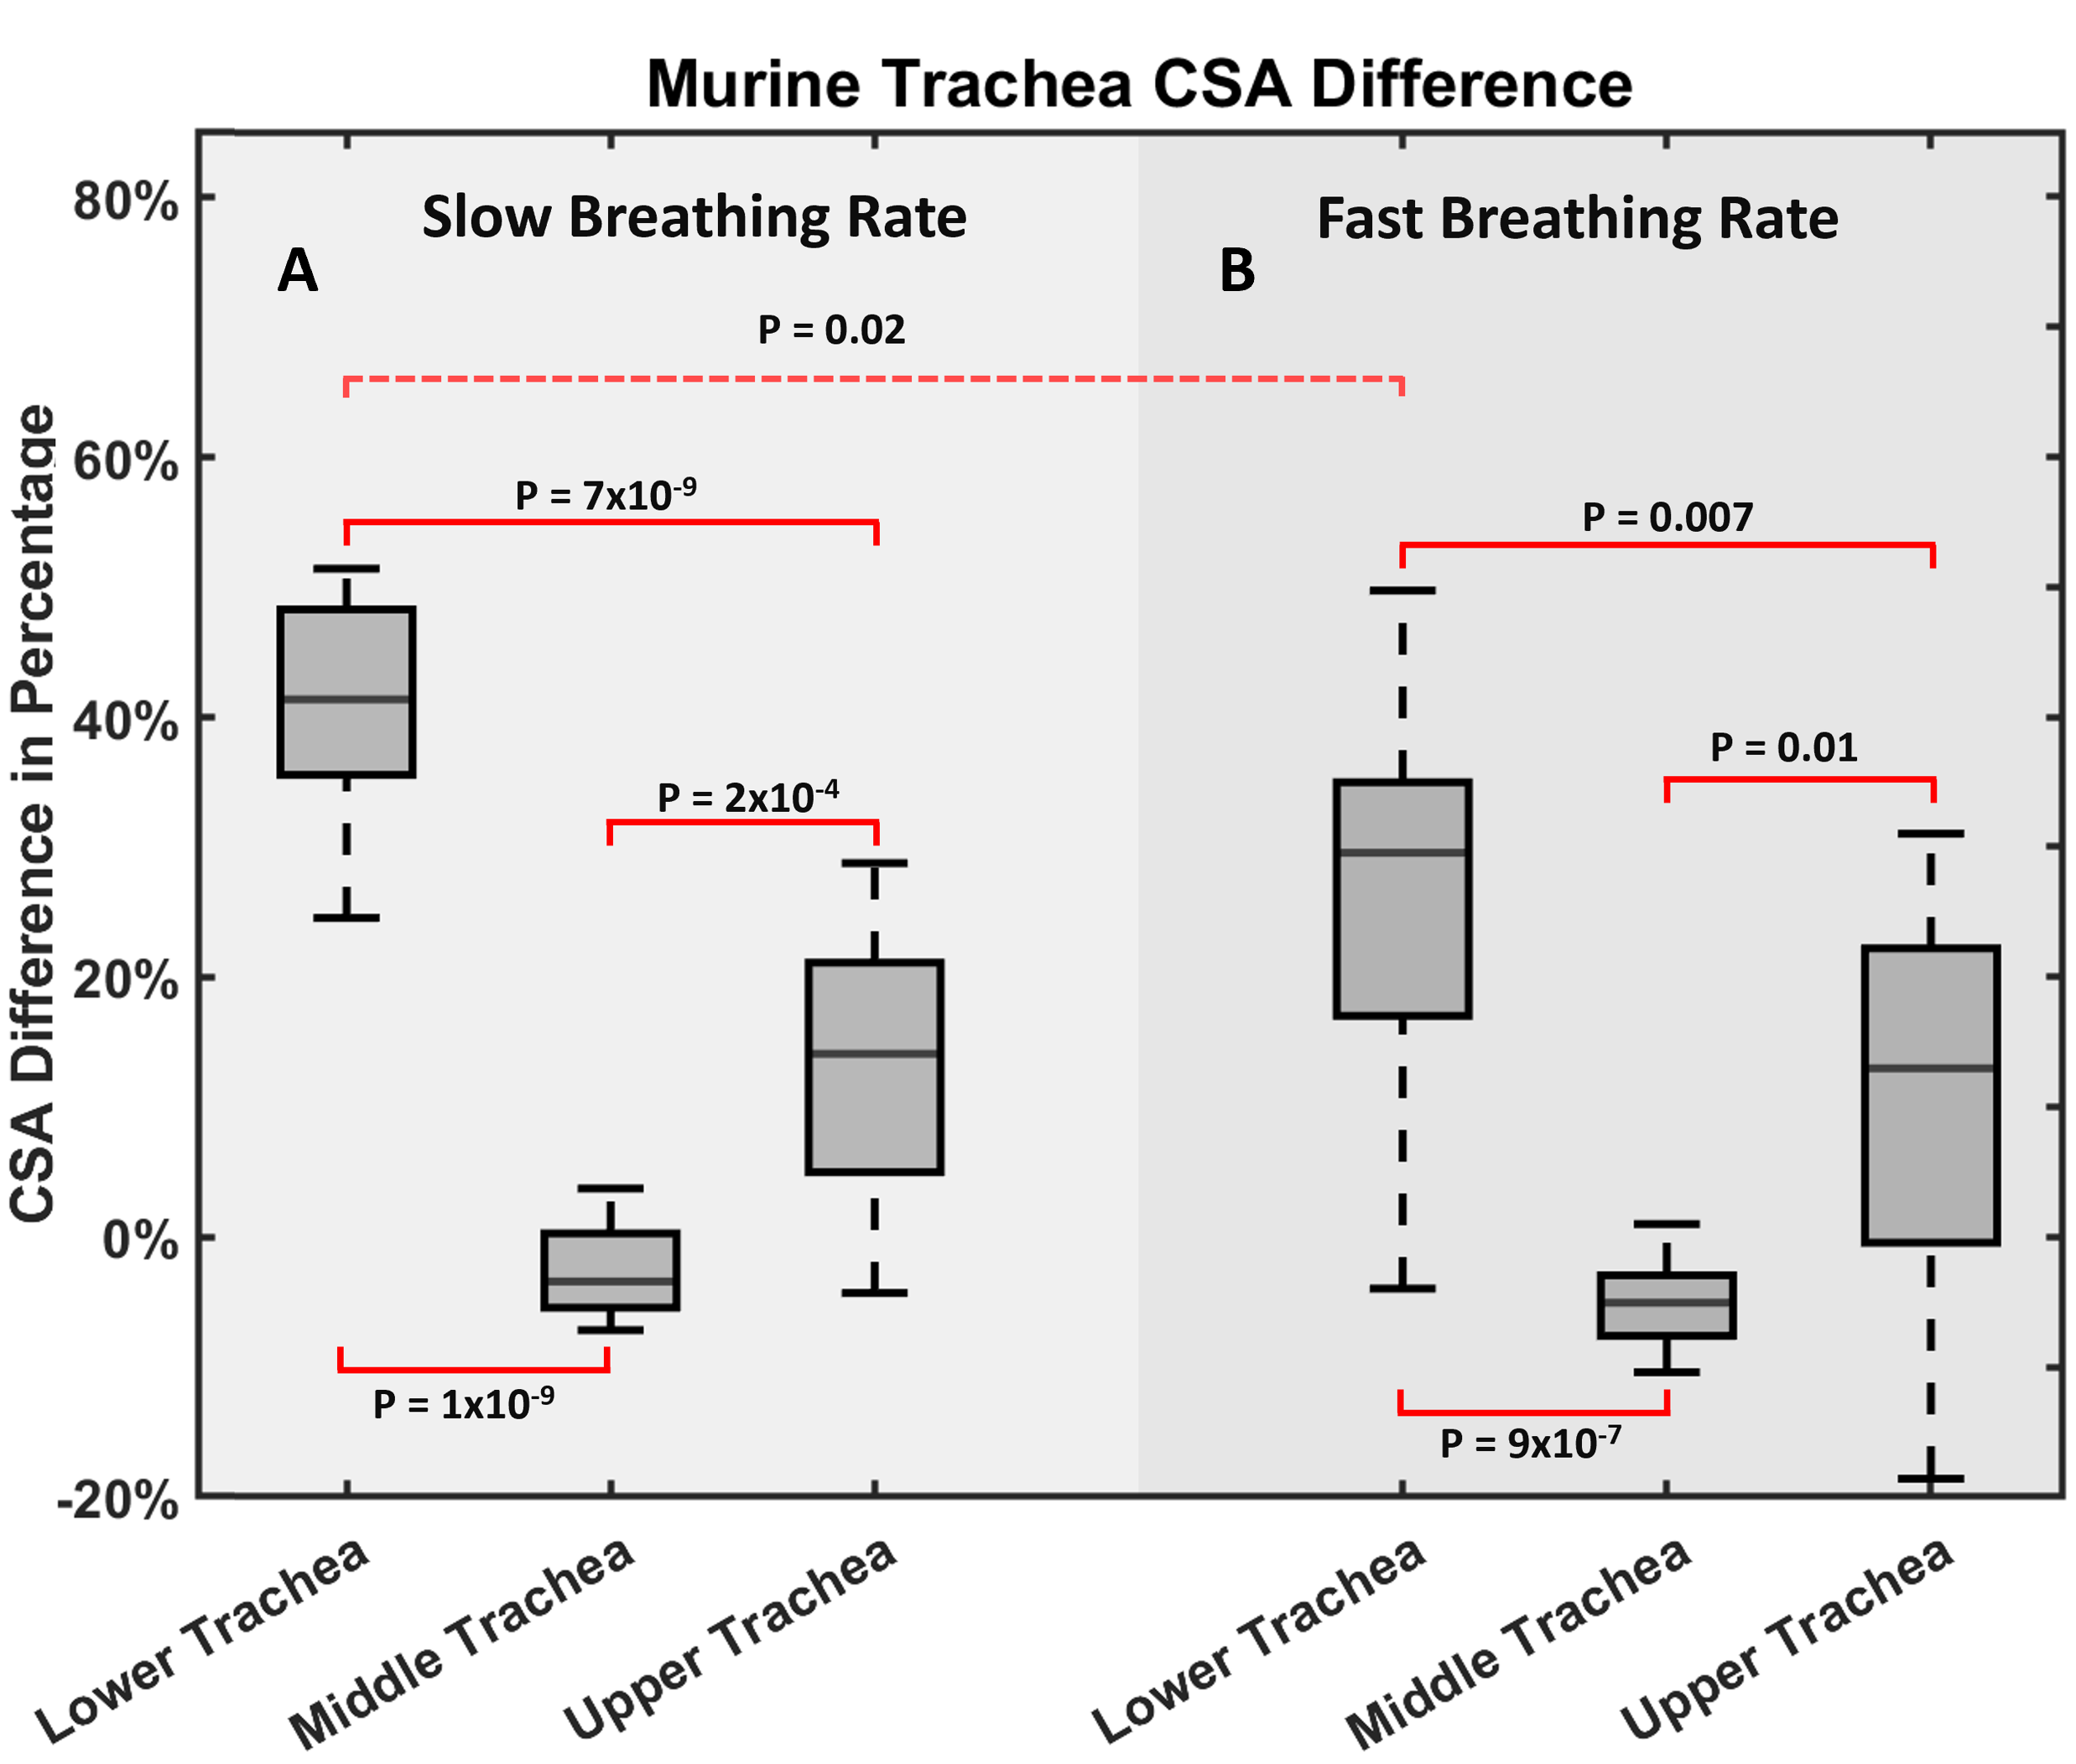
Statistical analysis: One-way ANOVA was performed to assess CSA in upper trachea (top 10%), middle trachea (from 20% to 80%) and lower trachea (bottom 10%) at slow and fast breathing rates. A post hoc Tukey multiple comparisons test was used to assess CSA differences between regions and breathing rates. CSA difference between females and males was asses via t-test. All tests were performed in in MATLAB, and significance was defined as P<0.05.
Results and Discussion
Artifact-free mouse trachea images were reconstructed at end-expiration and end-inspiration using retrospective-gating from free-breathing mice. As seen in Figure 2, the trachea in the axial plane contained >40 voxels at expiration, which is comparable to the anatomic resolution used to assess airway dynamics in human neonates [13, 14, 25]. The middle murine trachea typically displayed almost no CSA change between inspiration and expiration (Figure 3). In contrast, upper and lower trachea exhibited ~50% and ~20% CSA changes, respectively.Across animals at end-expiration, luminal cross-section was nearly cylindrical along the trachea with a mean diameter ratio of 78±7%. Changes in tracheal CSA between inspiration and expiration showed no significant difference between females and males for any tracheal region (P>0.8). However, at slow breathing (Figure 4), significant inspiration-induced changes in CSA were observed across animals between upper, middle and lower trachea (P=2×10-13). The lower trachea exhibited the greatest CSA inspiratory vs expiratory difference of 40±10%, and these changes were significantly greater than those observed in the middle (-3±3%; P=1×10⁻⁹) and upper trachea (13±10%; P=7×10⁻⁹). At fast breathing, the same patterns are observed, but with somewhat more modest significance (Figure 4). Finally, the 40±10% CSA difference at the lower trachea for slow breathing was significantly different than the 30±15% observed for fast breathing (P=0.02).
Conclusion
Despite minute pressure changes during tidal breathing, reproducible murine tracheal dynamics were observed as a function of anatomic position and breathing rate. Importantly, healthy tracheal cartilage is expected to permit less dynamic motion than malformed or injured cartilage. Therefore, these quantitative results represent a practical lower bound on and a reference for tracheal dynamics in free breathing mice. When this protocol is implemented in relevant disease models, the measured tracheal dynamics are expected to provide noninvasive markers of functional airway abnormalities (e.g., tracheomalacia).Acknowledgements
This work was funded by the NIH (R01HL143011) and the Cystic Fibrosis Foundation (NAREN19RO).References
1. Tong, J., et al., Respiratory-related displacement of the trachea in obstructive sleep apnea. Journal of Applied Physiology, 2019. 127(5): p. 1307-1316.
2. McNamara, V.M. and D.C.G. Crabbe, Tracheomalacia. Paediatric Respiratory Reviews, 2004. 5(2): p. 147-154.
3. Fischer, A.J., et al., Tracheomalacia is associated with lower FEV1 and Pseudomonas acquisition in children with CF. Pediatric Pulmonology, 2014. 49(10): p. 960-970.
4. Torre, M., et al., Aortopexy for the treatment of tracheomalacia in children: review of the literature. Italian Journal of Pediatrics, 2012. 38(1): p. 62.
5. Carden, K.A., et al., Tracheomalacia and Tracheobronchomalacia in Children and Adults: An In-depth Review. Chest, 2005. 127(3): p. 984-1005.
6. Hysinger, E.B. and H.B. Panitch, Paediatric Tracheomalacia. Paediatric Respiratory Reviews, 2016. 17: p. 9-15.
7. Wright, C.D., Tracheomalacia. Chest Surgery Clinics of North America, 2003. 13(2): p. 349-357.
8. Boogaard, R., et al., Tracheomalacia and Bronchomalacia in Children: Incidence and Patient Characteristics. Chest, 2005. 128(5): p. 3391-3397.
9. Middleton, P.G., et al., Elexacaftor-Tezacaftor-Ivacaftor for Cystic Fibrosis with a Single Phe508del Allele. N Engl J Med, 2019. 381(19): p. 1809-1819.
10. Noble, P.W., et al., Pirfenidone for idiopathic pulmonary fibrosis: analysis of pooled data from three multinational phase 3 trials. Eur Respir J, 2016. 47(1): p. 243-53.
11. Richeldi, L., et al., Nintedanib in patients with idiopathic pulmonary fibrosis: Combined evidence from the TOMORROW and INPULSIS® trials. Respiratory Medicine, 2016. 113: p. 74-79.
12. Su, S.C., et al., A comparison of virtual bronchoscopy versus flexible bronchoscopy in the diagnosis of tracheobronchomalacia in children. Pediatr Pulmonol, 2017. 52(4): p. 480-486.
13. Bates, A.J., et al., Quantitative Assessment of Regional Dynamic Airway Collapse in Neonates via Retrospectively Respiratory-Gated (1) H Ultrashort Echo Time MRI. J Magn Reson Imaging, 2019. 49(3): p. 659-667.
14. Higano, N.S., et al., Retrospective respiratory self-gating and removal of bulk motion in pulmonary UTE MRI of neonates and adults. Magn Reson Med, 2017. 77(3): p. 1284-1295.
15. Yushkevich, P.A., et al., User-guided 3D active contour segmentation of anatomical structures: significantly improved efficiency and reliability. Neuroimage, 2006. 31(3): p. 1116-28.
16. Stecker, I.R., et al., Preclinical MRI to Quantify Pulmonary Disease Severity and Trajectories in Poorly Characterized Mouse Models: A Pedagogical Example Using Data from Novel Transgenic Models of Lung Fibrosis. J Magn Reson Open, 2021. 6-7.
17. Guo, J., et al., Murine pulmonary imaging at 7T: T2* and T1 with anisotropic UTE. Magn Reson Med, 2018. 79(4): p. 2254-2264.
18. Wu, Z., et al., Anisotropic field-of-view support for golden angle radial imaging. Magn Reson Med, 2016. 76(1): p. 229-36.
19. Chan, R.W., et al., Temporal stability of adaptive 3D radial MRI using multidimensional golden means. Magn Reson Med, 2009. 61(2): p. 354-63.
20. Gewalt, S.L., et al., MR microscopy of the rat lung using projection reconstruction. Magn Reson Med, 1993. 29(1): p. 99-106.
21. Glover, G.H. and J.M. Pauly, Projection reconstruction techniques for reduction of motion effects in MRI. Magn Reson Med, 1992. 28(2): p. 275-89.
22. Glover, G.H., J.M. Pauly, and K.M. Bradshaw, Boron-11 imaging with a three-dimensional reconstruction method. J Magn Reson Imaging, 1992. 2(1): p. 47-52.
23. Pipe, J.G., Reconstructing MR images from undersampled data: data-weighting considerations. Magn Reson Med, 2000. 43(6): p. 867-75.
24. Park, J., et al., A radial sampling strategy for uniform k-space coverage with retrospective respiratory gating in 3D ultrashort-echo-time lung imaging. NMR in Biomedicine, 2016. 29(5): p. 576-587.
25. Higano, N.S., et al., Quantification of neonatal lung parenchymal density via ultrashort echo time MRI with comparison to CT. J Magn Reson Imaging, 2017. 46(4): p. 992-1000.
Figures