0672
High-resolution three-dimensional MR-STAT for musculoskeletal applications1Computational Imaging Group, Department of Radiotherapy, University Medical Center Utrecht, Utrecht, Netherlands, 2Department of Radiology, Imaging Division, University Medical Center Utrecht, Utrecht, Netherlands
Synopsis
Keywords: Quantitative Imaging, Quantitative Imaging
MR-STAT is a framework for simultaneously acquiring multi-parametric quantitative maps from one single short scan. In this work, we design a new 3D MR-STAT sequence and the corresponding two-step reconstruction strategy based on previous work. The framework is improved by designing a faster acquisition framework, and more accurate signal modeling for reconstruction. The proposed sequence takes 7 minutes after retrospectively undersampling, and is validated in a phantom experiment. Furthermore, we apply this 3D MR-STAT sequence the first time for musculoskeletal applications. Knee and lower-leg experiments of healthy volunteers are shown here.Introduction
MR-STAT is a framework for simultaneously acquiring multi-parametric quantitative maps from one single short scan1. MR-STAT computes the quantitative tissue parameters, typically T1, T2 and proton density (PD), by solving the following large-scale, nonlinear optimization problem$$ \alpha^* = \arg \min_\alpha || d - s(\alpha)||_2^2, (1)$$
where $$$s$$$ is the measured k-space data, $$$\alpha$$$ encapsulates all the parameter maps, and $$$s$$$ is the transient-state volumetric signal model. A two-dimensional MR-STAT acquisition uses a gradient-spoiled sequence with a smoothly varying flip-angle train and linear, Cartesian readouts2.
Three-dimensional MR-STAT3, compared to 2D acquisitions, allows for an increased SNR and better through-plane resolution. Challenges of the 3D MR-STAT include a prelonged scan time for high-resolution acquisition and the computational burden for accurate 3D model-based reconstruction. To overcome these challenges, we improve our 3D MR-STAT framework based on the previous abstract3, by applying a new acceleration scheme to reduce scan time and optimizing the signal model for accurate and fast quantitative reconstruction.
Currently MR-STAT has primarily been demonstrated in brain4, however, quantitative MRI is also relevant for evaluating pathological changes in muscle disorders and degenerative joint diseases5,6. Therefore we apply the new 3D MR-STAT sequence for musculoskeletal applications in this work. The proposed new 3D sequence takes 7 minutes with retrospective undersampling, and is validated in a phantom experiment. In-vivo feasibility is demonstrated in the knee (0.8x0.8x1.5mm^3 resolution) and lower-leg (1-mm isotropic resolution) of healthy volunteers.
Method
- Sequence design
The 3D MR-STAT sequence was implemented on a 3T system (Philips, Elition) with prospective ky-undersampling (R=2, dashed and solid bullets in Fig.1(a)). The kz direction undersampling is applied retrospectively (R=4, dashed bullets following the yellow trajectory). The flip-angle train used for the 3D segments is shown in Fig.1(b), which consists of 4 sine-square lobes over 5 undersampled ky phase-encoding lines7. To allow for higher T1 sensitivity and SNR, each 3D segment starts with an adiabatic inversion pulse and a 1.75-second waiting time is inserted between segments for longitudinal signal recovery. Note that the 1.75s waiting time is not sufficient for all spins to return to initial equilibrium states, however after the initial 3 to 4 repetitions of the 3D segments, the temporal MR signal responses remain stable for latter repetitions of different kz lines, reaching to a “hyper steady-state”8.
The 3D MR-STAT sequence is tested on a Eurospin gel-tube phantom, a knee and a lower-leg (healthy volunteers). All two-fold prospectively under-sampled scans take 14 minutes(R=2) and are virtually shortened to 7 minutes by retrospectively under-sampling(R=4). The sequence parameters are summarized in Table1. A 20-second low-resolution, multi-slice B1 DREAM sequence is run for B1+ correction9.
- Reconstruction
Results
Fig.2 shows the results for the gel phantom experiment. T1 and T2 values computed from both 14-minute(R=2) and 7-minute(R=4) MR-STAT data show high agreements with the gold standard results (computed from inversion- recovery and single spin-echo scans). Noises measured from 7-minute reconstruction results are approximately 20% higher than the 14-minute results.Fig.3 and Fig.4 show representative reconstructed slices (sagittal and transverse) from the knee and lower-leg experiment. Several ROIs (cartilage, muscle, fat, etc.) are manually drawn on these 2D slices, and corresponding statistics are summarized in Fig.3(c) and Fig.4(c), showing that the reconstructed values are in the range of literature values11-14.
Conclusion and Discussion
We demonstrated that our 3D MR-STAT sequence can be used for acquiring volumetric quantitative maps with high quality. The 7-minute retrospectively undersampled sequence is demonstrated for knee and lower-leg quantitative imaging. In the future we will prospectively validate the accelerated 3D sequence, and higher acceleration rate and more efficient undersampling strategy will also be investigated. Multi-echo acquisition and multi-compartment reconstruction for water-fat separation will be subject of future work.Acknowledgements
No acknowledgement found.References
[1] Sbrizzi, Alessandro, et al. "Fast quantitative MRI as a nonlinear tomography problem." Magnetic resonance imaging 46 (2018): 56-63.
[2] van der Heide, Oscar, et al. "High‐resolution in vivo MR‐STAT using a matrix‐free and parallelized reconstruction algorithm." NMR in Biomedicine 33.4 (2020): e4251.
[3] Liu, Hongyan, et al. “3D MR-STAT: towards a fast multi-parametric protocol with increased SNR”. ISMRM (2022), # 1346.
[4] Kleinloog, Jordi PD, et al. "Synthetic MRI with Magnetic Resonance Spin TomogrAphy in Time‐Domain (MR‐STAT): Results from a Prospective Cross‐Sectional Clinical Trial." Journal of Magnetic Resonance Imaging (2022).
[5] Yao, Weiwu, et al. "The application of T1 and T2 relaxation time and magnetization transfer ratios to the early diagnosis of patellar cartilage osteoarthritis." Skeletal radiology 38.11 (2009): 1055-1062.
[6] Carlier, Pierre G., et al. "Skeletal muscle quantitative nuclear magnetic resonance imaging and spectroscopy as an outcome measure for clinical trials." Journal of neuromuscular diseases 3.1 (2016): 1-28.
[7] Fuderer,Miha, et al. “Efficient performance analysis and optimization of transient-state sequences for multi-parametric MRI”. NMR in Biomedicine (2022, accepted).
[8] Amthor, Thomas, et al. "Magnetic resonance fingerprinting with short relaxation intervals." Magnetic Resonance Imaging 41 (2017): 22-28.
[9] Nehrke, Kay, and Peter Börnert. "DREAM—a novel approach for robust, ultrafast, multislice B1 mapping." Magnetic resonance in medicine 68.5 (2012): 1517-1526.
[10] Liu, Hongyan, et al. "Acceleration Strategies for MR-STAT: Achieving High-Resolution Reconstructions on a Desktop PC within 3 minutes." IEEE Transactions on Medical Imaging (2022).
[11] Marty, Benjamin, and Pierre G. Carlier. "Physiological and pathological skeletal muscle T1 changes quantified using a fast inversion-recovery radial NMR imaging sequence." Scientific Reports 9.1 (2019): 1-9.
[12] Schlaffke, Lara, et al. "Multi‐center evaluation of stability and reproducibility of quantitative MRI measures in healthy calf muscles." NMR in Biomedicine 32.9 (2019): e4119.
[13] Gold, Garry E., et al. "Musculoskeletal MRI at 3.0 T: relaxation times and image contrast." American Journal of Roentgenology 183.2 (2004): 343-351.
[14] Stokes, Ashley M., et al. "Enhanced refocusing of fat signals using optimized multipulse echo sequences." Magnetic resonance in medicine 69.4 (2013): 1044-1055.
Figures
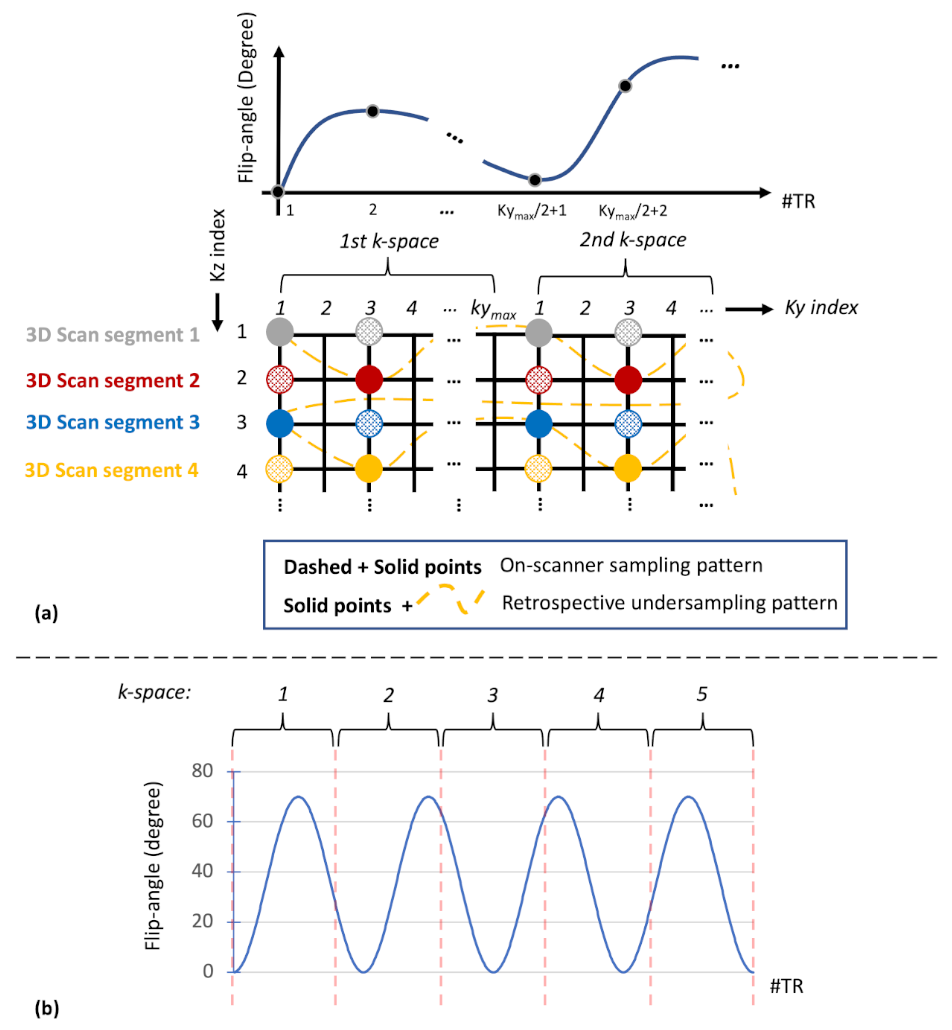
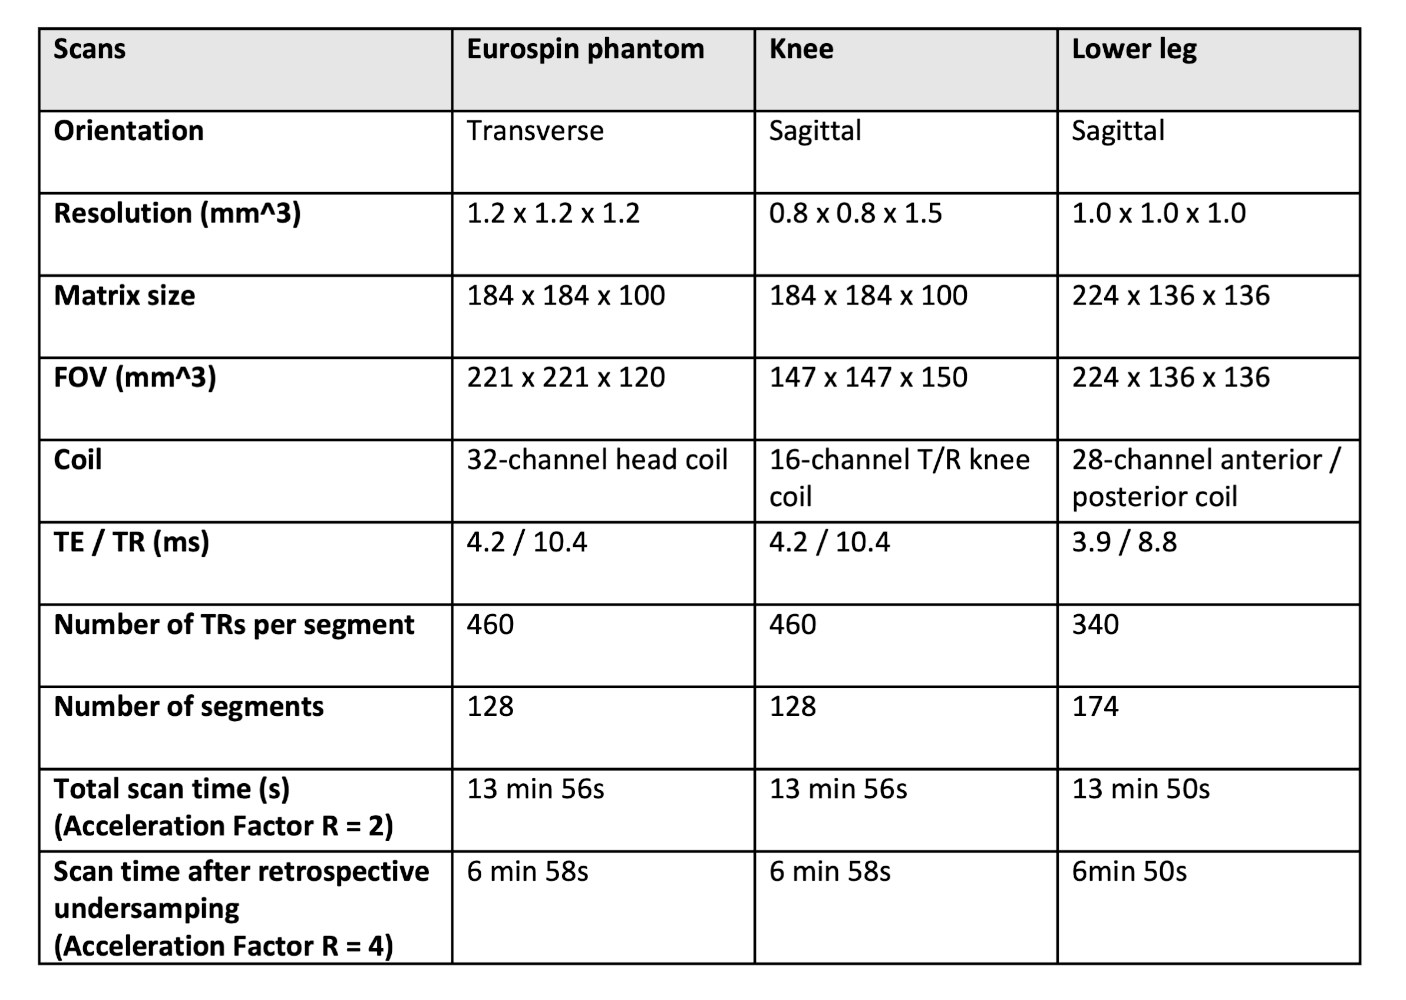
Table 1. 3D
MR-STAT acquisition parameters for the phantom and volunteers
(one-side knee, and lower leg) studies. For all experiments, the sequences are retrospectively undersampled to 7 minute long. Different coils are used. The eurospin experiment uses twice as large as the voxel size of the in-vivo experiments, and also a larger field-of-view (FOV).
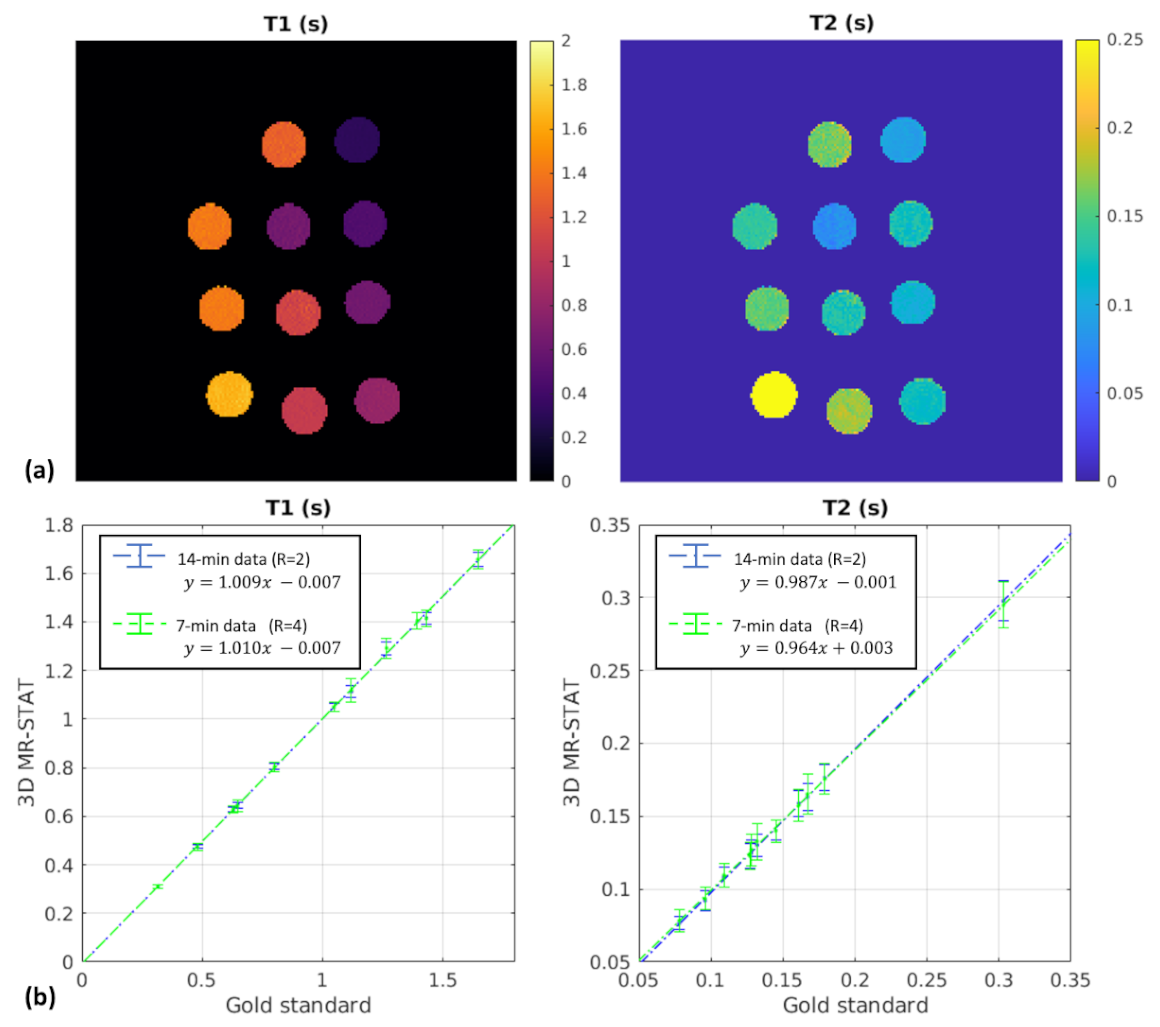
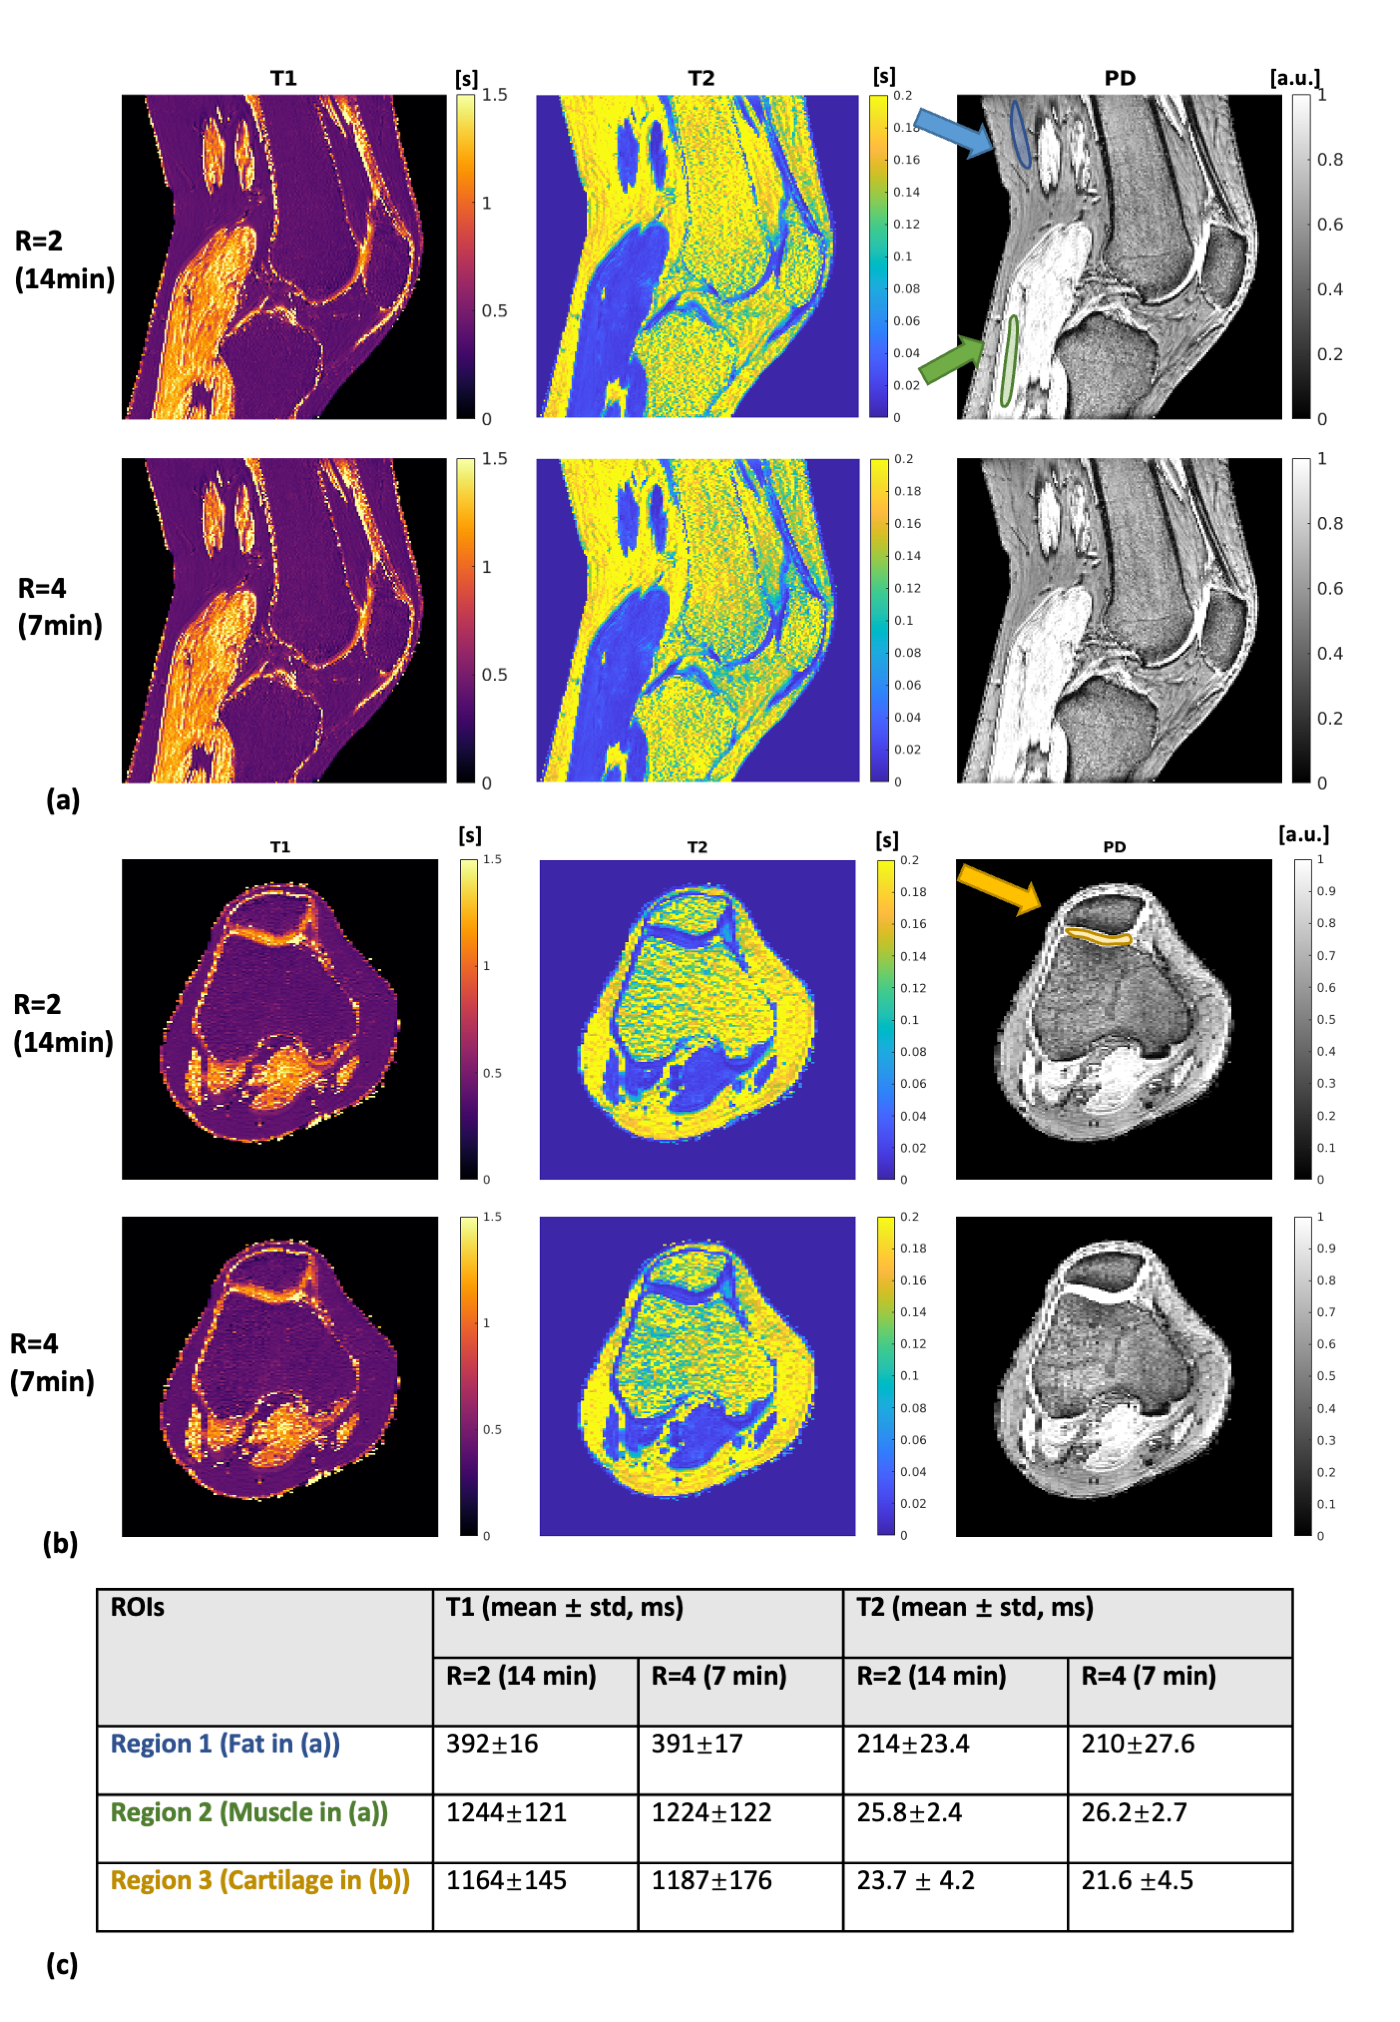
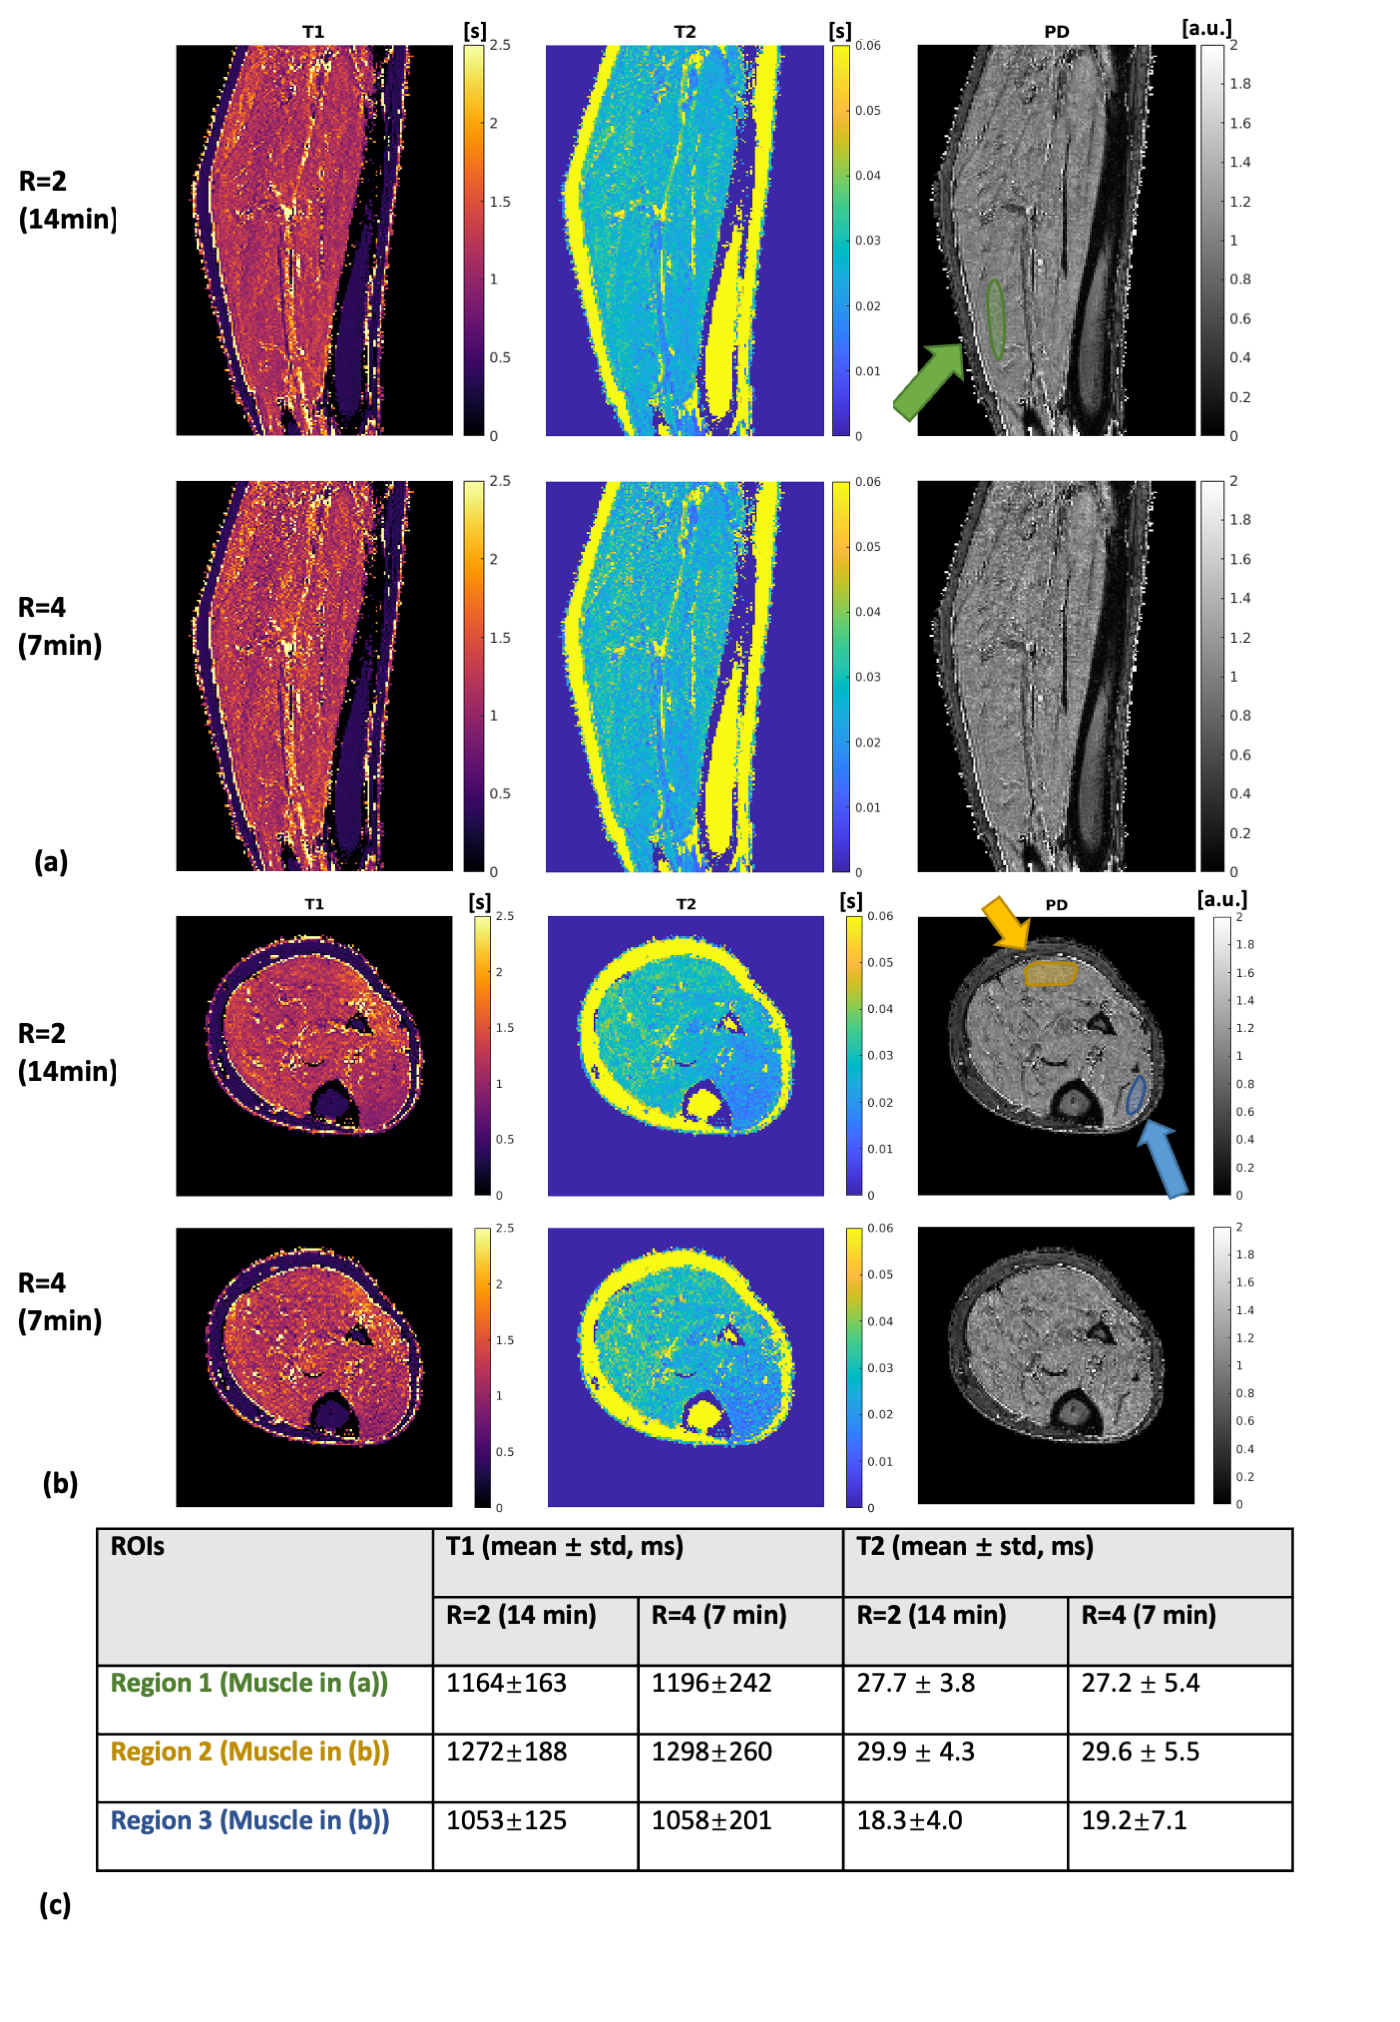
Figure 4. Experimental results for the lower-leg scan. Representative sagittal (a) and transverse (b) quantitative maps are shown for both 14-min and 7-min 3D MR-STAT data. ROI regions are drawn on proton density maps, and statistics are reported in (c). Relatively high T2 values are reconstructed for fat in Figure 3 and 4, which is consistent to the existed findings of bright fat phenomenon14, and only single-compartment signal without chemical shift effect is modeled in the current framework, suggesting the fat T2 reconstructed here may not be accurate.