0670
Free-Breathing, Confounder-Corrected, 3D T1 Mapping of the Liver through Simultaneous Estimation of T1, PDFF, R2* and B1+1Department of Biomedical Engineering, University of Wisconsin-Madison, Madison, WI, United States, 2Department of Radiology, University of Wisconsin-Madison, Madison, WI, United States, 3Global MR Applications and Workflow, GE Healthcare, Waukesha, WI, United States, 4Global MR Applications and Workflow, GE Healthcare, Atlanta, GA, United States, 5Department of Medical Physics, University of Wisconsin-Madison, Madison, WI, United States, 6Department of Medicine, University of Wisconsin-Madison, Madison, WI, United States, 7Department of Emergency Medicine, University of Wisconsin-Madison, Madison, WI, United States
Synopsis
Keywords: Quantitative Imaging, Liver, Multi-Contrast
T1 relaxation is emerging as a biomarker for the diagnosis and staging of chronic liver disease. Modified Look-Locker Inversion Recovery (MOLLI) is widely used in clinical practice for abdominal T1 mapping; however, current methods are not corrected for fat and B1 inhomogeneities as confounding factors and fail to provide reliable T1 measurements. In this work, we propose a novel, free-breathing, confounder-corrected T1 mapping method over the entire liver, by combining inversion recovery and chemical shift encoding imaging for simultaneous estimation of T1, PDFF, R2* and B1+.Introduction
Biopsy is currently the reference standard for the diagnosis of chronic liver disease (CLD). Despite improvements in the safety of this invasive procedure, it still carries risks of complications, is expensive and suffers from sampling variability1,2. As the prevalence of obesity and non-alcoholic fatty liver disease increases, it is essential to establish a non-invasive method to diagnose and quantitatively stage CLD3,4.Fibrosis is the histological change that strongly predicts CLD progression to cirrhosis and the risk of hepatocellular carcinoma5. T1 relaxometry is emerging as a non-invasive biomarker of liver fibrosis6,7.
Modified Look-Locker Inversion Recovery (MOLLI) is widely used in clinical practice for abdominal T1 mapping. However, conventional MRI methods such as MOLLI utilize Cartesian sampling schemes that are prone to motion artifacts and require breath-hold image acquisition8. Furthermore, current MOLLI implementations fail to account for fat as a confounding factor, and due to the limitations on breath-holding time, are only capable of single slice 2D imaging9. T1 mapping using variable flip angle (VFA) spoiled gradient echo (SGRE) can provide volumetric coverage, however, VFA methods are confounded by inhomogeneities in transmit B1 field (B1+) and require separate B1 calibration scans10.
Therefore, the purpose of this work is to present a novel, Inversion Recovery (IR)-based, free-breathing T1 mapping method, with volumetric coverage, and corrected for multiple confounding factors in a single acquisition.
Theory
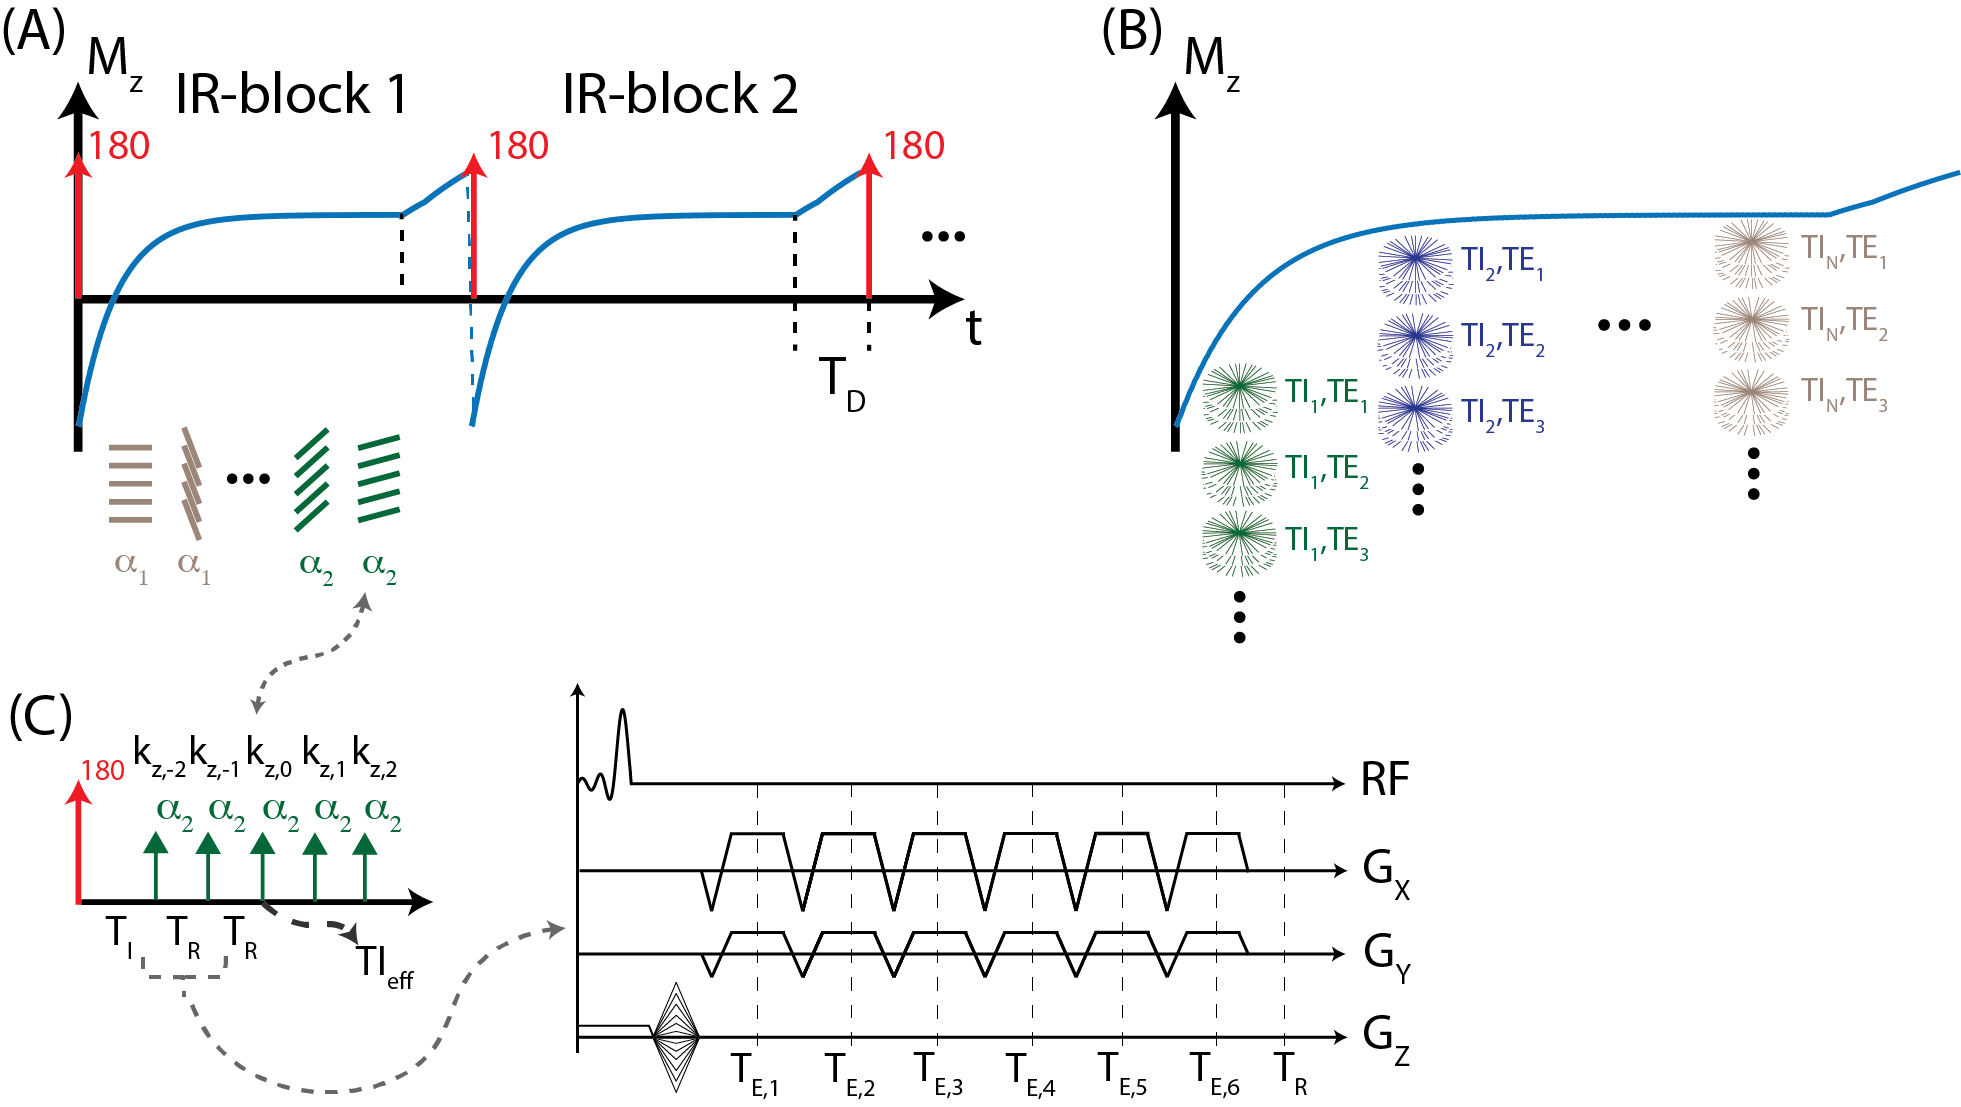
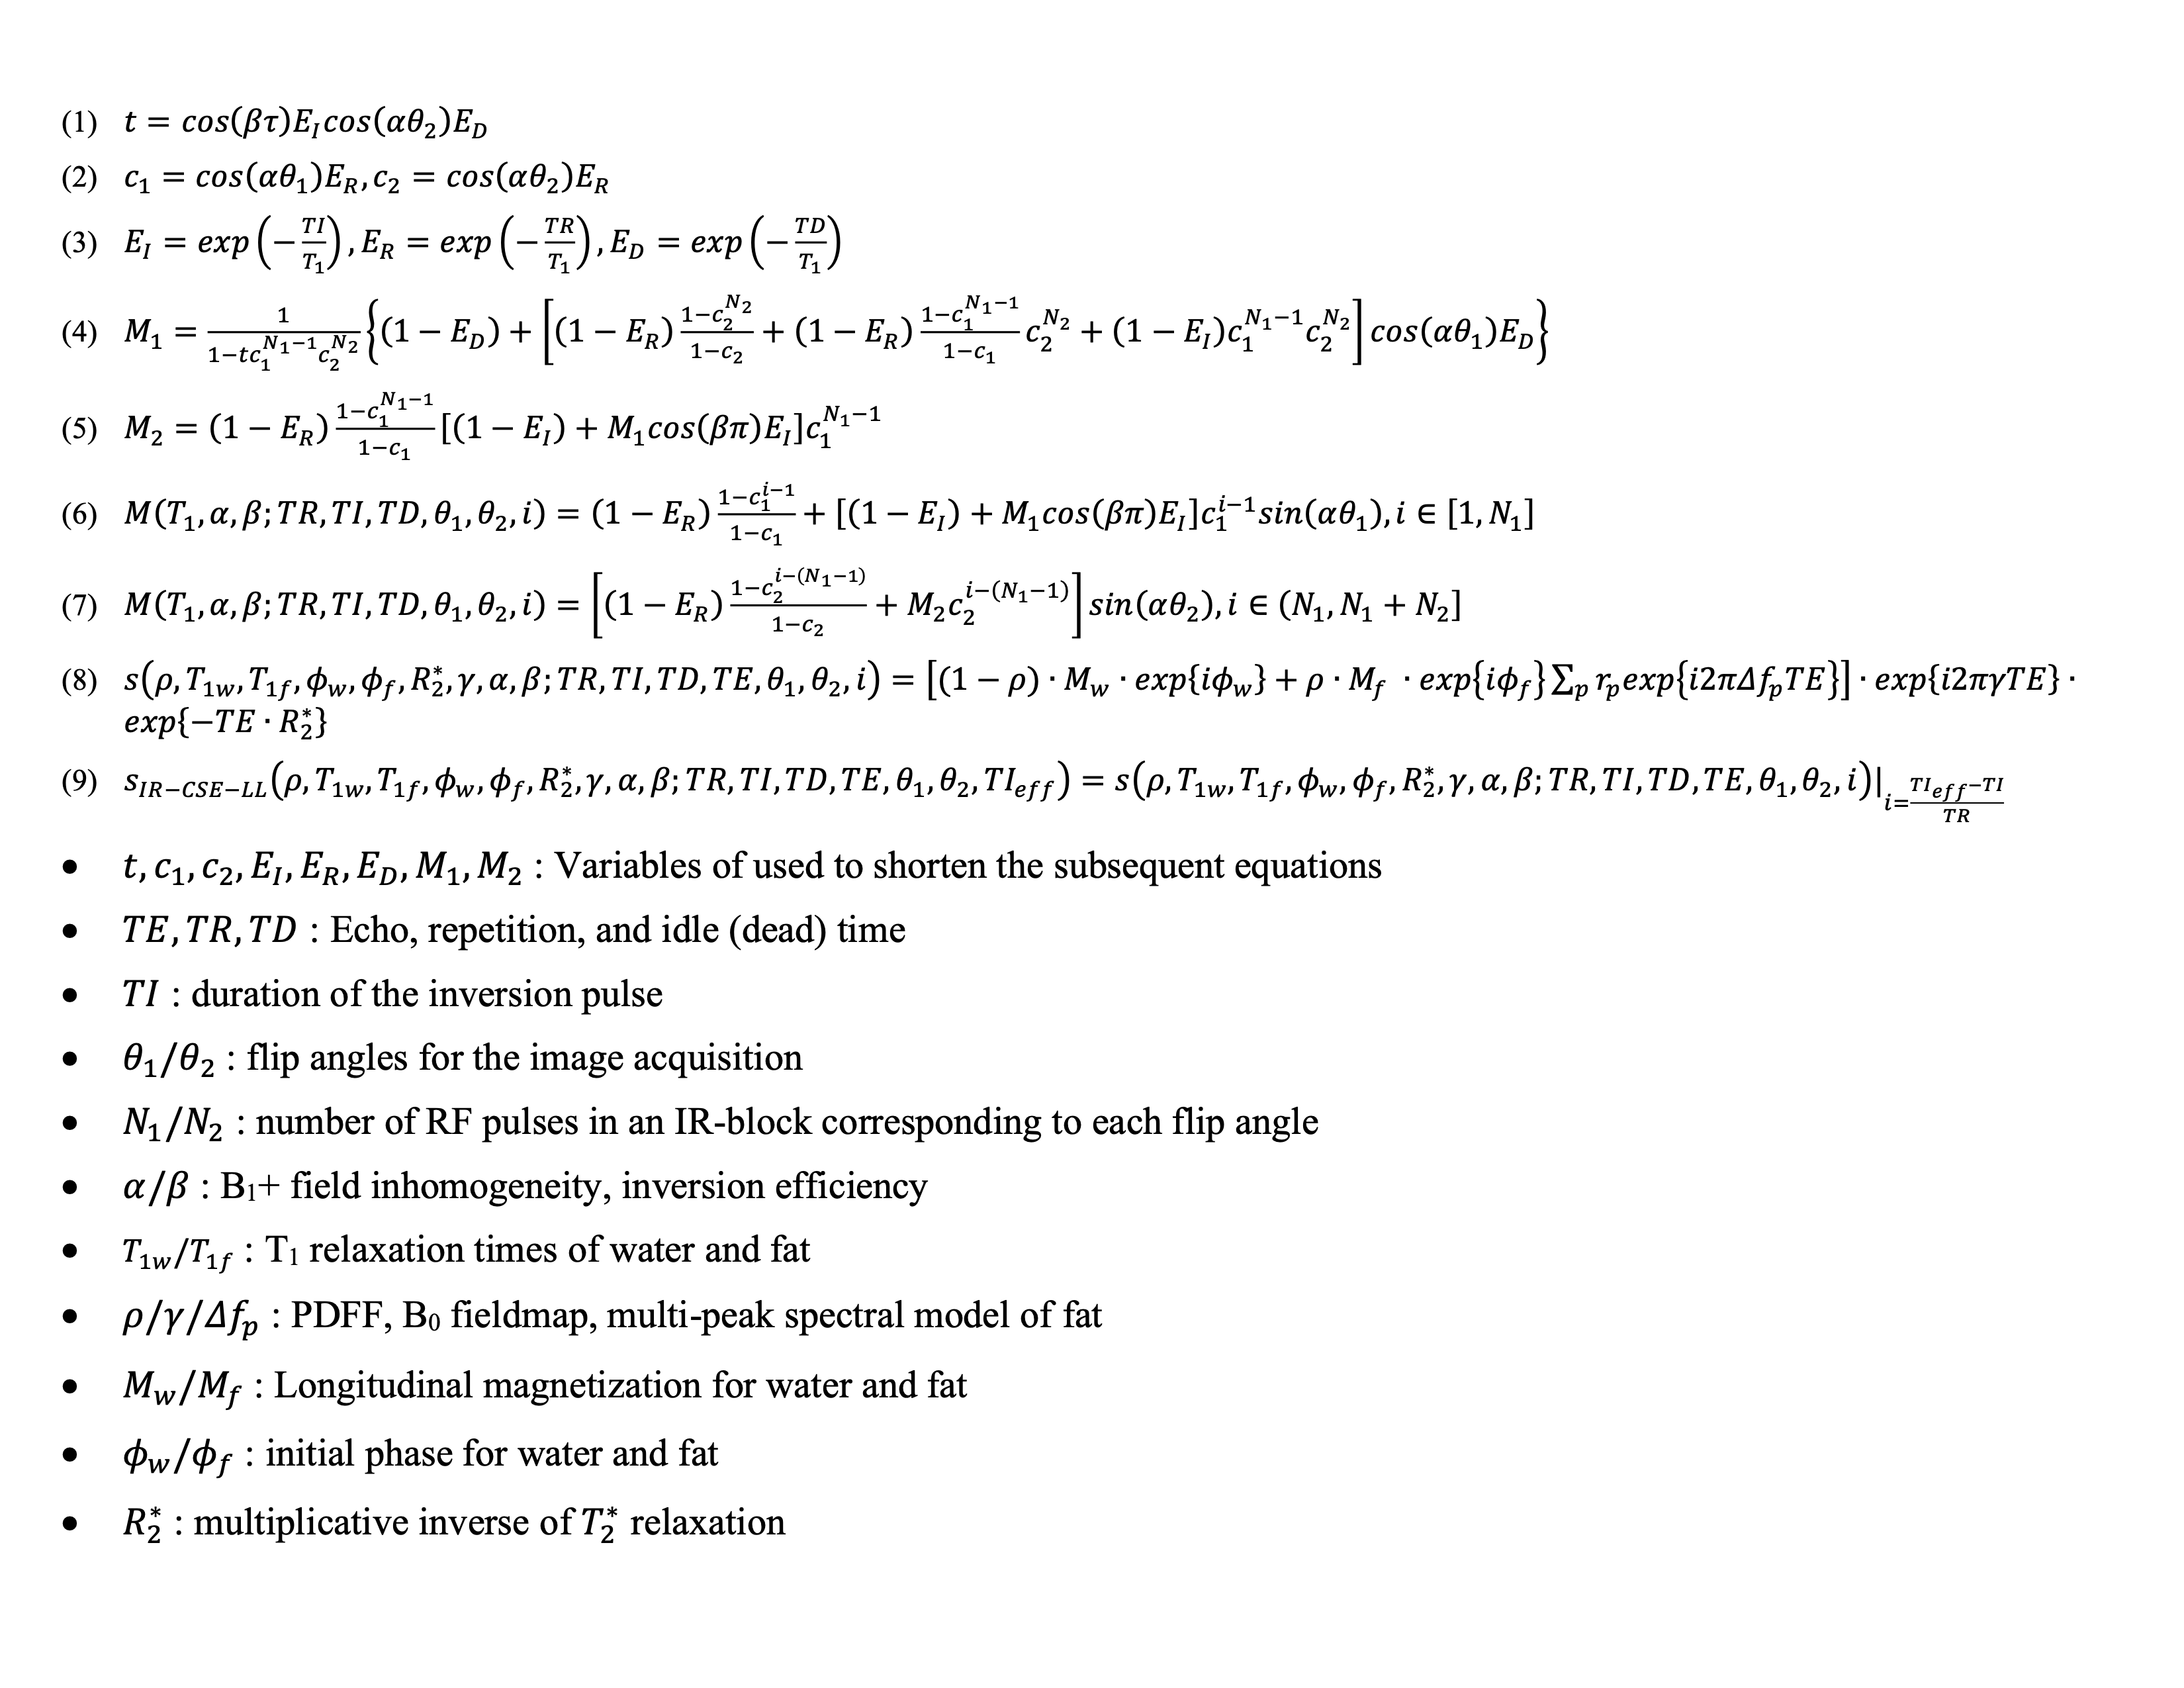
MR Acquisition: An adiabatic, spatially non-selective inversion pulse is first applied, followed by the acquisition of a series of radial kz-stacks with 6-echo-flyback readout. kz-stacks are acquired along the T1 recovery with varying flip angles, following the application of the inversion pulse, to facilitate the correction of inhomogeneities in B1+ field and inversion efficiency11. The magnetization preparation and multi-echo image acquisition schemes are illustrated in Figure 1.Signal Model: The proposed method can estimate multiple signal properties (T1, PDFF, R2* and B1+) jointly due to combination of magnetization preparation, variable flip angle and 6-echo chemical shift encoding (CSE)-MRI schemes. The proposed signal model allows for independent T1 relaxation parameters for fat and water, whereas B1+ field inhomogeneities and R2* terms are modeled as identical for both water and fat components. Equations 1-9, outlined in figure 2, describe the proposed signal model.
Image Reconstruction: Echo-time and inversion-time frames were jointly reconstructed using a locally low rank image reconstruction algorithm according to the following equation12:
$$(10)~~\hat{a}_{1,2,3,...}~=~\underset{a_{1,2,3,...}}{\arg\min}~\left\lVert~\Omega~\begin{bmatrix}~s(TE_{1})\\s(TE_{2})\\s(TE_{3})\\~\cdot~\end{bmatrix}~-~F~\cdot~S~\cdot~U_{k}~\cdot~\begin{bmatrix}~a_{1}\\a_{2}\\a_{3}\\~\cdot~\end{bmatrix}~\right\rVert~+~\lambda~\sum~\left\lVert~R_{r}~\begin{bmatrix}~a_{1}\\a_{2}\\a_{3}\\~\cdot~\end{bmatrix}~\right\rVert_{*}$$
Where, $$$\Omega$$$ denotes the radial-to-Cartesian gridding operator, $$$F$$$ is the Fast Fourier Transform (FFT) operator, $$$S$$$ characterizes the coil sensitivity, $$$U_{k}$$$ is a T1 relaxation-subspace transform, $$$a_{i}$$$ is the subspace representation of the ith echo frame. ESPIRiT method was used to estimate coil sensitivities13. Basis functions were calculated using Bloch equation simulations to cover a wide range of T1 relaxations, B1+ inhomogeneities and inversion efficiencies.
Methods
Phantom Experiments: Stack-of-Stars IR-CSE-MRI images of an agar-gel phantom were acquired on a clinical 3.0T MRI system (Discovery MR 750, GE Healthcare, Waukesha, WI) using an 8-channel phased array head coil. Peanut oil and NiCl2 were used to modulate PDFF (0-20%) and water-specific T1 relaxation (200-1000 msec) in the agar-gel phantom. Imaging parameters included: FOV=200x200x112mm3, resolution=1.5x15x3.5mm3, TR/TE1/$$$\Delta$$$TE=12/1.1/1.8ms, Bandwidth=90.91kHz, partial Fourier fraction=70%. Total acquisition time was 5 minutes. IDEAL-IQ was used as a reference measurement for PDFF and R2* values, 2D Inversion Recovery-Fast Spin Echo (IR-FSE) was used as a reference measurement for T1 values14,15. Imaging parameters for IR-FSE images were TI=50/100/200/400/800/1200/2000/3000/4000msec, TR=6000msec. Bloch-Siegert B1+ map was used to measure transmit power inhomogeneities16.In Vivo Experiments: The proposed method was tested in 4 healthy volunteers on a 3.0T MRI system using a 32-channel phased array torso coil. Imaging parameters included: FOV=400x400x130mm3, resolution=2x2x4mm3, TR/TE1/$$$\Delta$$$TE=12/1.1/1.8ms, Bandwidth=90.91kHz. Total acquisition time was 5 minutes. T1 maps were acquired before and 15 minutes after the IV administration of gadoxetic acid (GA) (0.025mmol/kg). IDEAL-IQ was used as a reference measurement for PDFF and R2* values, a product 2D saturation recovery T1 mapping method (SMART1, GE Healthcare, Waukesha, WI) was used as a reference measurement for pre- and post-contrast T1 values17.
Results
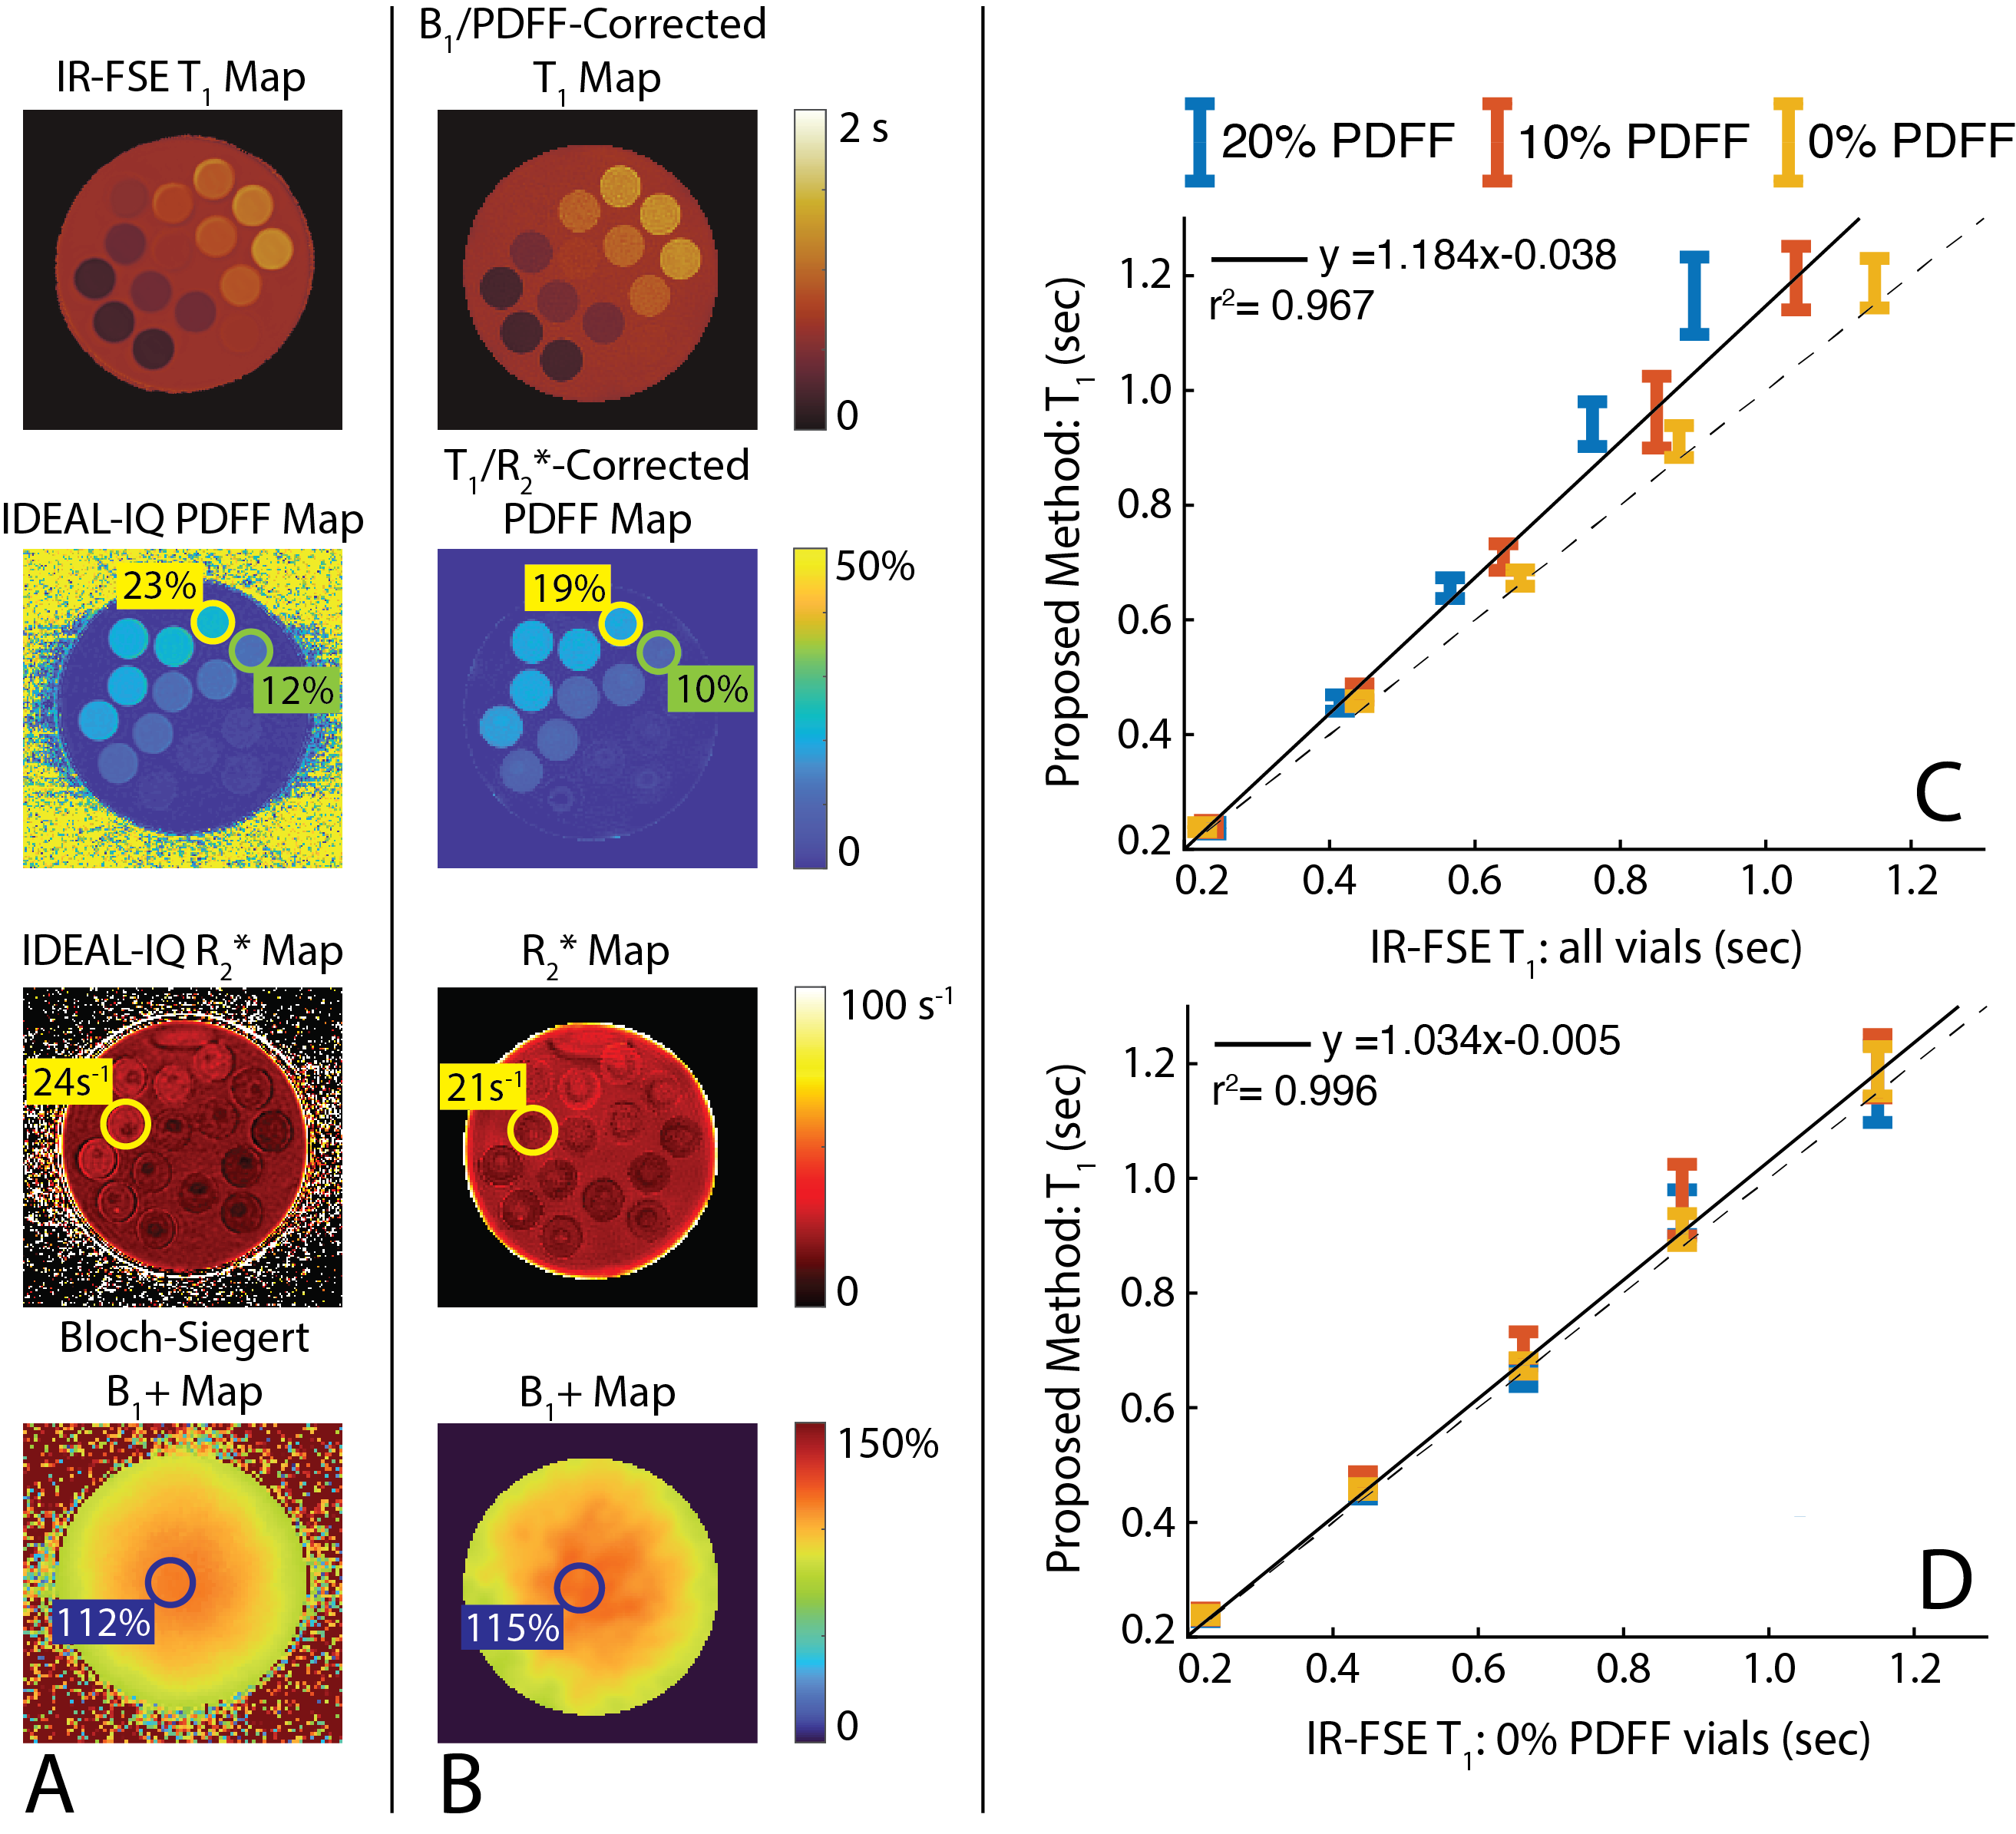
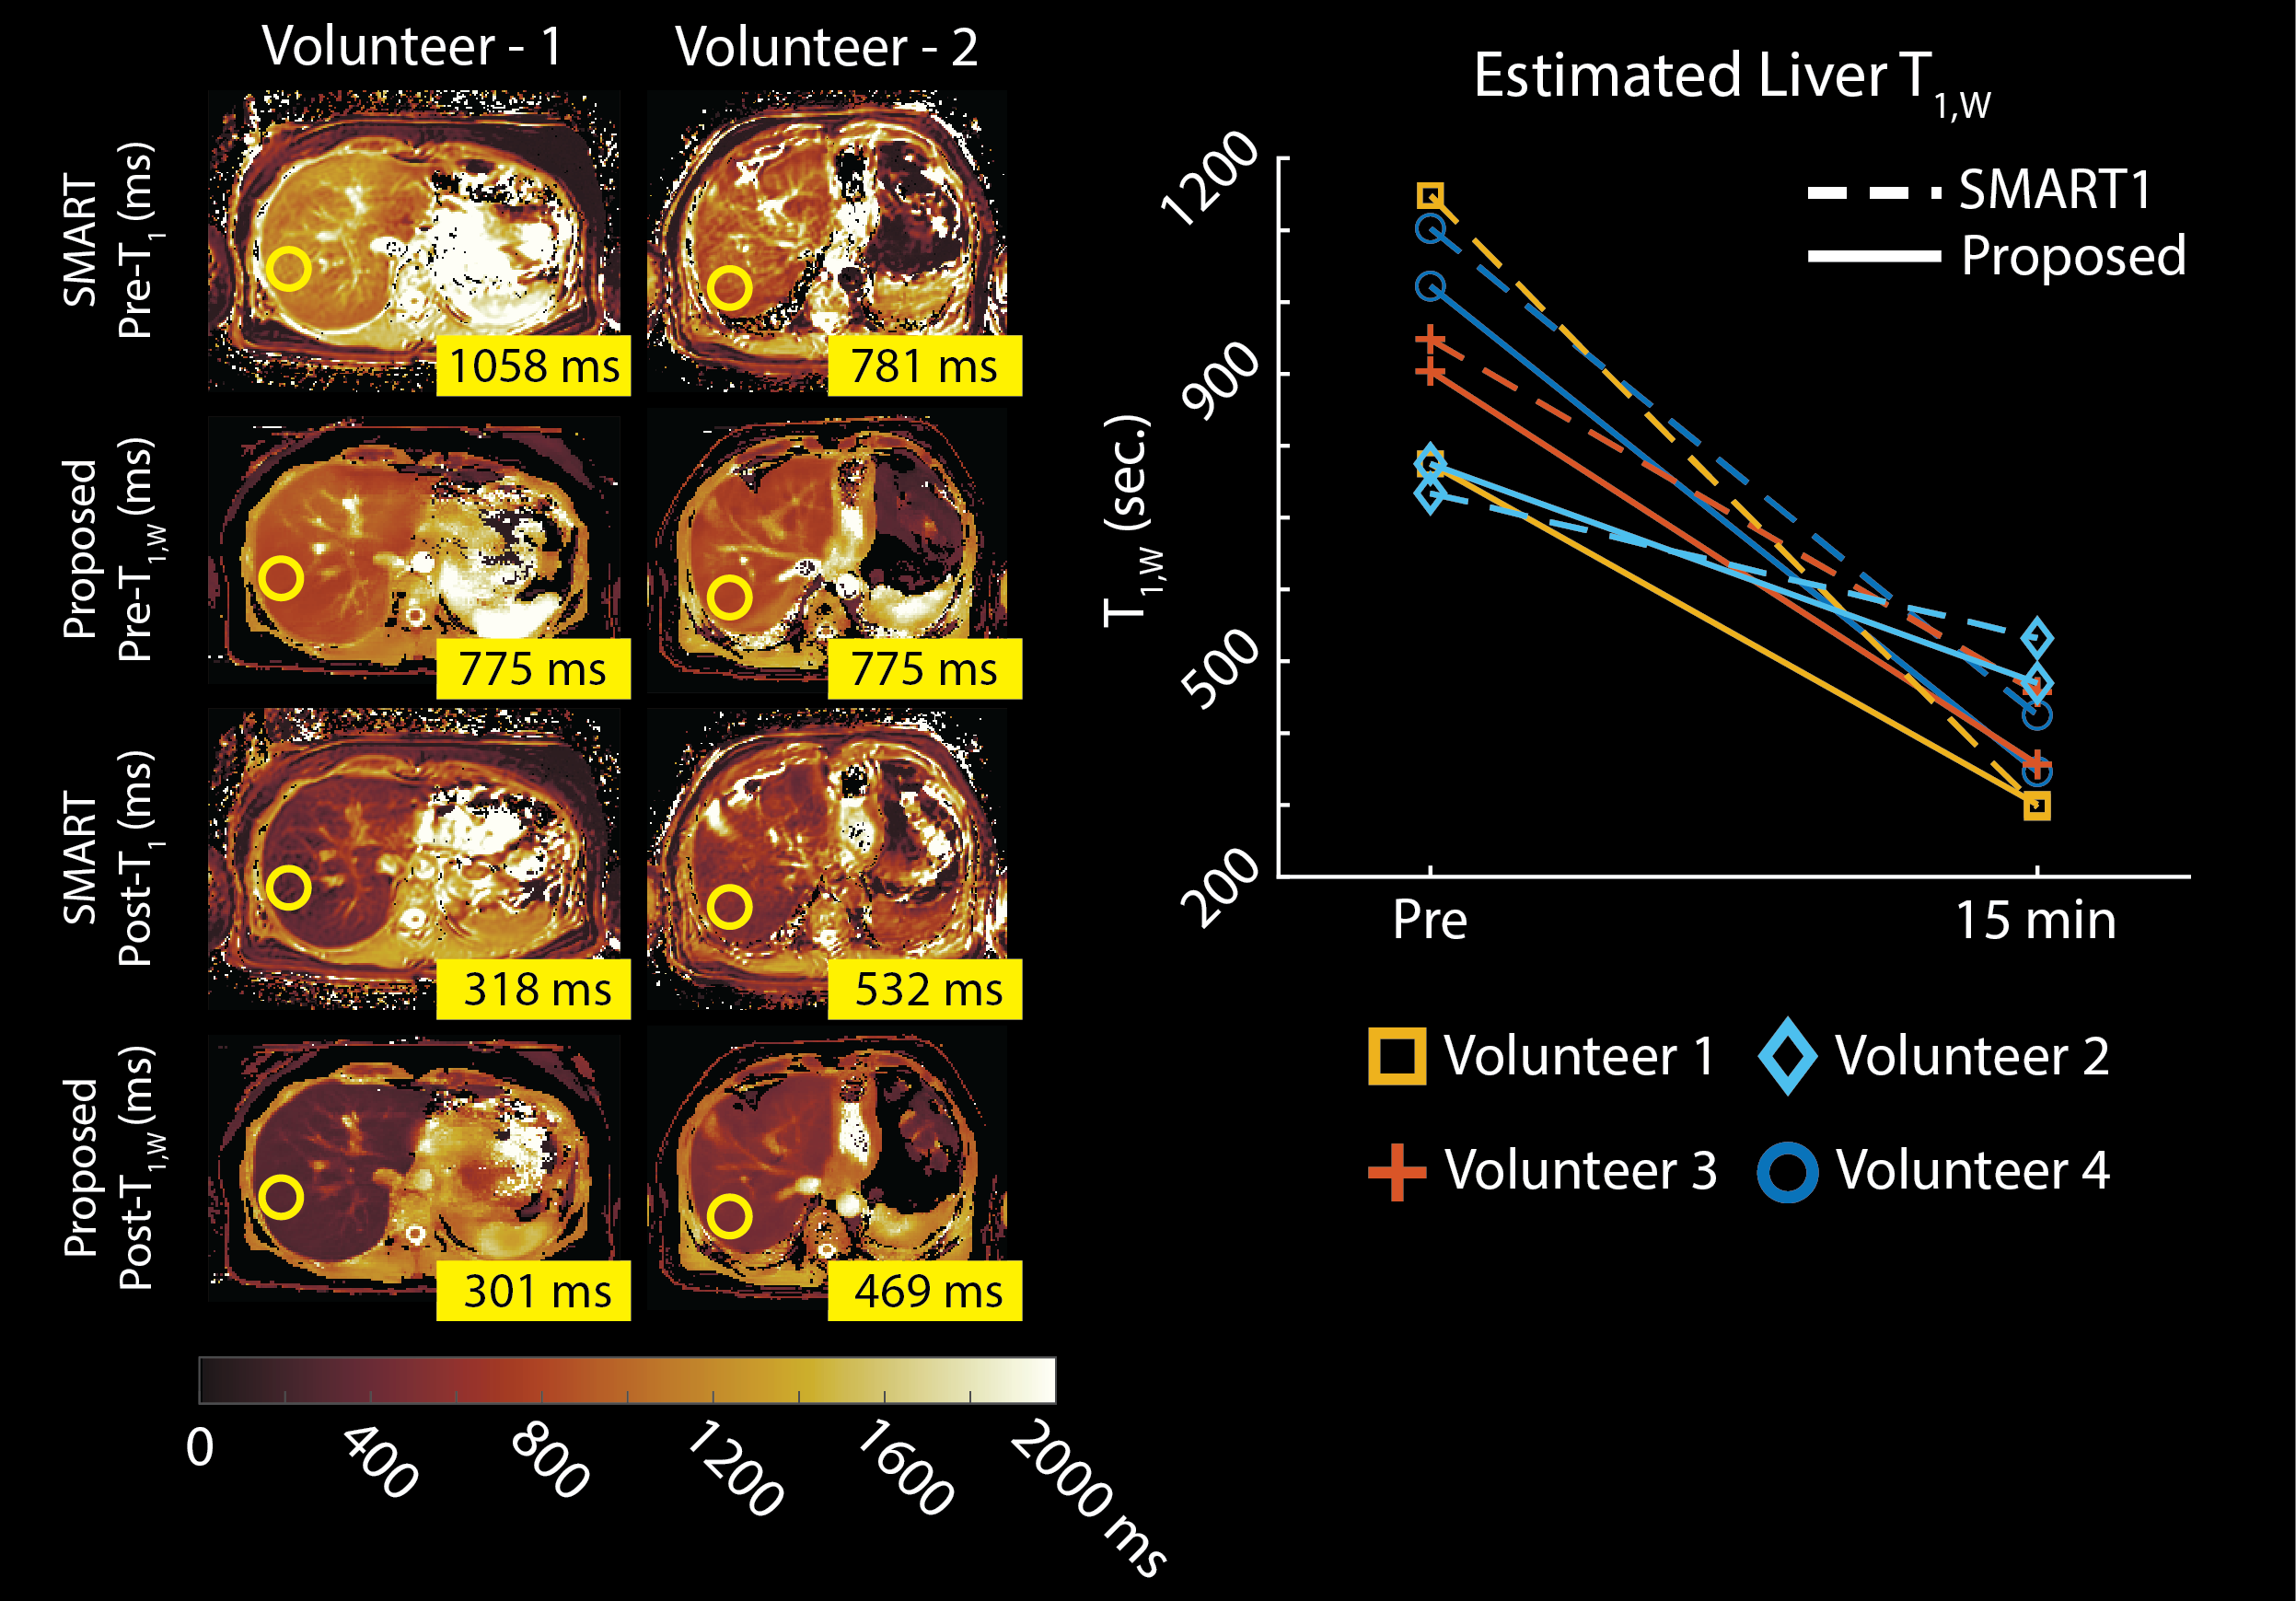
Phantom Experiments: Figure 3 demonstrates the validation of the proposed method on a phantom containing vials with varying PDFF and water specific T1 relaxations. The proposed method produced accurate PDFF, R2*, and B1+ maps. Water-specific T1 maps produced with the proposed method showed excellent agreement with IR-FSE measurements, taken from vials with 0% PDFF, whereas IR-FSE measurements taken from vials with 10-20% PDFF demonstrated the T1 bias due to partial volume effects.In vivo Experiments: Figure 4 demonstrates that the in vivo imaging results. The proposed method showed good agreement with the reference measurements and liver T1 measurements in literature, while providing better SNR performance and volumetric coverage due to motion-robust free-breathing image acquisition18.
Discussion
In this work, we presented a novel free-breathing, volumetric, confounder-corrected T1 mapping method. The proposed method jointly estimates B1+, PDFF and R2*, producing truly confounder-corrected T1 maps. Accuracy and feasibility of the proposed method was demonstrated via phantoms, and pre- and post-contrast in vivo imaging experiments. Currently, this method relies on the motion-robustness of the radial imaging. Therefore, future work is needed to investigate the impact of respiration and reconstruction techniques such as soft-gating in resulting T1 maps.Acknowledgements
We wish to acknowledge investigator-initiated research support from Bayer, UW Institute for Clinical and Translational Research, and the Clinical and Translational Science Award of the NCATS/NIH (UL1TR002373). Further, we wish to acknowledge GE Healthcare who provides research support to the University of Wisconsin. Finally, Dr. Reeder is a Fred Lee Sr. Endowed Chair of Radiology, and has received an award provided by the University of Wisconsin-Madison Office of the Vice Chancellor for Research and Graduate Education with funding from the Wisconsin Alumni Research Foundation.References
[1] B. Taouli, R. L. Ehman, and S. B. Reeder, “Advanced MRI Methods for Assessment of Chronic Liver Disease,” American Journal of Roentgenology, vol. 193, no. 1, pp. 14–27, Jul. 2009, doi: 10.2214/AJR.09.2601.
[2] Ratziu V, Charlotte F, Heurtier A, Gombert S, Giral P, Bruckert E, Grimaldi A, Capron F, Poynard T; LIDO Study Group. Sampling variability of liver biopsy in nonalcoholic fatty liver disease. Gastroenterology. 2005 Jun;128(7):1898-906. doi: 10.1053/j.gastro.2005.03.084.
[3] S. K. Asrani, H. Devarbhavi, J. Eaton, and P. S. Kamath, “Burden of liver diseases in the world,” Journal of Hepatology, vol. 70, no. 1, pp. 151–171, Jan. 2019, doi: 10.1016/j.jhep.2018.09.014.
[4] Z. M. Younossi et al., “Epidemiology of chronic liver diseases in the USA in the past three decades,” Gut, vol. 69, no. 3, pp. 564–568, Mar. 2020, doi: 10.1136/gutjnl-2019-318813.
[5] Ginès P, Graupera I, Lammert F, et al. Screening for liver fibrosis in the general population: a call for action. The Lancet Gastroenterology & Hepatology 2016;1:256–260 doi: 10.1016/S2468-1253(16)30081-4.
[6] Banerjee R, Pavlides M, Tunnicliffe EM, et al. Multiparametric magnetic resonance for the non-invasive diagnosis of liver disease. Journal of hepatology 2014;60:69–77 doi: 10.1016/j.jhep.2013.09.002.
[7] Haaf P, Garg P, Messroghli DR, Broadbent DA, Greenwood JP, Plein S. Cardiac T1 Mapping and Extracellular Volume (ECV) in clinical practice: a comprehensive review. Journal of Cardiovascular Magnetic Resonance 2016;18:89 doi: 10.1186/s12968-016-0308-4.
[8] D. R. Messroghli, A. Radjenovic, S. Kozerke, D. M. Higgins, M. U. Sivananthan, and J. P. Ridgway, “Modified Look-Locker inversion recovery (MOLLI) for high-resolutionT1 mapping of the heart,” Magn. Reson. Med., vol. 52, no. 1, pp. 141–146, Jul. 2004, doi: 10.1002/mrm.20110.
[9] F. E. Mozes, E. M. Tunnicliffe, M. Pavlides, and M. D. Robson, “Influence of fat on liver T 1 measurements using modified Look-Locker inversion recovery (MOLLI) methods at 3T: Influence of Fat on Liver T 1 Measurements,” J. Magn. Reson. Imaging, vol. 44, no. 1, pp. 105–111, Jul. 2016, doi: 10.1002/jmri.25146.
[10] H.-L. M. Cheng and G. A. Wright, “Rapid high-resolutionT1 mapping by variable flip angles: Accurate and precise measurements in the presence of radiofrequency field inhomogeneity,” Magn. Reson. Med., vol. 55, no. 3, pp. 566–574, Mar. 2006, doi: 10.1002/mrm.20791.
[11] Kecskemeti S, Alexander AL. Three-dimensional motion-corrected T1 relaxometry with MPnRAGE. Magn Reson Med. 2020 Nov;84(5):2400-2411. doi: 10.1002/mrm.28283.
[12] Tamir, J.I., Uecker, M., Chen, W., Lai, P., Alley, M.T., Vasanawala, S.S. and Lustig, M. (2017), T2 shuffling: Sharp, multicontrast, volumetric fast spin‐echo imaging. Magn. Reson. Med., 77: 180-195. Doi: 10.1002/mrm.26102
[13] Uecker M, Lai P, Murphy MJ, Virtue P, Elad M, Pauly JM, Vasanawala SS, Lustig M. ESPIRiT--an eigenvalue approach to autocalibrating parallel MRI: where SENSE meets GRAPPA. Magn Reson Med. 2014 Mar;71(3):990-1001. doi: 10.1002/mrm.24751.
[14] D. Hernando, J. H. Kramer, and S. B. Reeder, “Multipeak fat-corrected complex R2* relaxometry: Theory, optimization, and clinical validation: R2* Relaxometry Using Complex Reconstruction,” Magn. Reson. Med., vol. 70, no. 5, pp. 1319–1331, Nov. 2013, doi: 10.1002/mrm.24593.
[15] Barral JK, Gudmundson E, Stikov N, Etezadi-Amoli M, Stoica P, Nishimura DG. A robust methodology for in vivo T1 mapping. Magn Reson Med. 2010 Oct;64(4):1057-67. doi: 10.1002/mrm.22497
[16] Sacolick LI, Wiesinger F, Hancu I, Vogel MW. B1 mapping by Bloch-Siegert shift. Magn Reson Med. 2010 May;63(5):1315-22. doi: 10.1002/mrm.22357.
[17] G. S. Slavin and J. A. Stainsby, “True T1 mapping with SMART1Map (saturation method using adaptive recovery times for cardiac T1 mapping): a comparison with MOLLI,” J Cardiovasc Magn Reson, vol. 15, no. S1, pp. P3, 1532-429X-15-S1-P3, Jan. 2013, doi: 10.1186/1532-429X-15-S1-P3.
[18] Motosugi U, Bannas P, Hernando D, Salmani Rahimi M, Holmes JH, Reeder SB. Intraindividual Crossover Comparison of Gadoxetic Acid Dose for Liver MRI in Normal Volunteers. Magn Reson Med Sci. 2016;15(1):60-72. doi: 10.2463/mrms.2015-0005.
Figures