0669
Golden-angle radial automated phase-cycled bSSFP for fat-water decomposition with SPARCQ: validation in a custom phantom and in vivo1Department of Radiology, Lausanne University Hospital (CHUV) and University of Lausanne (UNIL), Lausanne, Switzerland, 2Department of Diagnostic, Interventional and Pediatric Radiology (DIPR), University of Bern, Bern, Switzerland, 3Translational Imaging Center (TIC), Swiss Institute for Translational and Entrepreneurial Medicine, Bern, Switzerland, 4Center for Biomedical Imaging (CIBM), Lausanne, Switzerland, 5Laboratory of Functional and Metabolic Imaging, Swiss Federal Institute of Technology (EPFL), Lausanne, Switzerland
Synopsis
Keywords: Quantitative Imaging, Fat, phase-cycled bSSFP, fat fraction mapping, radial
The Signal Profiles Asymmetries for Robust multi-Compartment Quantification (SPARCQ) framework uses the off-resonance information encoded in phase-cycled bSSFP (PC-bSSFP) data to estimate fat fraction (FF). In order to strengthen previous validation work as well as open the range of applicability of the technique, in this work a 2D radial bSSFP sequence with integrated automated phase-cycling was designed and the accuracy of SPARCQ was tested in vitro on a larger FF range than previously reported. Comparisons to reference methods and sampling schemes indicate that the proposed automated 2D radial sampling scheme allows accurate FF mapping with SPARCQ while improving scan efficiency.Introduction
Phase-cycled balanced steady-state free precession (PC-bSSFP) permits off-resonance frequency encoding[1], through acquiring multiple scans with incremental RF phase. The Signal Profile Asymmetries for Robust multi-Compartment Quantification (SPARCQ) framework[2] utilizes the PC-bSSFP profiles (steady-state signal as a function of RF phase) to resolve multiple chemical shift species. Previous work on 3D Cartesian knee acquisitions[2] demonstrated the potential of voxel-wise fat-water quantification by SPARCQ, but was not optimal in terms of acquisition time. This hinders its applicability to organs where the high SNR and time-efficiency of bSSFP is particularly desirable compared to conventional methods like multi-echo-GRE (ME-GRE), such as in abdominal imaging.The aim of this study was to implement a 2D golden-angle radial sampling scheme that jointly acquires $$$N$$$ phase cycles (PC), to enable incoherent undersampling[3] and the future acceleration of the acquisition[4]–[7]. SPARCQ was used to quantify fat fraction (FF) in profiles acquired with the proposed sequence, and compared against non-automated scans and conventional quantification methods.
Methods
Sequence design: An automated PC-bSSFP 2D radial research sequence was implemented at 3T (PRISMAfit, MAGNETOM, Siemens Healthineers, Germany). The trajectory consisted of $$$N*n_{s}$$$ radial spokes separated by the golden angle $$$θ=111$$$° organized in $$$N$$$ shots corresponding to $$$N$$$ PCs (Fig.1A), such that the phase increment between successive pulses in a shot $$$k$$$ is $$$\Delta \varphi _{k}=\frac{2\pi k}{N}$$$. A spoiler gradient followed by ramp-up pulses were played before each shot.Phantom experiments: A 14-vial phantom comprising of peanut-oil/water mixtures was scanned using an 18-channel chest array. Parameters for the radial automated PC-bSSFP sequence included an in-plane resolution of 2mm2 and $$$N=20$$$ PCs leading to an RF phase increment $$$\theta=18$$$°. $$$N$$$ separate radial and Cartesian PC-bSSFP scans were performed using similar parameters (Fig.1B). All three acquisitions were fully-sampled and included one dummy shot played at the beginning of the scan. A Cartesian ME-GRE acquisition was performed with 13 echoes spaced by ΔTE=1.97ms, BW=977Hz/px, α=5° and TR=26.64ms. Ground truth FF was assessed with MR spectroscopy (MRS) at 9.4T.
Volunteer experiments: n=3 healthy volunteers had their knee scanned with the ME-GRE and three PC-bSSFP sequences, with a resolution of 1.7mm2.
Post-processing and analysis: All radial images were reconstructed off-line using conventional radial gridding with coil sensitivity weighting[8], while reference Cartesian PC-bSSFP and ME-GRE images were generated at the scanner. In radial acquisitions, retrospective undersampling was applied and resulting profiles were compared to fully-sampled ones.
Fat and water images and FF maps from the PC-bSSFP acquisitions were computed with SPARCQ[2]. Briefly, a dictionary of PC-bSSFP profiles with varied off-resonance and T1/T2 weight was matched to the data using Laplacian-regularized (λ=0.4) non-negative-least-square minimization. Integration of the projected off-resonance spectrum was used to calculate the water and fat proportions.
ME-GRE data was post-processed with a graphcut algorithm[9], [10] using an MRS-determined 9-peak fat model in vitro and a conventional 6-peak fat model in vivo[11], producing fat and water images and a FF map. In vitro, mean FF and standard deviation were measured in ROIs in the vials and compared to MRS. In vivo, FF was measured in sub-cutaneous fat (SCF), muscle (M) and bone marrow (BM). Statistical significance was assessed with t-tests.
Results
In vitro, the automated radial images had similar magnitude contrast as the non-automated images. Nevertheless, streaking-like artefacts that were absent in the non-automated radial images appeared (Fig.2A). All PC-bSSFP sequences yielded matching profiles, and retrospective undersampling of the radial acquisitions by a factor R=2 led to negligible changes in the profiles (Fig.2B).No significant difference was found between FF estimated with SPARCQ using automated and non-automated radial data (P=0.141). However, regression analysis showed a closer match to MRS with the automated technique (Fig.3B). While SPARCQ under-estimated vials with FF>90% (Fig.3), the technique displayed improved precision w.r.t. ME-GRE, and superior accuracy (P=0.002) in the range 0-50% (Fig.3C).
In vivo, overall similarity was observed between SPARCQ images and maps (Fig.4). Swaps in high FF regions (green arrow) were present in Cartesian images and to a lesser degree in radial images. In radial maps, over-estimations (blue arrows) appeared. SPARCQ consistently estimated lower FF in the BM where ME-GRE estimates maximal FF (Fig.4). If quantitative analysis across volunteers in the BM and M showed agreement between the examined maps, larger distributions were estimated by SPARCQ in the SCF (Fig.5).
Discussion
Observations in the 14-vial phantom show that SPARCQ performs particularly well at low FF, and therefore could be suitable for applications such as hepatic imaging where healthy and pathological fat content lies within 0-40%.The slight differences between the PC-bSSFP acquisition strategies can be explained by small variations in the magnetization steady-state preparation (Fig.1B). Future work will investigate how to efficiently maintain steady-state while transitioning between phase cycles.
With the current fully-sampled automated acquisition, the total scan time is 31s and is incompatible with breath-holding required in abdominal imaging for motion mitigation. However, PC-bSSFP profile shape conservation observed after removing half of the spokes suggests that the application of undersampling strategies (in spatial and PC dimensions) would be viable to further accelerate[7], [12], [13].
Conclusion
Fat-water separation and quantification with SPARCQ was validated for small FF. Similar results were obtained with an automated PC-bSSFP 2D golden-angle radial sequence, enabling the future acceleration of the technique.Acknowledgements
This study was financed by the Swiss National Science Foundation (SNSF grant #PCEFP2_194296).References
[1] K. L. Miller, “Asymmetries of the balanced SSFP profile. Part I: Theory and observation,” Magn. Reson. Med., vol. 63, no. 2, pp. 385–395, 2010, doi: 10.1002/mrm.22212.
[2] G. M. Rossi, T. Hilbert, A. L. Mackowiak, K. Pierzchała, T. Kober, and J. A. Bastiaansen, “Fat fraction mapping using bSSFP Signal Profile Asymmetries for Robust multi-Compartment Quantification (SPARCQ).” arXiv, May 19, 2020. doi: 10.48550/arXiv.2005.09734.
[3] L. Feng, “Golden-Angle Radial MRI: Basics, Advances, and Applications,” J. Magn. Reson. Imaging, vol. 56, no. 1, pp. 45–62, 2022, doi: 10.1002/jmri.28187.
[4] T. Benkert, P. Ehses, M. Blaimer, P. M. Jakob, and F. A. Breuer, “Dynamically phase-cycled radial balanced SSFP imaging for efficient banding removal,” Magn. Reson. Med., vol. 73, no. 1, pp. 182–194, 2015, doi: 10.1002/mrm.25113.
[5] Y. Wang, X. Shao, T. Martin, S. Moeller, E. Yacoub, and D. J. J. Wang, “Phase-cycled simultaneous multislice balanced SSFP imaging with CAIPIRINHA for efficient banding reduction,” Magn. Reson. Med., vol. 76, no. 6, pp. 1764–1774, 2016, doi: 10.1002/mrm.26076.
[6] A. Datta, D. G. Nishimura, and C. A. Baron, “Banding-free balanced SSFP cardiac cine using frequency modulation and phase cycle redundancy,” Magn. Reson. Med., vol. 82, no. 5, pp. 1604–1616, 2019, doi: 10.1002/mrm.27815.
[7] L. Feng, Q. Wen, C. Huang, A. Tong, F. Liu, and H. Chandarana, “GRASP-Pro: imProving GRASP DCE-MRI through self-calibrating subspace-modeling and contrast phase automation,” Magn. Reson. Med., vol. 83, no. 1, pp. 94–108, 2020, doi: 10.1002/mrm.27903.
[8] D. O. Walsh, A. F. Gmitro, and M. W. Marcellin, “Adaptive reconstruction of phased array MR imagery,” Magn. Reson. Med., vol. 43, no. 5, pp. 682–690, 2000, doi: 10.1002/(SICI)1522-2594(200005)43:5<682::AID-MRM10>3.0.CO;2-G.
[9] H. H. Hu et al., “ISMRM workshop on fat–water separation: Insights, applications and progress in MRI,” Magn. Reson. Med., vol. 68, no. 2, pp. 378–388, 2012, doi: 10.1002/mrm.24369.
[10] D. Hernando, P. Kellman, J. P. Haldar, and Z.-P. Liang, “Robust water/fat separation in the presence of large field inhomogeneities using a graph cut algorithm,” Magn. Reson. Med., vol. 63, no. 1, pp. 79–90, 2010, doi: 10.1002/mrm.22177.
[11] H. Yu, A. Shimakawa, C. A. McKenzie, E. Brodsky, J. H. Brittain, and S. B. Reeder, “Multiecho water-fat separation and simultaneous R estimation with multifrequency fat spectrum modeling,” Magn. Reson. Med., vol. 60, no. 5, pp. 1122–1134, 2008, doi: 10.1002/mrm.21737.
[12] E. Ilicak, L. K. Senel, E. Biyik, and T. Çukur, “Profile-encoding reconstruction for multiple-acquisition balanced steady-state free precession imaging,” Magn. Reson. Med., vol. 78, no. 4, pp. 1316–1329, 2017, doi: 10.1002/mrm.26507.
[13] T.
Çukur, “Accelerated Phase-Cycled SSFP Imaging With Compressed Sensing,” IEEE
Trans. Med. Imaging, vol. 34, no. 1, pp. 107–115, Jan. 2015, doi:
10.1109/TMI.2014.2346814.
Figures
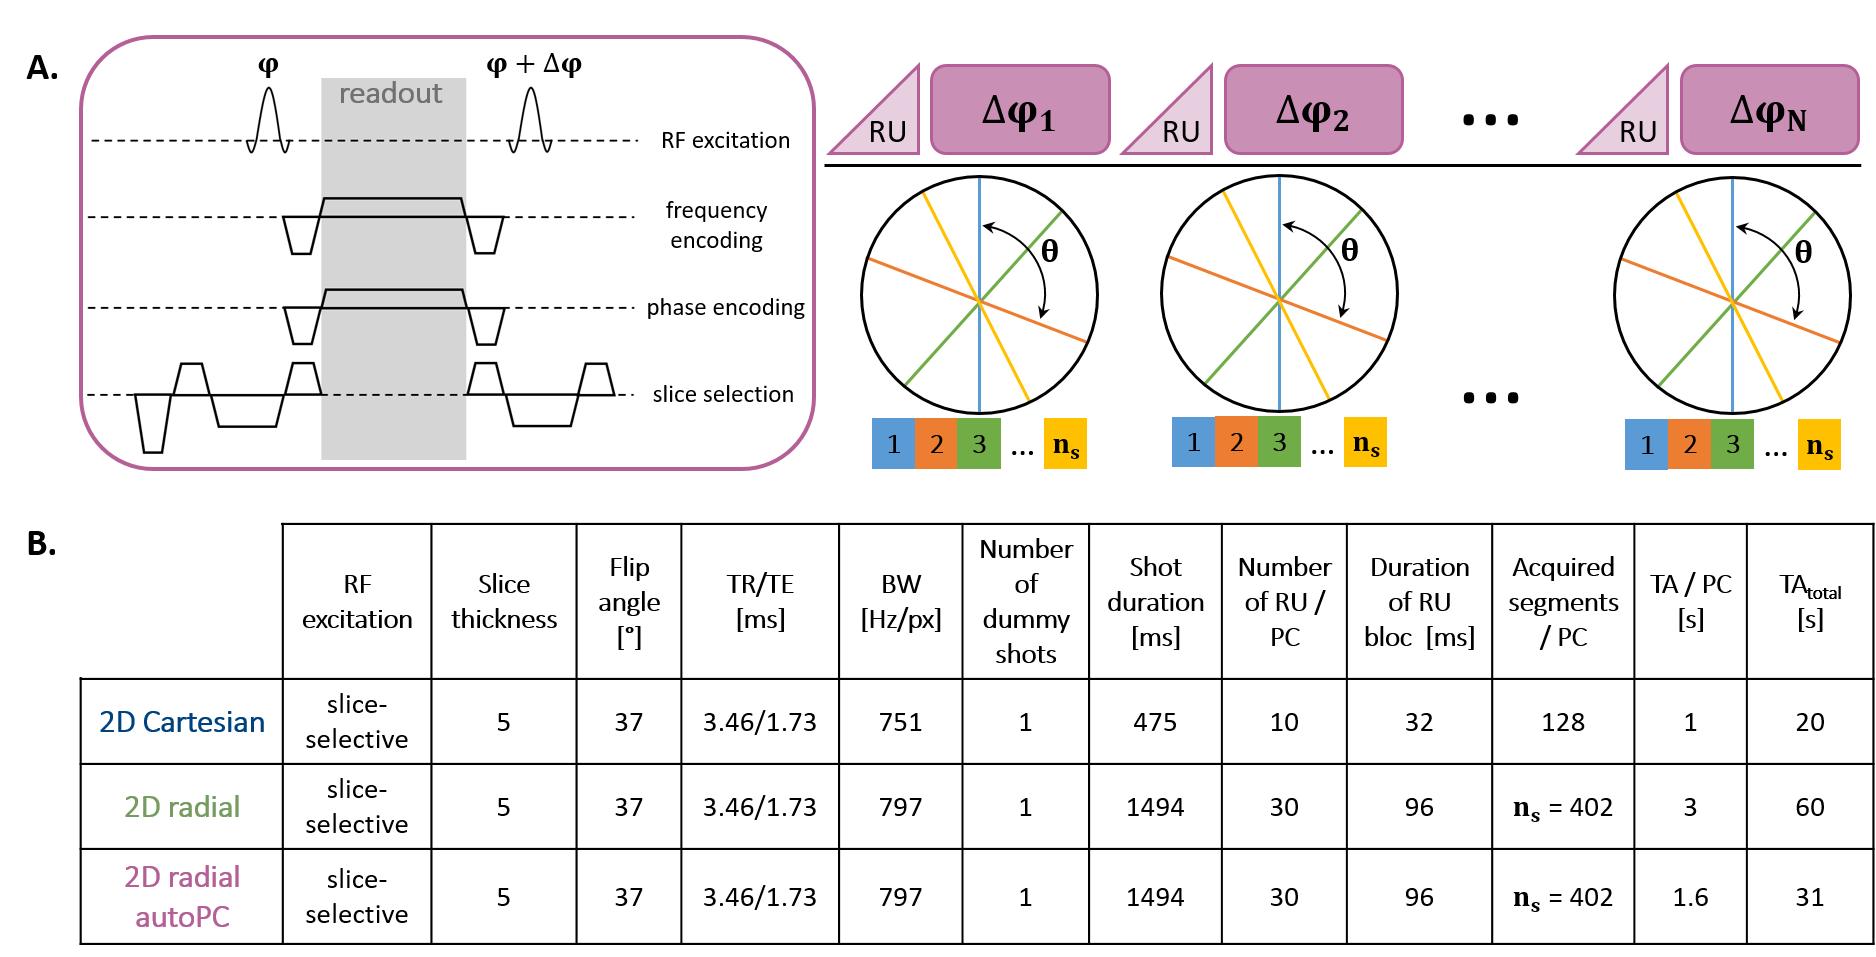
Fig.1: Proposed automated 2D radial PC-bSSFP MRI (autoPC) sequence diagram and trajectory, and sequence parameters of examined sequences
In PC-bSSFP imaging, the phase of the RF pulse increases by at each TR.
A. The proposed research application sequence combines a golden-angle radial trajectory with RF phase increments combined into one acquisition (autoPC).
B. Sequence parameters for the three examined sequences, including parameters related to steady-state preparation such as ramp-up (RU) pulses.
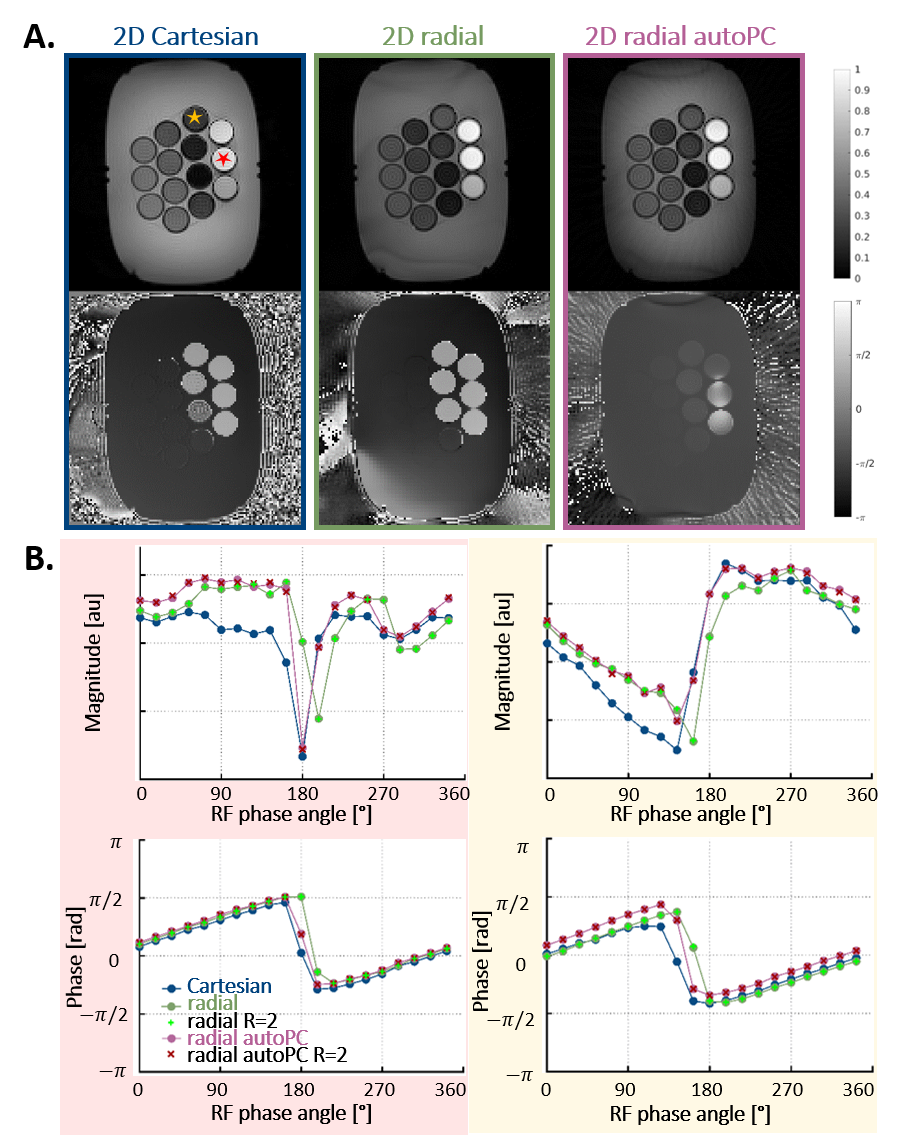
Fig.2: PC-bSSFP images and profiles obtained with the 2D Cartesian, 2D radial and 2D radial automated (autoPC) sequences in vitro
A. Magnitude and phase images obtained for an RF phase angle of 90°. A banding artifact can be seen in the radial images at the bottom of the phantom.
B. Corresponding PC-bSSFP magnitude and phase profiles obtained with the three sequences, in voxels containing 100% fat (red) and 50% fat (yellow). Profiles obtained with radial sequences artificially undersampled with an acceleration factor R=2 are indicated in bright green and red markers.
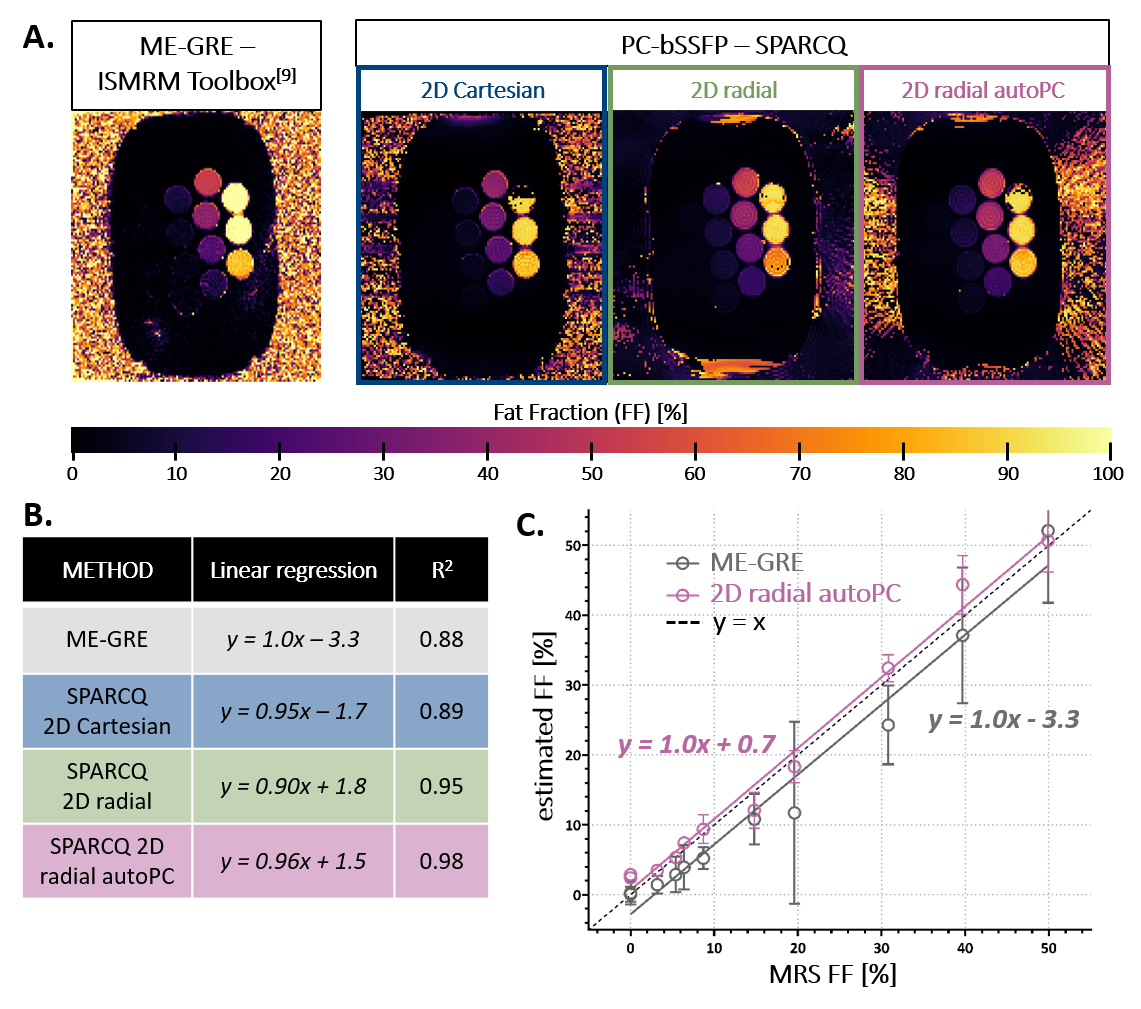
Fig.3: Fat fraction mapping in a peanut-oil/water phantom
A. FF maps obtained with the ME-GRE and PC-bSSFP acquisitions. 14 vials of peanut-oil/water mixture in concentrations [0.0;0.0;3.2;5.4;6.4;8.7;14.8;19.6;30.8;39.7;49.9;78.0;100.0;100.0]% were analysed.
B. Linear regression parameters and R2 for each acquisition scheme, assessed by comparing to MRS (the last 100% fat-fraction vial was excluded from the analysis due to the swap in the Cartesian map).
C. Correlation to MR spectroscopy values for 2D radial automated PC-bSSFP and ME-GRE in the 0-50% FF range.
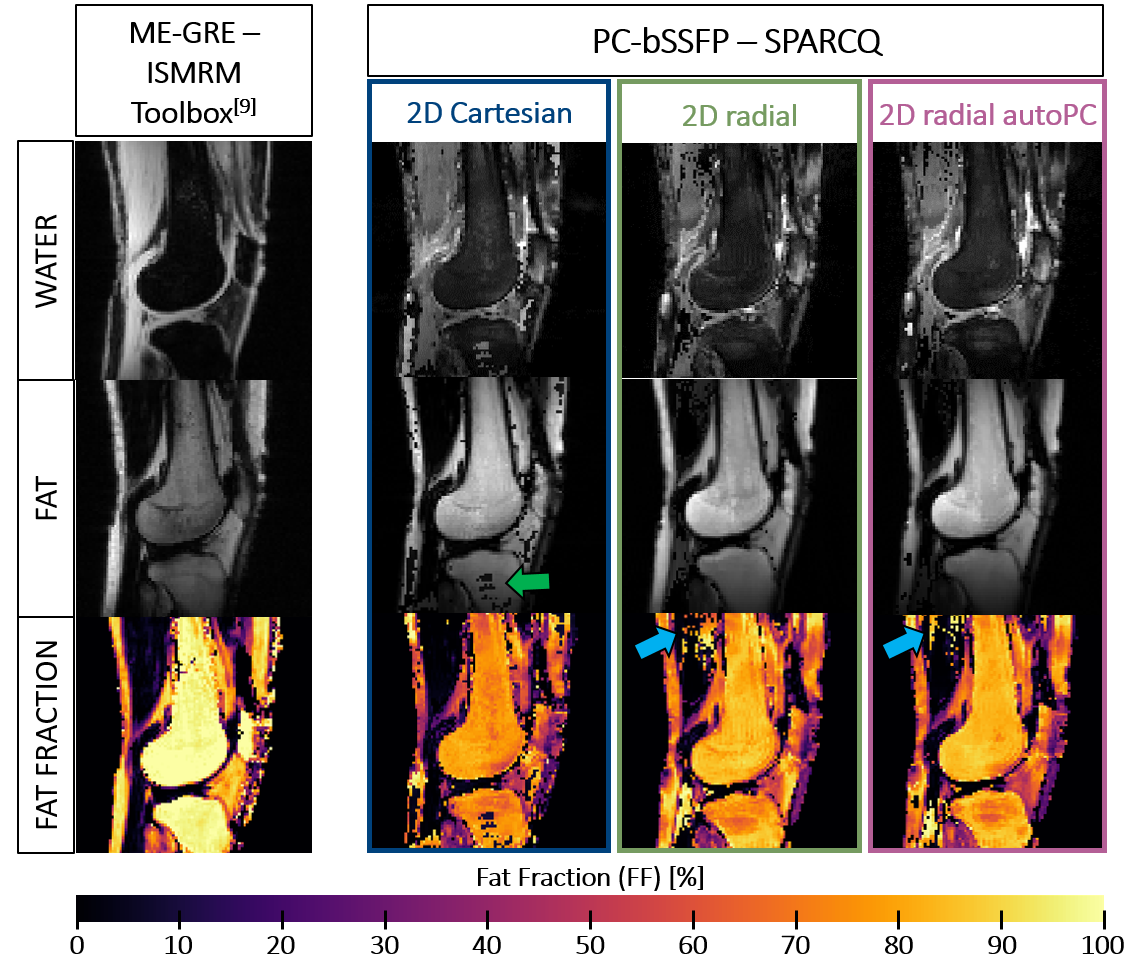
Fig.4: Fat-water separation and quantification in the healthy knee with SPARCQ
The separated fat and water images as well as the FF map obtained with ME-GRE decomposition using the ISMRM Fat/Water Toolbox are shown on the left for reference. The scaling on the water images obtained with SPARCQ (top row) has been modified to enhance visibility of fine structures, and therefore does not match that of the ME-GRE image. Estimation errors by SPARCQ are denoted by arrows (green in Cartesian and blue in radial maps).
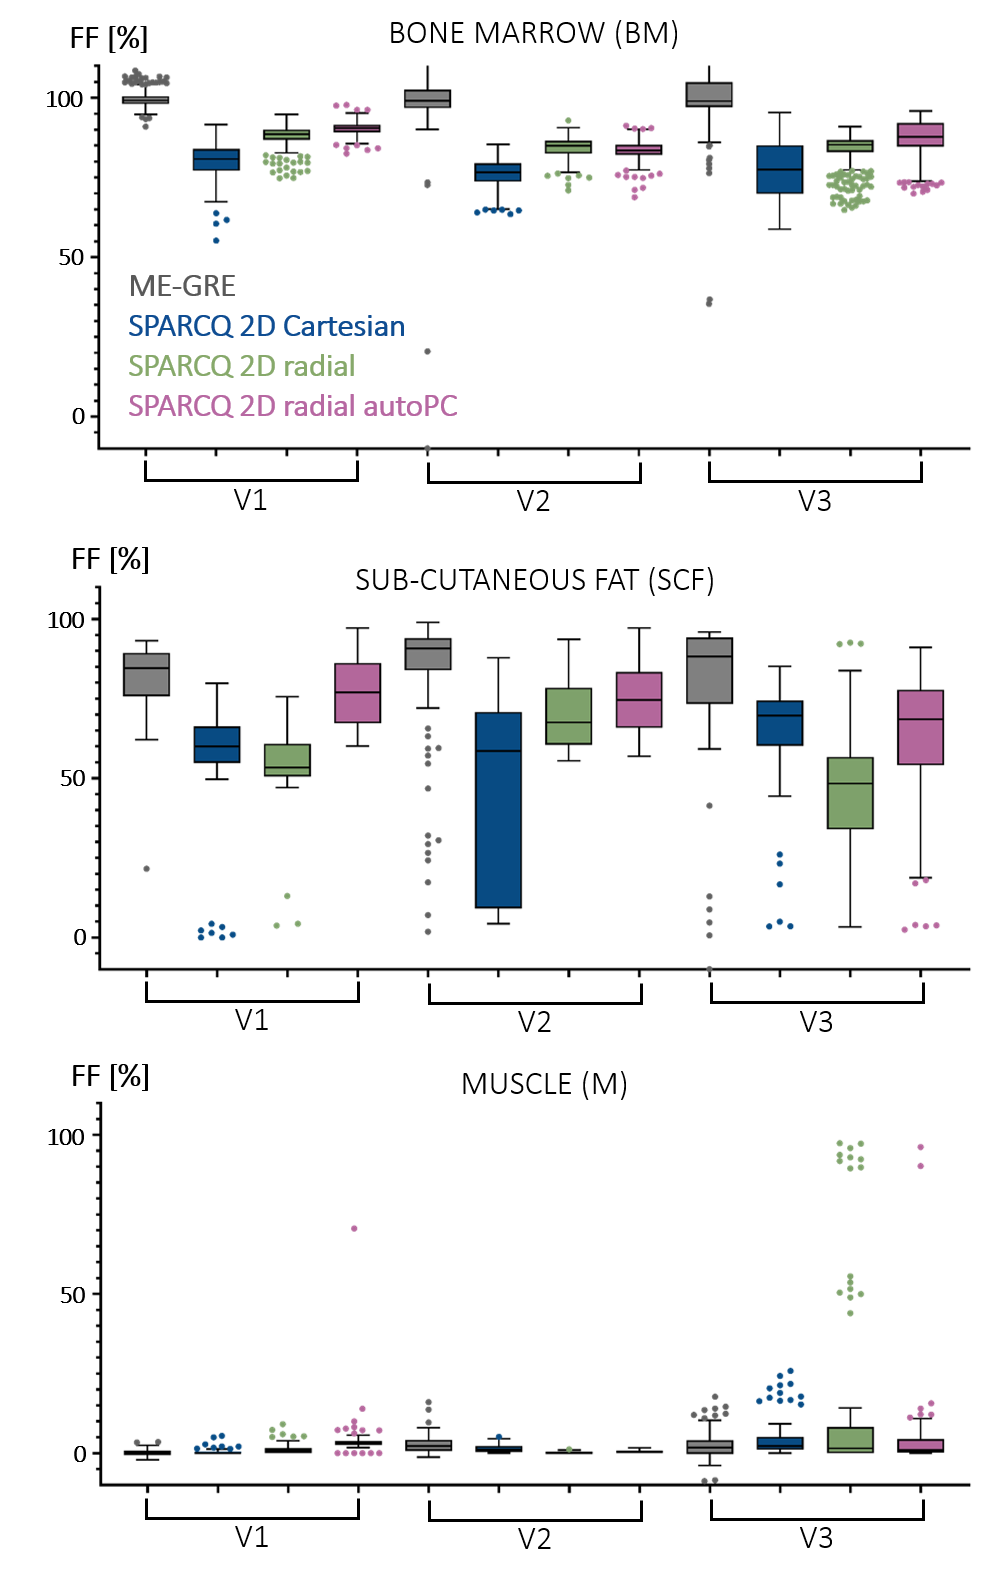
Fig.5: Quantitative analysis in healthy volunteers
Box-and-whiskers plots of the FF measured in the maps obtained with ME-GRE and SPARCQ, in three tissue types and for three volunteers. High FF tissue types such as SCF show larger distributions for all methods evaluated.