0667
Dynamic T2* Relaxometry of Hyperpolarized [1-13C]pyruvate MRI in the Human Brain and Kidneys1Department of Radiology & Biomedical Imaging, University of California, San Francisco, San Francisco, CA, United States, 2Graduate Program in Bioengineering, University of California, Berkeley and San Francisco, San Francisco, CA, United States
Synopsis
Keywords: Quantitative Imaging, Hyperpolarized MR (Non-Gas)
We present dynamic T2* measurements for HP [1-13C]pyruvate and metabolites in a healthy human brain volunteer and two RCC patients at 3T. The T2* of pyruvate was shown to vary during the acquisition, whereas the T2* of lactate and bicarbonate was constant through time and across organs. The T2* of lactate was constant at gray matter (30.1±5.9ms), white matter (33.8±7.6ms), healthy kidney (38.94±6.9ms) and tumor (33.27±6.4ms), and the T2* of bicarbonate over whole-brain (109.5±12.8ms) and kidney (64.6±15.8ms). These relaxometry measurements will be useful for future sequence optimization and can be included in kinetic modeling to harmonize data across different TEs.Introduction
Hyperpolarized (HP) 13C-labeled MRI is a noninvasive method to assess metabolic processes in vivo.1,2 However, the signal-to-noise (SNR), spatial and temporal resolution of HP 13C imaging are limited by the unrenewable HP magnetization. A better understanding of the transverse relaxation (T2*) would be beneficial for sequence optimization and would improve quantification and data harmonization across sites3 since kinetic models4,5 implicitly neglect T2* decay, but relaxometry studies in pre-clinical models and in humans have been limited6. To overcome this gap in our knowledge, in this work we quantified dynamic T2* of [1-13C]pyruvate and its products in a healthy brain volunteer and two renal carcinoma cell (RCC) patients using a metabolite-specific multi-echo GRE sequence.Methods
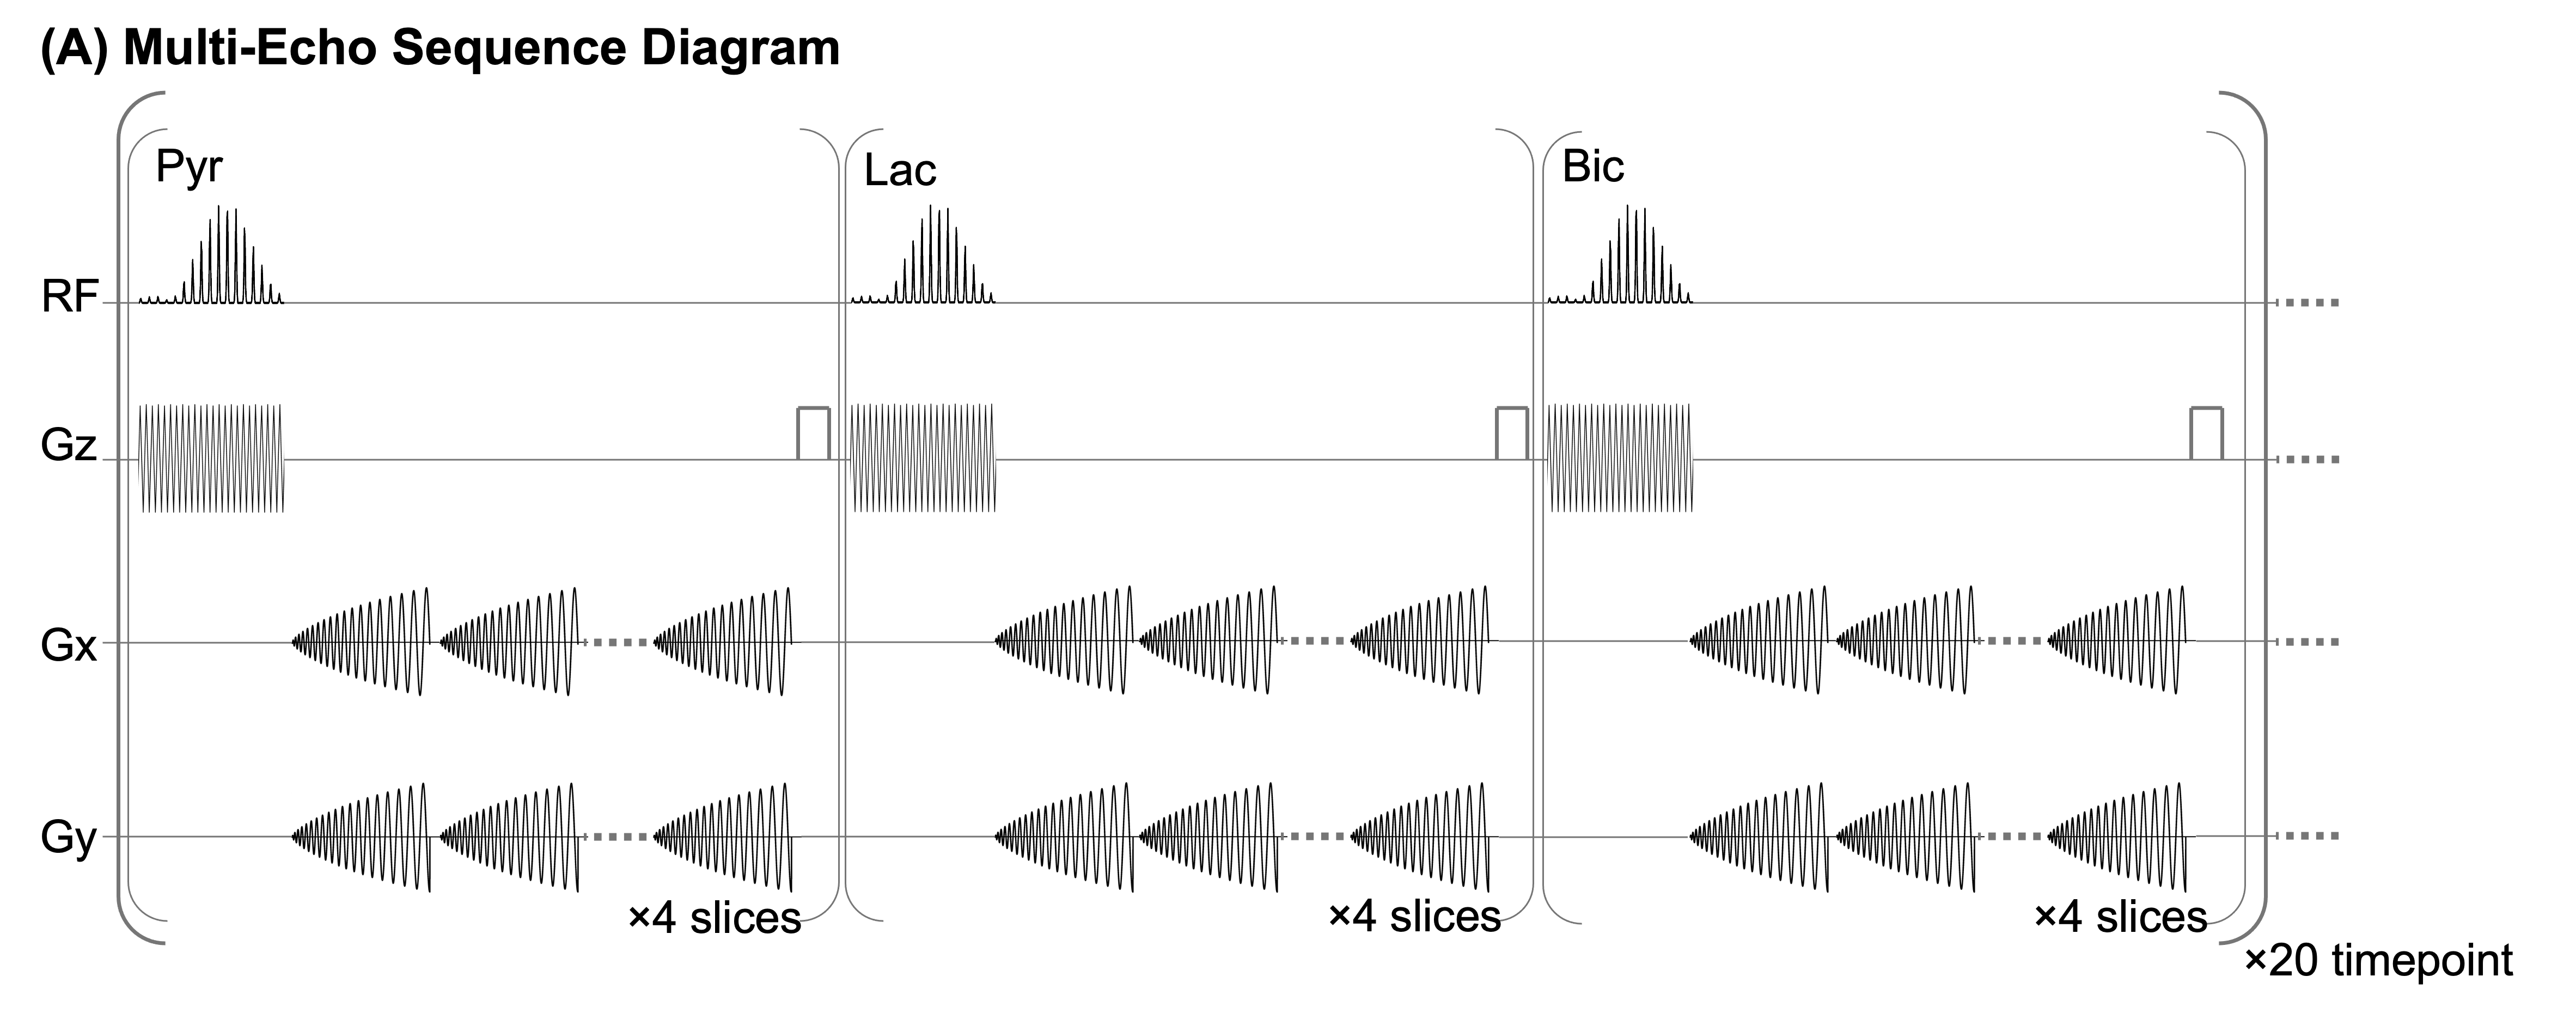
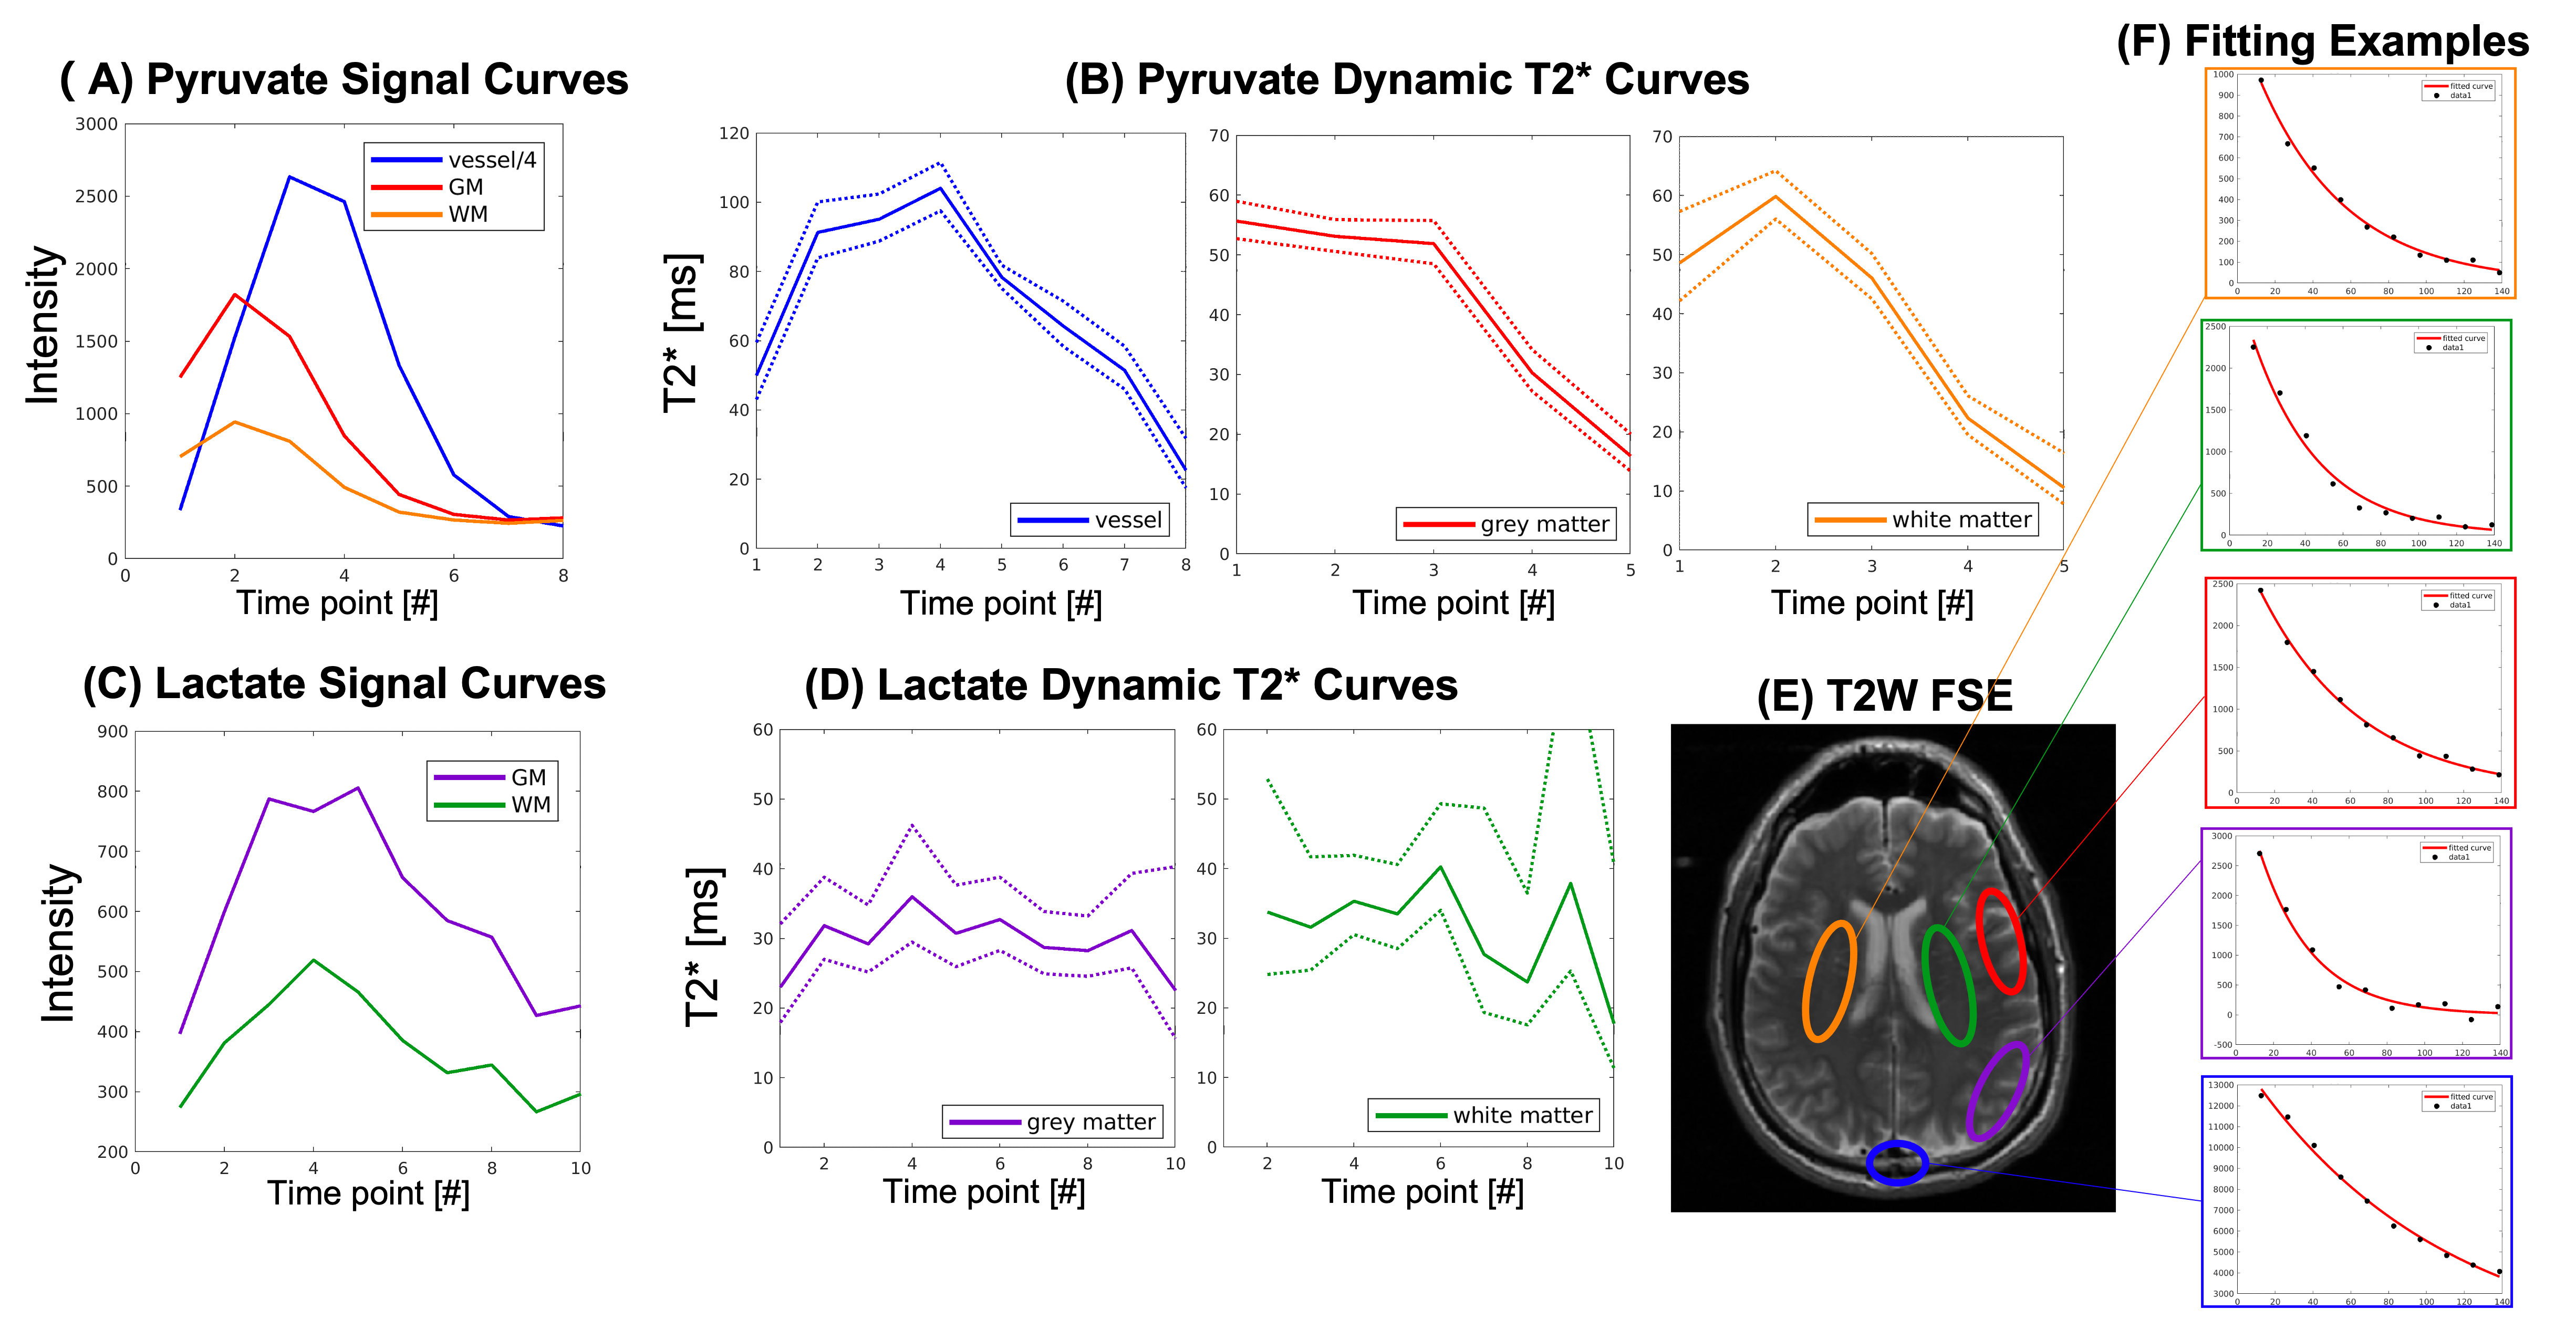
Sequence: HP 13C data were acquired with a multi-slice metabolite-specific multi-echo spiral sequence (Fig.1(A)), which was implemented on a GE 3T scanner (MR750, GE Healthcare, Waukesha, WI) using commercial software (RTHawk, HeartVista, CA). In each repetition time (TR), one spectral-spatial RF pulse (25.17ms, passband 80Hz, and stopband 770Hz) was followed by ten single-shot gradient-refocused spiral readouts with 14ms echo-spacing.Human Brain Study (N=1): The brain study used a birdcage coil for RF transmit with an integrated 24-channel receiver (Rapid Biomedical, Würzburg, Germany). The acquisition started 4s after the saline flush was completed, followed by frequency calibration and B1+ mapping7. Acquisition parameters: FOV=24$$$\times$$$24cm2, resolution=0.75$$$\times$$$0.75cm2 (pyruvate) and 1.5$$$\times$$$1.5cm2(lactate/bicarbonate), slice thickness=2.1cm, flip angle=20° (pyruvate) and 30° (lactate/bicarbonate), TE1=12.6ms, ΔTE=14ms, TR=250ms, 4 slices, temporal resolution=3s.
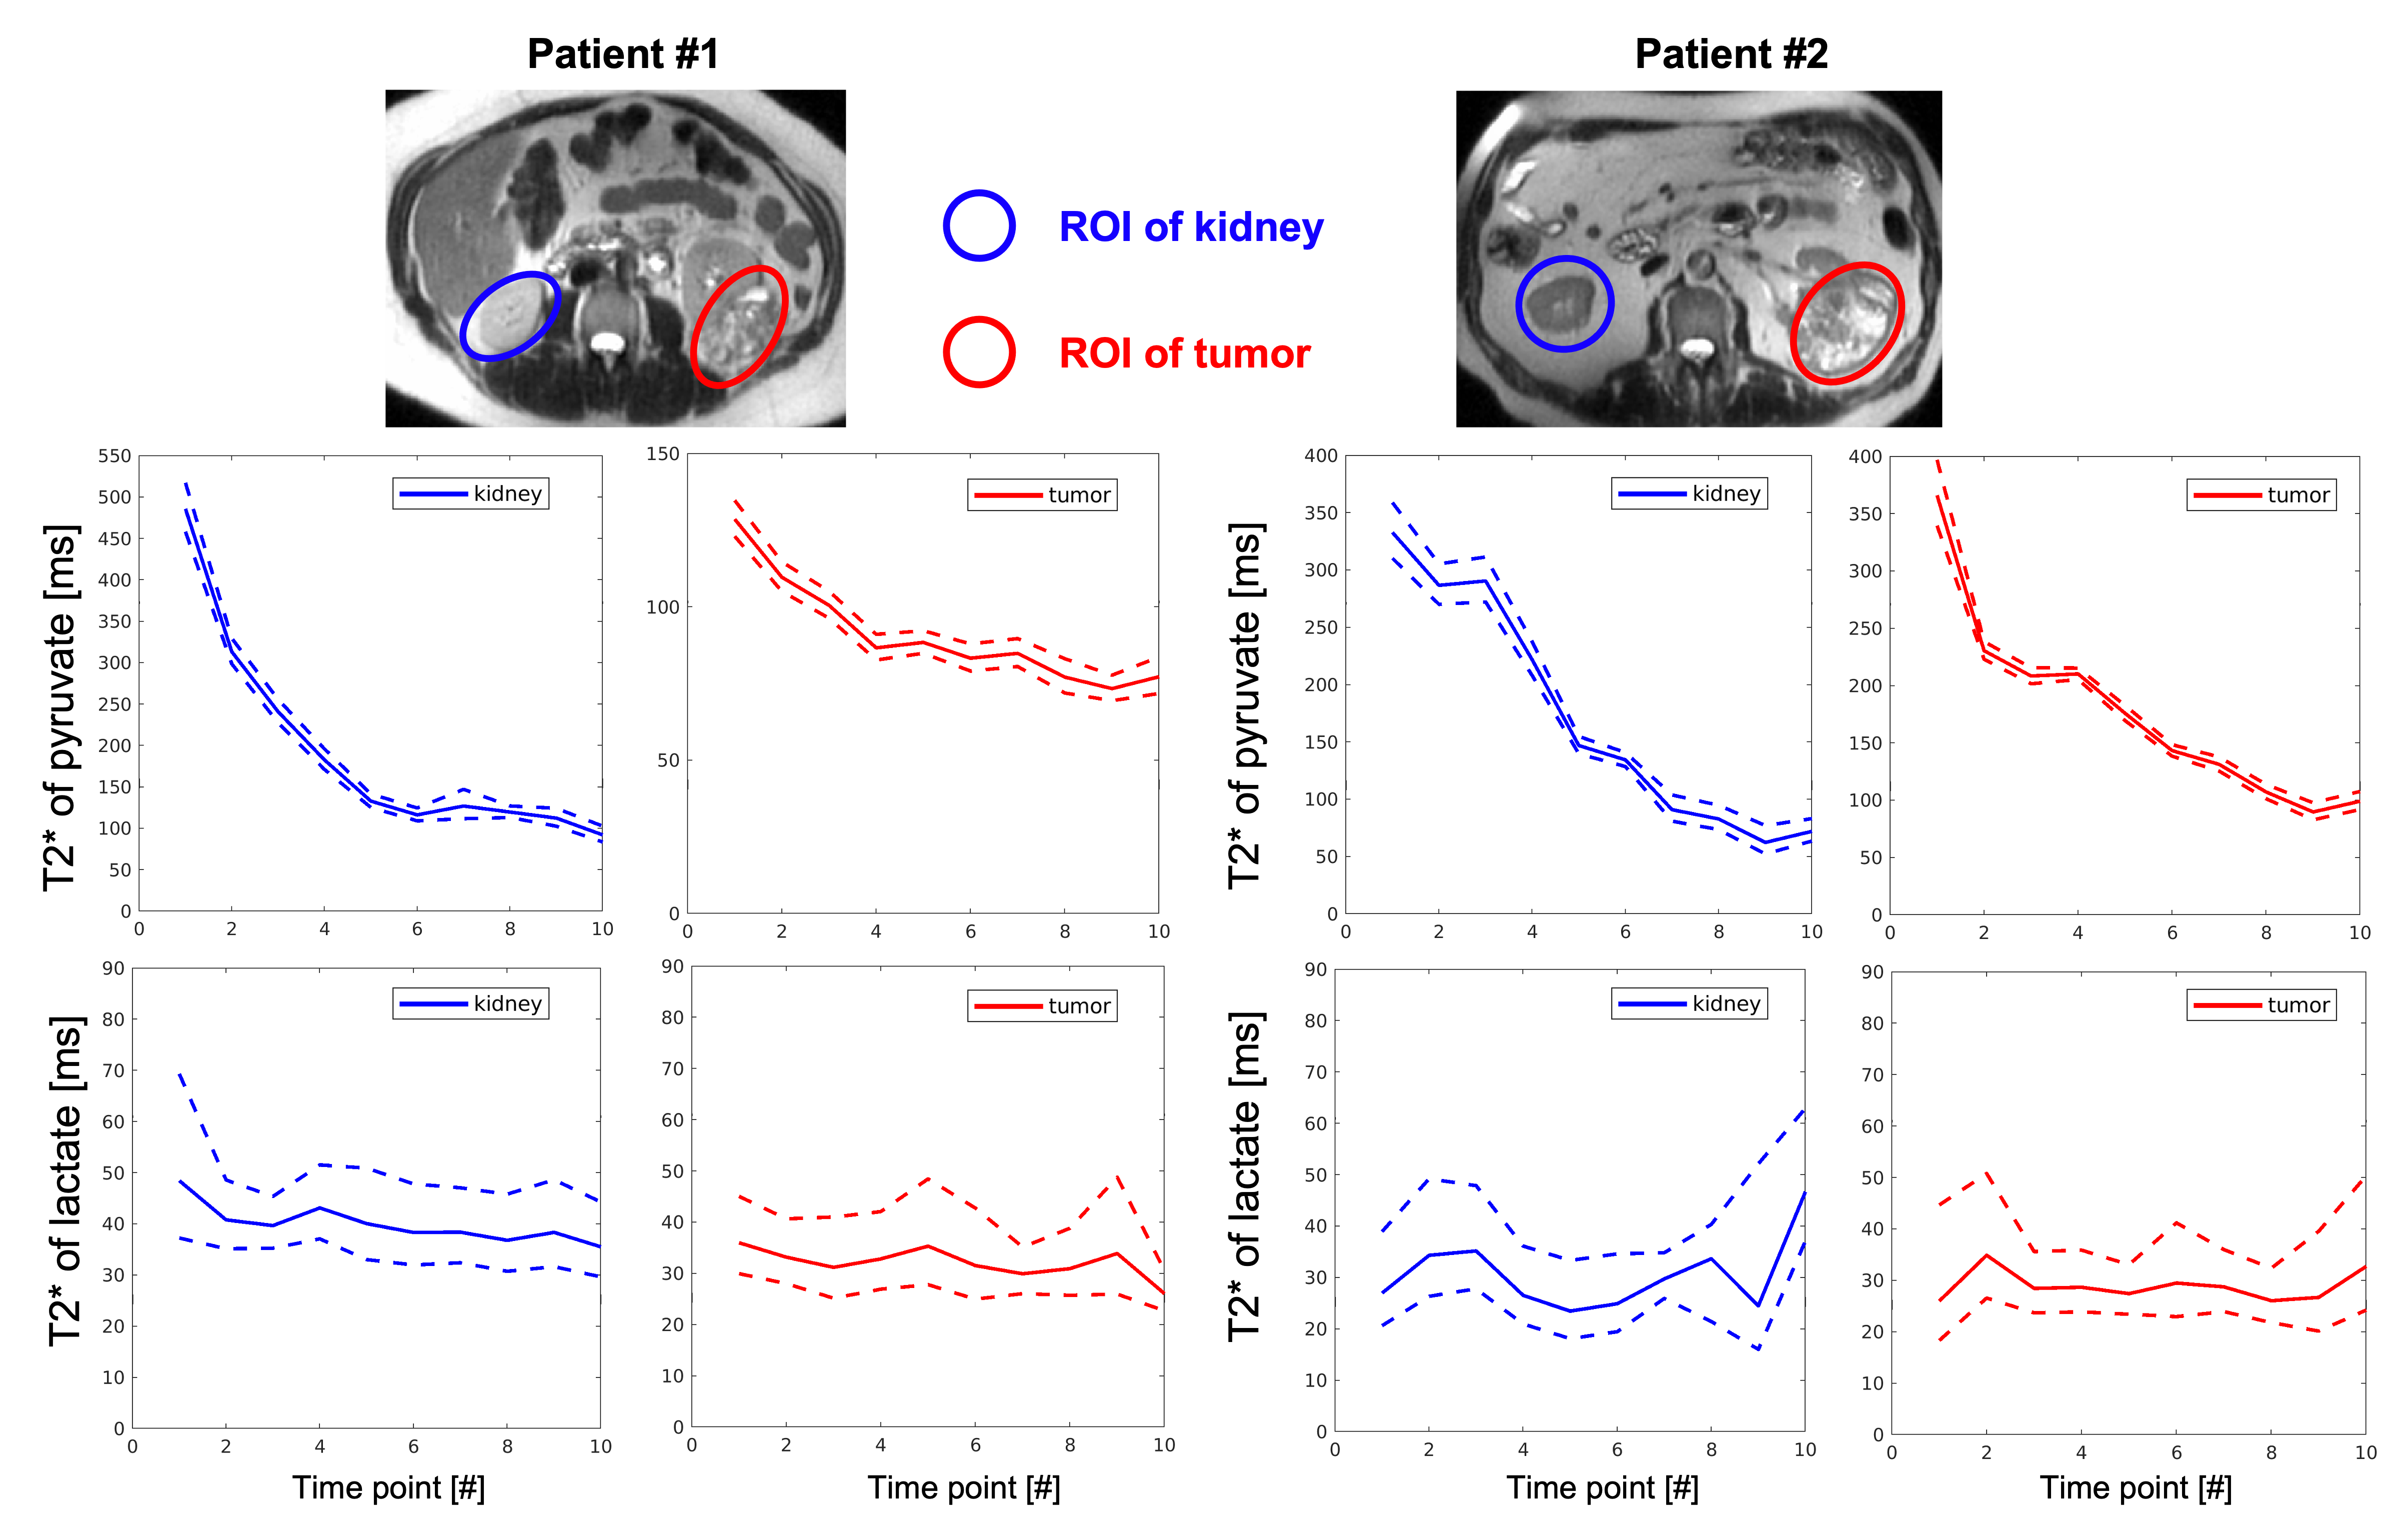
Human Renal Cell Carcinoma Studies (RCC, N=2): Data were acquired with a semi-flexible quadrature transmit and 8-channel receive array (QTAR, Clinical MR Solutions, Brookfield, WI). The acquisitions were triggered by bolus tracking on the kidney. Acquisition parameters: FOV=57$$$\times$$$57cm2, resolution=1.5$$$\times$$$1.5cm2 (pyruvate) and 2$$$\times$$$2cm2 (lactate), TR=200ms, 5 slices; all other parameters are the same as the brain study.
Data Reconstruction and Analysis: HP 13C data were reconstructed directly by inverse Fourier transform to the image domain after gridding8. The phase caused by B0 inhomogeneity among different echoes were corrected by the dephasing maps measured from pyruvate signal at the timepoint with its highest signal. To quantify SNR improvement when summing echoes, echo images with SNR>2 were used. The regions-of-interest (ROIs) were manually drawn based on the proton images. The mean signal of an ROI was fitted to a mono-exponential function with noise offset correction9 to measure the T2* of each metabolite at each timepoint. All timepoints with echo SNR>3 were used to calculate T2*.
Results and Discussion
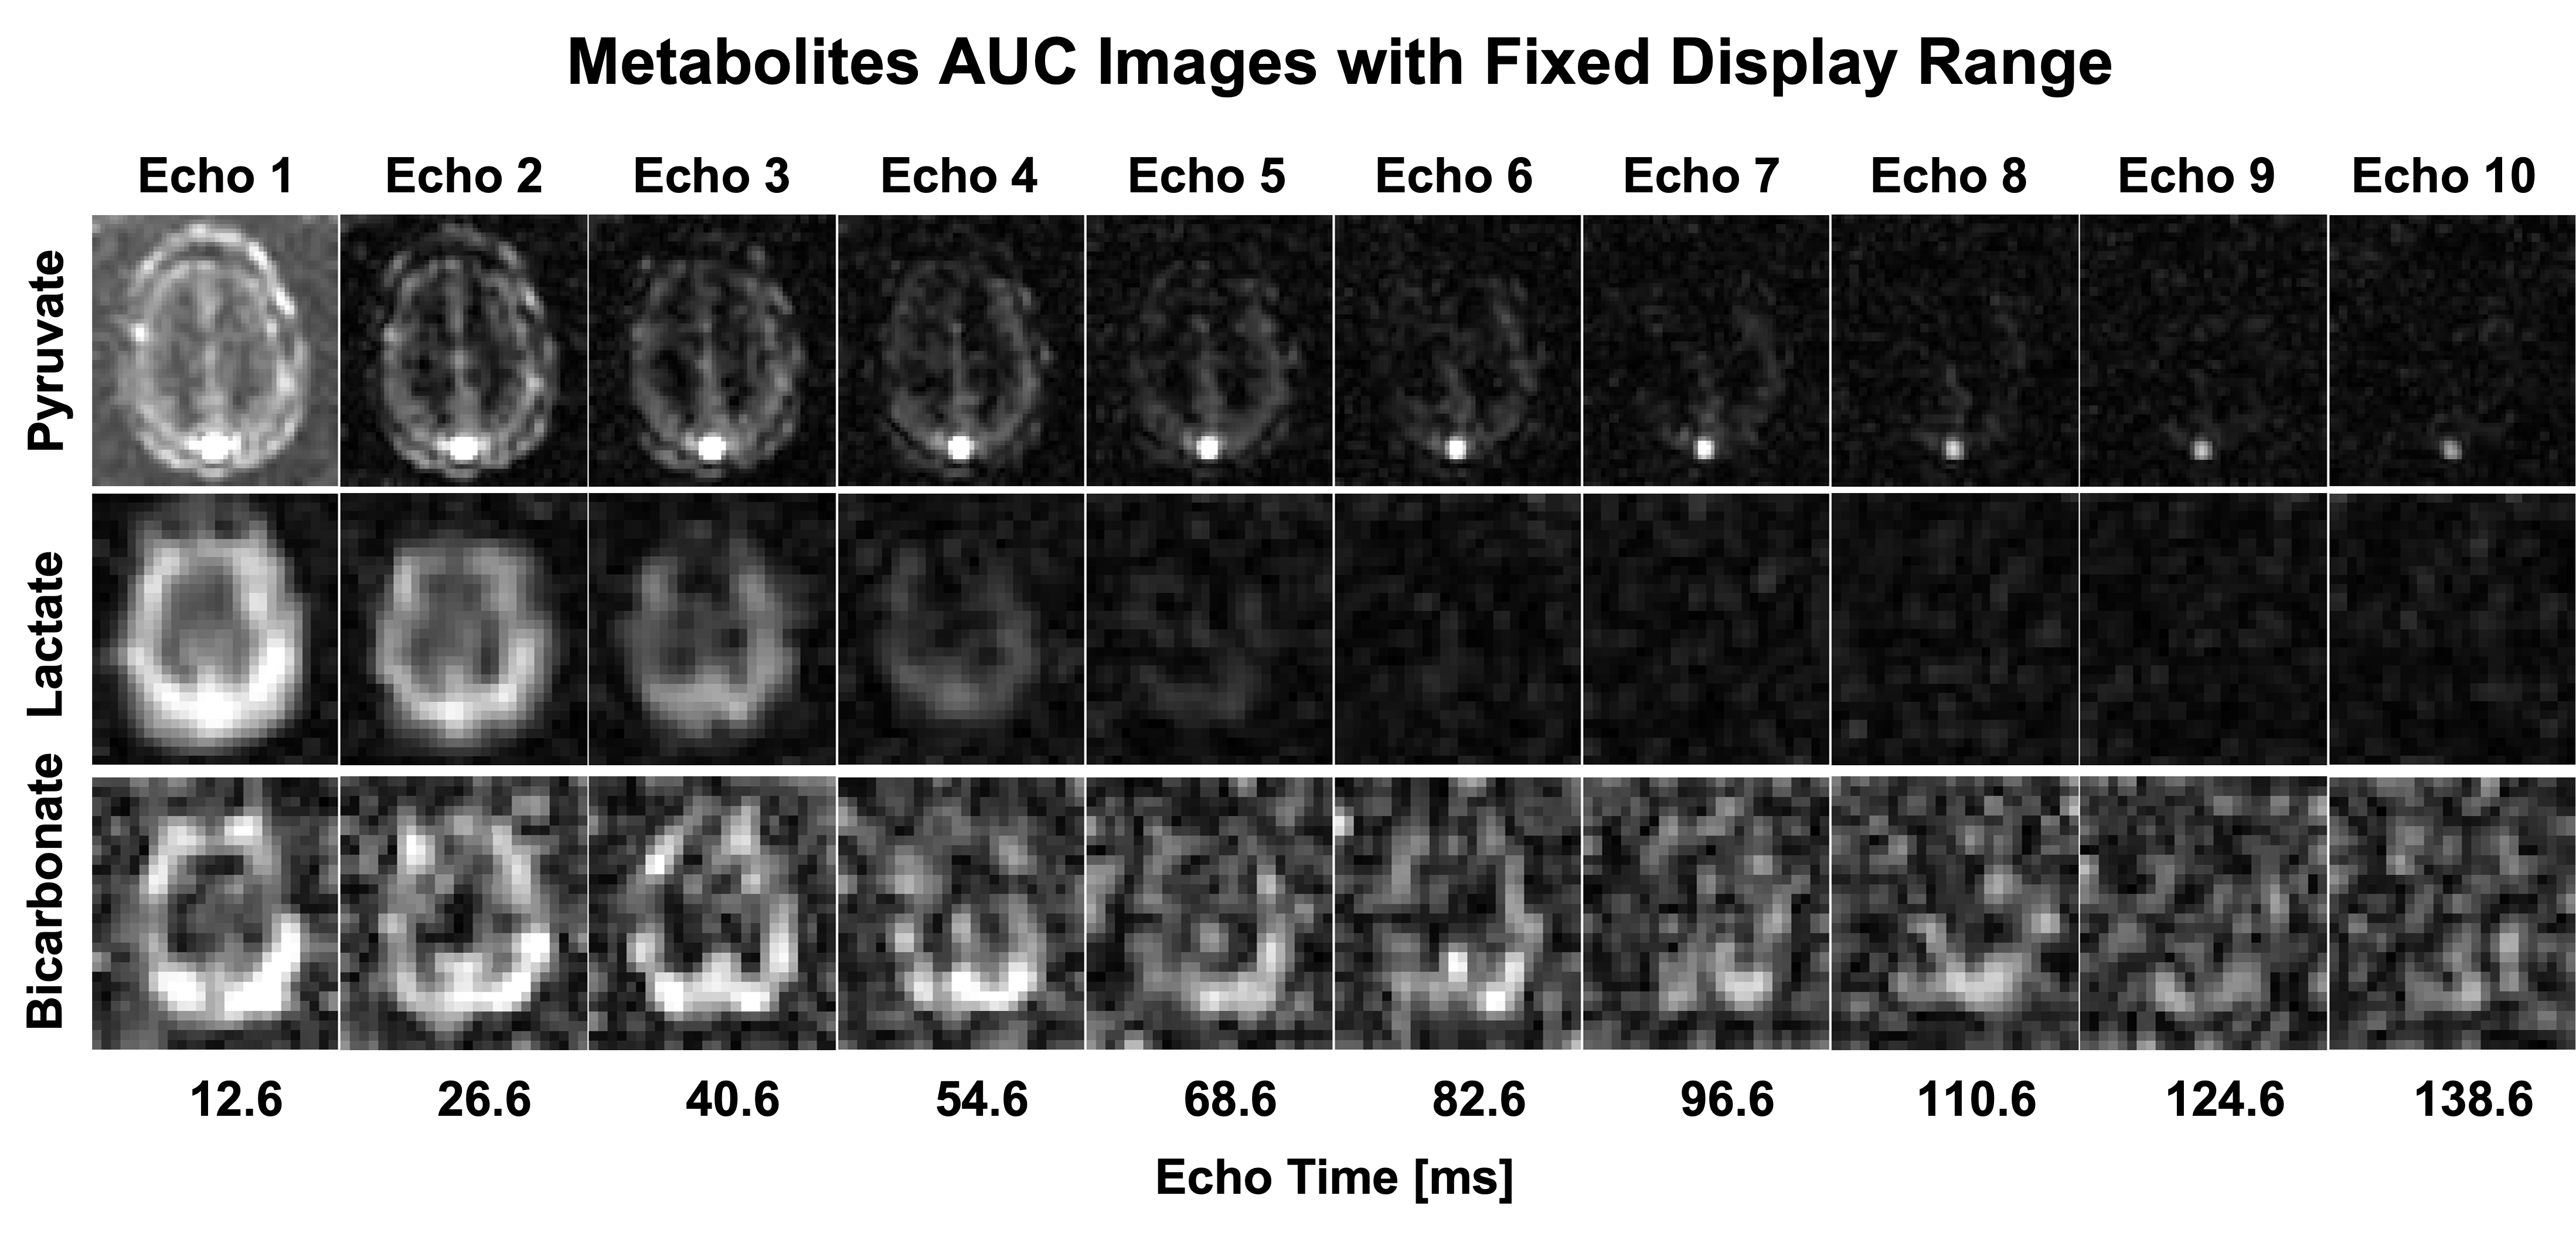
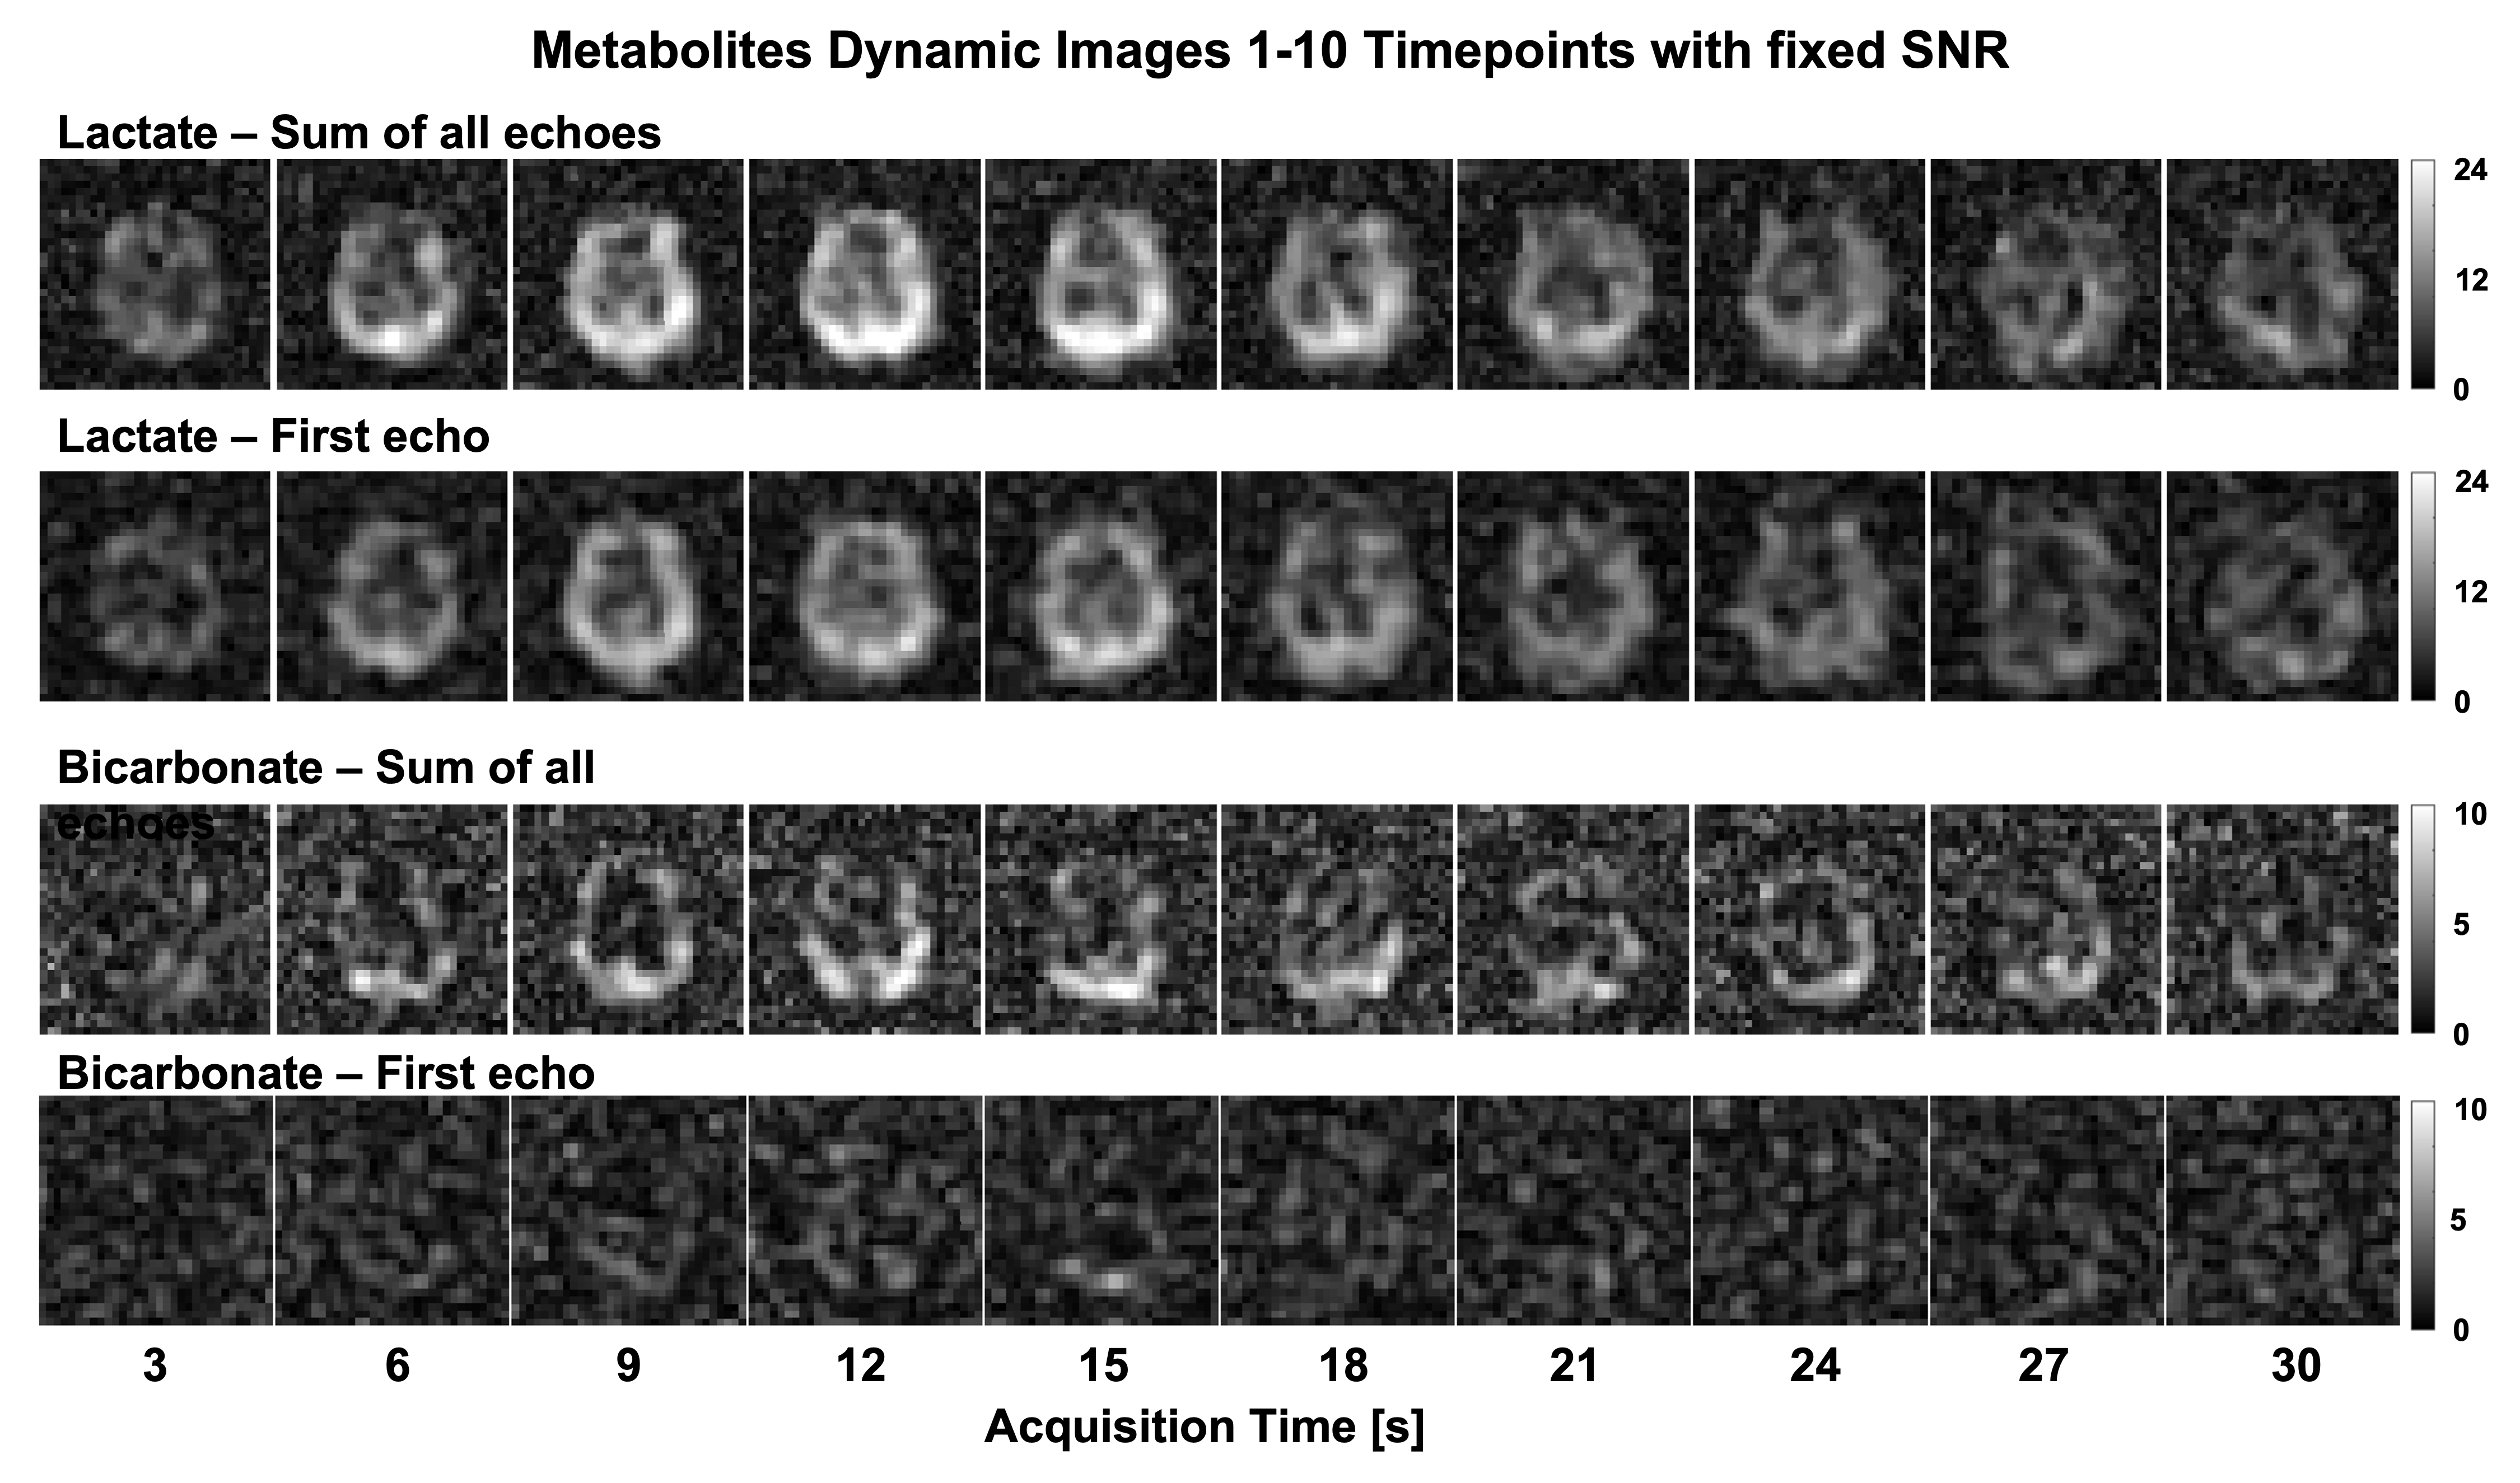
Figure 2 shows area-under-curve (AUC) echo images for each metabolite in the brain. Lactate exhibited the fastest decay, indicating the shortest T2* value (grey matter (GM): 30.1±5.9ms; white matter (WM): 33.8±7.6ms). Because of B0 inhomogeneity, the signal decays faster in the prefrontal cortex. Bicarbonate images had lower SNR but the T2* over the whole brain was well-fit by the mono-exponential decay model and was much longer than lactate (109.5±12.8ms). Figure 3 shows the improvement in image quality when summing all echoes with signal above the noise floor, providing a 1.28±0.23 and 1.44±0.28-fold gain in SNR for lactate and bicarbonate, respectively. Figures 4 and 5 show the dynamic T2* curves of pyruvate and lactate in human studies. In Fig. 4, the lactate T2* in both GM and WM are constant in the first ten timepoints, which matches the T2* values fitted on the lactate AUC images. However, the pyruvate T2* values were variable in sinus vein, GM and WM. Due to the spiral PSF and partial volume effects, the T2* at the first timepoint in the sinus may be affected by the GM signal. However, after the bolus arrives, the pyruvate T2* for all three regions was substantially reduced after the peak signal.Figure 5 shows the pyruvate and lactate T2* through the first 10 timepoints (30s) in the two RCC patients. Both metabolites displayed the same general trends as in the brain – the lactate T2* is constant through time in both the tumor and contralateral healthy kidney, whereas the pyruvate T2* decreases during the acquisition. Interestingly, the lactate T2* measured in the kidneys, tumor, and brain were all similar, whereas the pyruvate T2* was much longer in the kidneys and varied throughout the acquisition. The similar lactate T2* values may reflect the dominant influence of J-coupling, since [1-13C]lactate has higher JCH-coupling constants and its lineshape is greatly affected by decoupling10,11. Pyruvate is not dominated by JCH-coupling, so the variation in pyruvate T2* during the acquisition and across organs may be indicative of extravasation from the vasculature to the extravascular/extracellular space or uptake into the cell.
Conclusion
This work describes dynamic T2* measurements for HP [1-13C]pyruvate and metabolites in a healthy human brain volunteer and two RCC patients. The T2* of pyruvate is shown to vary during the acquisition, whereas the T2* of lactate and bicarbonate is constant through time. Future studies will work to increase the sample size to confirm these results. These relaxometry measurements will be useful for future sequence optimization, can be used to further improve SNR by summing echoes, and can be included in kinetic modeling to harmonize data across sites and reduce errors in quantification at long echo times.Acknowledgements
This work was supported by NIH grants U01EB026412, P41EB013598 and R01CA249099.References
1. Ardenkjaer-Larsen JH, rn Fridlund B, Gram A, et al. Increase in Signal-to-Noise Ratio of >10,000 Times in Liquid-State NMR. Vol 2.; 2003. www.pnas.orgcgidoi10.1073pnas.1733835100
2. Wang ZJ, Ohliger MA, Larson PEZ, et al. Hyperpolarized 13C MRI: State of the art and future directions. Radiology. 2019;291(2):273-284. doi:10.1148/radiol.2019182391
3. Bøgh N, Gordon JW, Hansen ESS, et al. Initial Experience on Hyperpolarized [1-13 C]Pyruvate MRI Multicenter Reproducibility—Are Multicenter Trials Feasible? Tomography. 2022;8(2):585-595. doi:10.3390/tomography8020048
4. Bankson JA, Walker CM, Ramirez MS, et al. Kinetic modeling and constrained reconstruction of hyperpolarized [1-13C]-pyruvate offers improved metabolic imaging of tumors. Cancer Res. 2015;75(22):4708-4717. doi:10.1158/0008-5472.CAN-15-0171
5. Larson PEZ, Chen HY, Gordon JW, et al. Investigation of analysis methods for hyperpolarized 13C-pyruvate metabolic MRI in prostate cancer patients. NMR Biomed. 2018;31(11). doi:10.1002/nbm.3997
6. Ma J, Chen J, Reed GD, et al. Cardiac T2∗ measurement of hyperpolarized 13C metabolites using metabolite-selective multi-echo spiral imaging. Magn Reson Med. 2021;86(3):1494-1504. doi:10.1002/mrm.28796
7. Tang S, Milshteyn E, Reed G, et al. A regional bolus tracking and real-time B1 calibration method for hyperpolarized 13C MRI. Magn Reson Med. 2019;81(2):839-851. doi:10.1002/mrm.27391
8. Jackson JI, Meyer CH, Nishimura DG, Macovski A. Selection of a Convolution Function for Fourier Inversion Using Gridding. IEEE Trans Med Imaging. 1991;10(3):473-478. doi:10.1109/42.97598
9. Miller AJ, Joseph PM. THE USE OF POWER IMAGES TO PERFORM QUANTITATIVE ANALYSIS ON LOW SNR MR IMAGES.; 1993.
10. Marjańska M, Iltis I, Shestov AA, et al. In vivo 13C spectroscopy in the rat brain using hyperpolarized [1-13C]pyruvate and [2-13C]pyruvate. Journal of Magnetic Resonance. 2010;206(2):210-218. doi:10.1016/j.jmr.2010.07.006
11. Chen AP, Tropp J, Hurd RE, et al. In vivo hyperpolarized 13C MR spectroscopic imaging with 1H decoupling. Journal of Magnetic Resonance. 2009;197(1):100-106. doi:10.1016/j.jmr.2008.12.004
Figures