0666
Development of a novel sequence for T2* quantification of slow-relaxing water pools in the brain
Seonyeong Shin*1,2, Ana-Maria Oros-Peusquens*1, Seong Dae Yun1, Ezequiel Farrher1, and N. Jon Shah1,2,3,4,5
1Institute of Neuroscience and Medicine 4, INM-4, Forschungszentrum Jülich, Jülich, Germany, 2RWTH Aachen University, Aachen, Germany, 3Institute of Neuroscience and Medicine 11, INM-11, JARA, Forschungszentrum Jülich, Jülich, Germany, 4JARA - BRAIN - Translational Medicine, Aachen, Germany, 5Department of Neurology, RWTH Aachen University, Aachen, Germany
1Institute of Neuroscience and Medicine 4, INM-4, Forschungszentrum Jülich, Jülich, Germany, 2RWTH Aachen University, Aachen, Germany, 3Institute of Neuroscience and Medicine 11, INM-11, JARA, Forschungszentrum Jülich, Jülich, Germany, 4JARA - BRAIN - Translational Medicine, Aachen, Germany, 5Department of Neurology, RWTH Aachen University, Aachen, Germany
Synopsis
Keywords: Quantitative Imaging, Relaxometry, Glympathics, CSF
T2* relaxation in the brain covers a broad range of values, which can be grouped in three, roughly logarithmically spaced, intervals (short, intermediate, very long). Using a multi-echo GRE sequence to quantify T2* is time-efficient for brain parenchyma, but accurate quantification of slow-relaxing water pools, such as CSF, lengthens the acquisition time. In this work, we propose a novel sequence (ES-QUTE) that combines multi-echo acquisition with echo shifting techniques to effectively quantify the whole range of T2* relaxation times in the brain without increasing the scan time. In addition, ES-QUTE simultaneously characterises fast diffusion.Introduction
Accurate mapping of CSF T2* relaxation has not yet been significantly exploited in vivo, especially with respect to its relevance to the glymphatic system1. Only scarce, but promising, results are available regarding quantitative T1, T2 and diffusion properties in CSF2-5. In this study, we propose a new multi-echo gradient echo (GRE) sequence, named Echo-Shifted Quantitative T2* imagE (ES-QUTE), for the acquisition of long TE images and for the T2* quantification of CSF and brain tissues without increasing the scan time. It is further shown that the sequence can provide simultaneous diffusion information for slow-relaxing, fast-diffusing water pools, such as those relevant to glymphatics.Methods
Figure 1 depicts schematic diagrams of the conventional multi-echo GRE (i.e., QUTE6,7) and the proposed ES-QUTE sequences. ES-QUTE combines multi-echo GRE with an echo-shifting technique. In contrast to previously proposed echo-shifting approaches8,9, additional gradients are not immediately provided after the radiofrequency (RF) pulse. The first additional gradient (-A') is applied following the acquisition of p echoes. The dephased spins are rephased by the second additional gradient (+2A') and the first additional gradient in the subsequent sub-TR interval, thereby generating q echoes at long TEs. As a result, ES-QUTE produces T2*-weighted images acquired at both short and long TE.To validate the proposed sequence, QUTE and ES-QUTE were compared for phantom and in vivo experiments (imaging parameters given in Table 1). Experiments were carried out on a 3T MR scanner (PRISMA, Siemens Healthineers, Erlangen, Germany) using the 20-channel head/neck coil. Flow compensation gradients were introduced along the slice-select and readout directions. In vivo, readout-resolved FID navigator echoes were acquired every 16 echoes to correct the field variation caused by physiological fluctuations10. For ES-QUTE, the additional (echo-shifting) gradients were applied along the slice-select direction, with the area of the first additional gradient set to 1.25 times that of the slice selection gradient. Half of the acquired echoes were shifted (32 out of 64 in the present data set, including navigator echoes).
Quantification of T2* relaxation time was performed using a mono-exponential decay with Rician noise correction11. Since echo-shifting gradients also produce diffusion weighting, an additional term was included in the fit model for the shifted echoes: $$s(TE)=\left\{\begin{array}{c}M_0\exp\left(-TE/T2^*\right)\quad\text{for unshifted echoes}\\M_0\exp\left(-TE/T2^*\right)\exp(-b \cdot D)=M_0^{\prime}\exp\left(-TE/T2^*\right)\quad\text{for shifted echoes}\end{array}\right.$$ where s(TE) is the acquired signal, M0 is the signal intensity at zero TE, b describes the diffusion weighting from the additional gradients and D is the diffusivity. The factor exp(-b∙D) is a dimensionless number and was taken into account in the fit by replacing M0 with M0'.
Results
Figures 2 and 3 display different TE images and the T2* maps obtained from QUTE and ES-QUTE. Even at very late echoes, the phantom images are devoid of significant artefacts (Fig. 2). Field variations from physiological fluctuations, which give rise to image artefacts in GRE sequences, were corrected using the multiple navigator echoes, fully restoring image quality (Fig. 3). The T2* maps of ES-QUTE were visually similar to those of QUTE in both phantom and in vivo images. Nevertheless, the calculated T2* values in each phantom ROI had a lower standard deviation for ES-QUTE, especially for longer T2* relaxation times. Also, in vivo values showed subtle differences in the quantitative results provided by the two methods, which can be seen in the histograms of grey matter, white matter, and CSF relaxation times (Fig. 3d). ES-QUTE exhibited a greater proportion of higher T2* values (~ around 300ms) in CSF. Figure 4a shows the signal decay from a voxel containing CSF. The TE range in ES-QUTE follows the signal decaying by a factor of two, compared to ~20% signal reduction in QUTE. Figure 4b shows the image derived from the ratio of M0(QUTE) and M0'(ES-QUTE) compared to the diffusivity map obtained from EPI-DWI. Using the mean value for D(CSF), derived from DWI, the effective diffusion weighting in ES-QUTE was described by b=357s/mm2.Discussion and Conclusions
The multi-step navigator echo correction was found to be important for image quality and accurate T2* quantification with both QUTE and ES-QUTE. For identical acquisition times, ES-QUTE was able to more than double the TE range of QUTE while identically sampling the short and medium T2* decay. The sequences delivered identical results over the common TE interval. The small differences between the two methods for T2* quantification in WM and GM, seen in Fig. 3d, are due to the fact that all echoes (with Rician noise correction11) were included in the fit. Voxel-specific echo-time limitation based on phase information and SNR12 will be applied in the future. Most interestingly, differences in the zero TE signal intensity derived from unshifted and shifted echoes (M0/M0' in Fig. 4) show a pronounced effect in CSF, which can be attributed to the diffusion weighting by echo shifting gradients. This effect can be further modulated by modifying the strength and orientation of the echo-shifting gradients and will be investigated further. Furthermore, distributing the echo-shifted echoes over several TRs should allow for a more accurate diffusion quantification and/or TR reduction.In conclusion, ES-QUTE offers a new tool for the quantitative characterisation of slow-relaxing, fast-diffusing water pools with intriguing applications to the study of brain clearance pathways.
Acknowledgements
This work was supported by the European Union’s Horizon 2020 research and innovation programme under the Marie Sklodowska-Curie grant agreement No 764513.References
[1] Iliff J. J., Wang M., Liao Y., et al. A paravascular pathway facilitates CSF flow through the brain parenchyma and the clearance of interstitial solutes, including amyloid β. Sci. Transl. Med. 4:147ra11. 10.1126/scitranslmed.3003748 (2012)[2] Qin Q. A simple approach for three-dimensional mapping of baseline cerebrospinal fluid volume fraction. Magn Reson Med 65:385–391 (2011)
[3] Spijkerman, J.M., Petersen, E.T., Hendrikse, J. et al. T 2 mapping of cerebrospinal fluid: 3 T versus 7 T. Magn Reson Mater Phy 31, 415–424 (2018). https://doi.org/10.1007/s10334-017-0659-3.
[4] Zaharchuk G, Busse RF, Rosenthal G, et al. Noninvasive oxygen partial pressure measurement of human body fluids in vivo using magnetic resonance imaging. Acad Radiol 2006; 13: 1016– 1024.
[5] Ian F Harrison, Bernard Siow, Aisha B Akilo, et al. Non-invasive imaging of CSF-mediated brain clearance pathways via assessment of perivascular fluid movement with diffusion tensor MRI eLife 7:e34028. https://doi.org/10.7554/eLife.34028 (2018)
[6] Dierkes T, Neeb H, Shah NJ. Distortion correction in echo-planar imaging and quantitative T2* mapping. International Congress Series. 2004;1265:181-185.
[7] Yablonskiy D. Quantitative T2 Contrast with Gradient Echoes. Proc. Intl. Soc. Mag. Reson. Med. 8 (2000).
[8] Ma YJ, Liu W, Zhao X, et al. 3D interslab echo-shifted FLASH sequence for susceptibility weighted imaging. Magn Reson Med. 2016;76(1):222-228. doi:10.1002/mrm.25872.
[9] van Gelderen P, Duyn JH, Ramsey NF, et al. The PRESTO technique for fMRI. Neuroimage. 2012;62(2):676-681. doi:10.1016/j.neuroimage.
[10] Wen J, Cross AH, Yablonskiy DA. On the role of physiological fluctuations in quantitative gradient echo MRI: implications for GEPCI, QSM, and SWI. Magn Reson Med. 2015;73(1):195-203. doi:10.1002/mrm.25114.
[11] Sijbers J, den Dekker AJ, Raman E, et al. Parameter estimation from magnitude MR images. Int J Imag Syst Tech, 10, 109-114. (1999)
[12] Oros-Peusquens AM, Loução R, Abbas Z, et al. A Single-Scan, Rapid Whole-Brain Protocol for Quantitative Water Content Mapping With Neurobiological Implications. Front Neurol. 2019;10:1333. Published 2019 Dec 20. doi:10.3389/fneur.2019.01333.
Figures
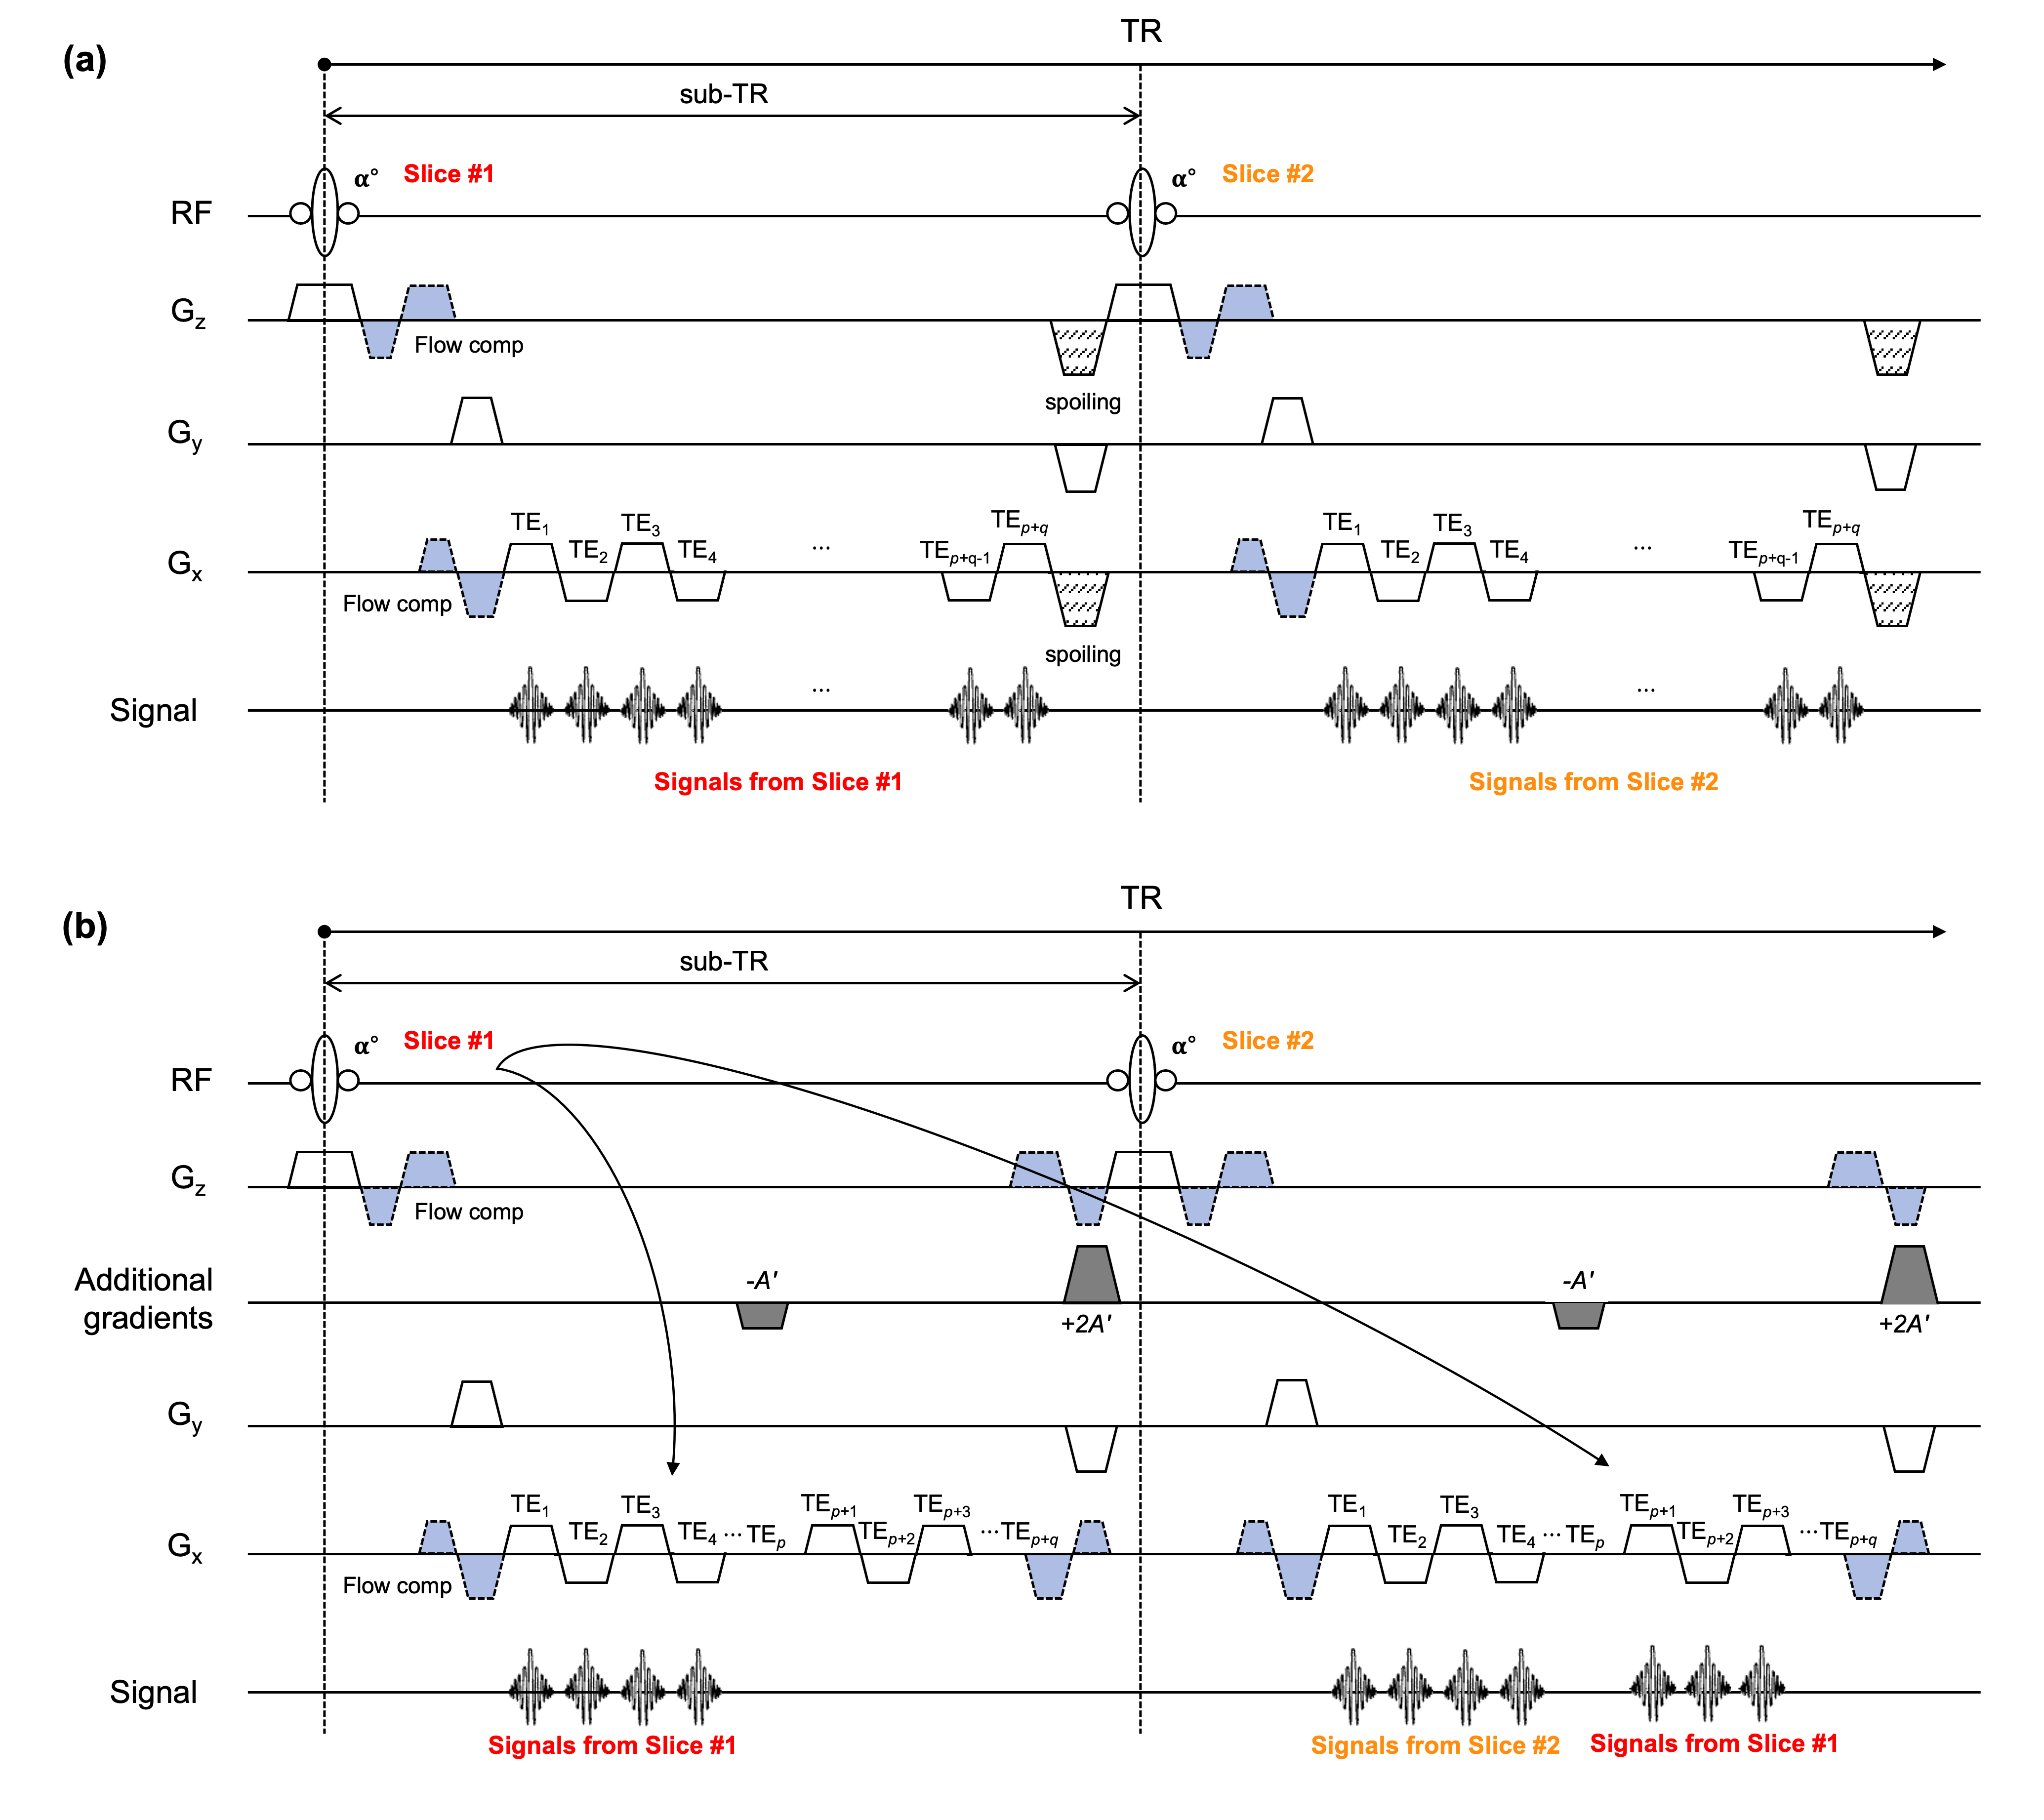
Figure 1. Sequence diagrams of the (a) QUTE and (b) ES-QUTE. The signals excited by n-th RF pulse are collected in the n-th sub-TR interval for the QUTE. Additional gradients are employed in the ES-QUTE to shift part of the echoes to the next sub-TR interval. In one sub-TR, two additional gradients are used with a ratio of areas -1:2. The p echoes are collected as in the conventional multi-echo GRE, and q-shifted echoes are then obtained in the next sub-TR interval. The acquisition of navigator echoes, which requires phase encode unwind and rewind, is not included in this diagram.
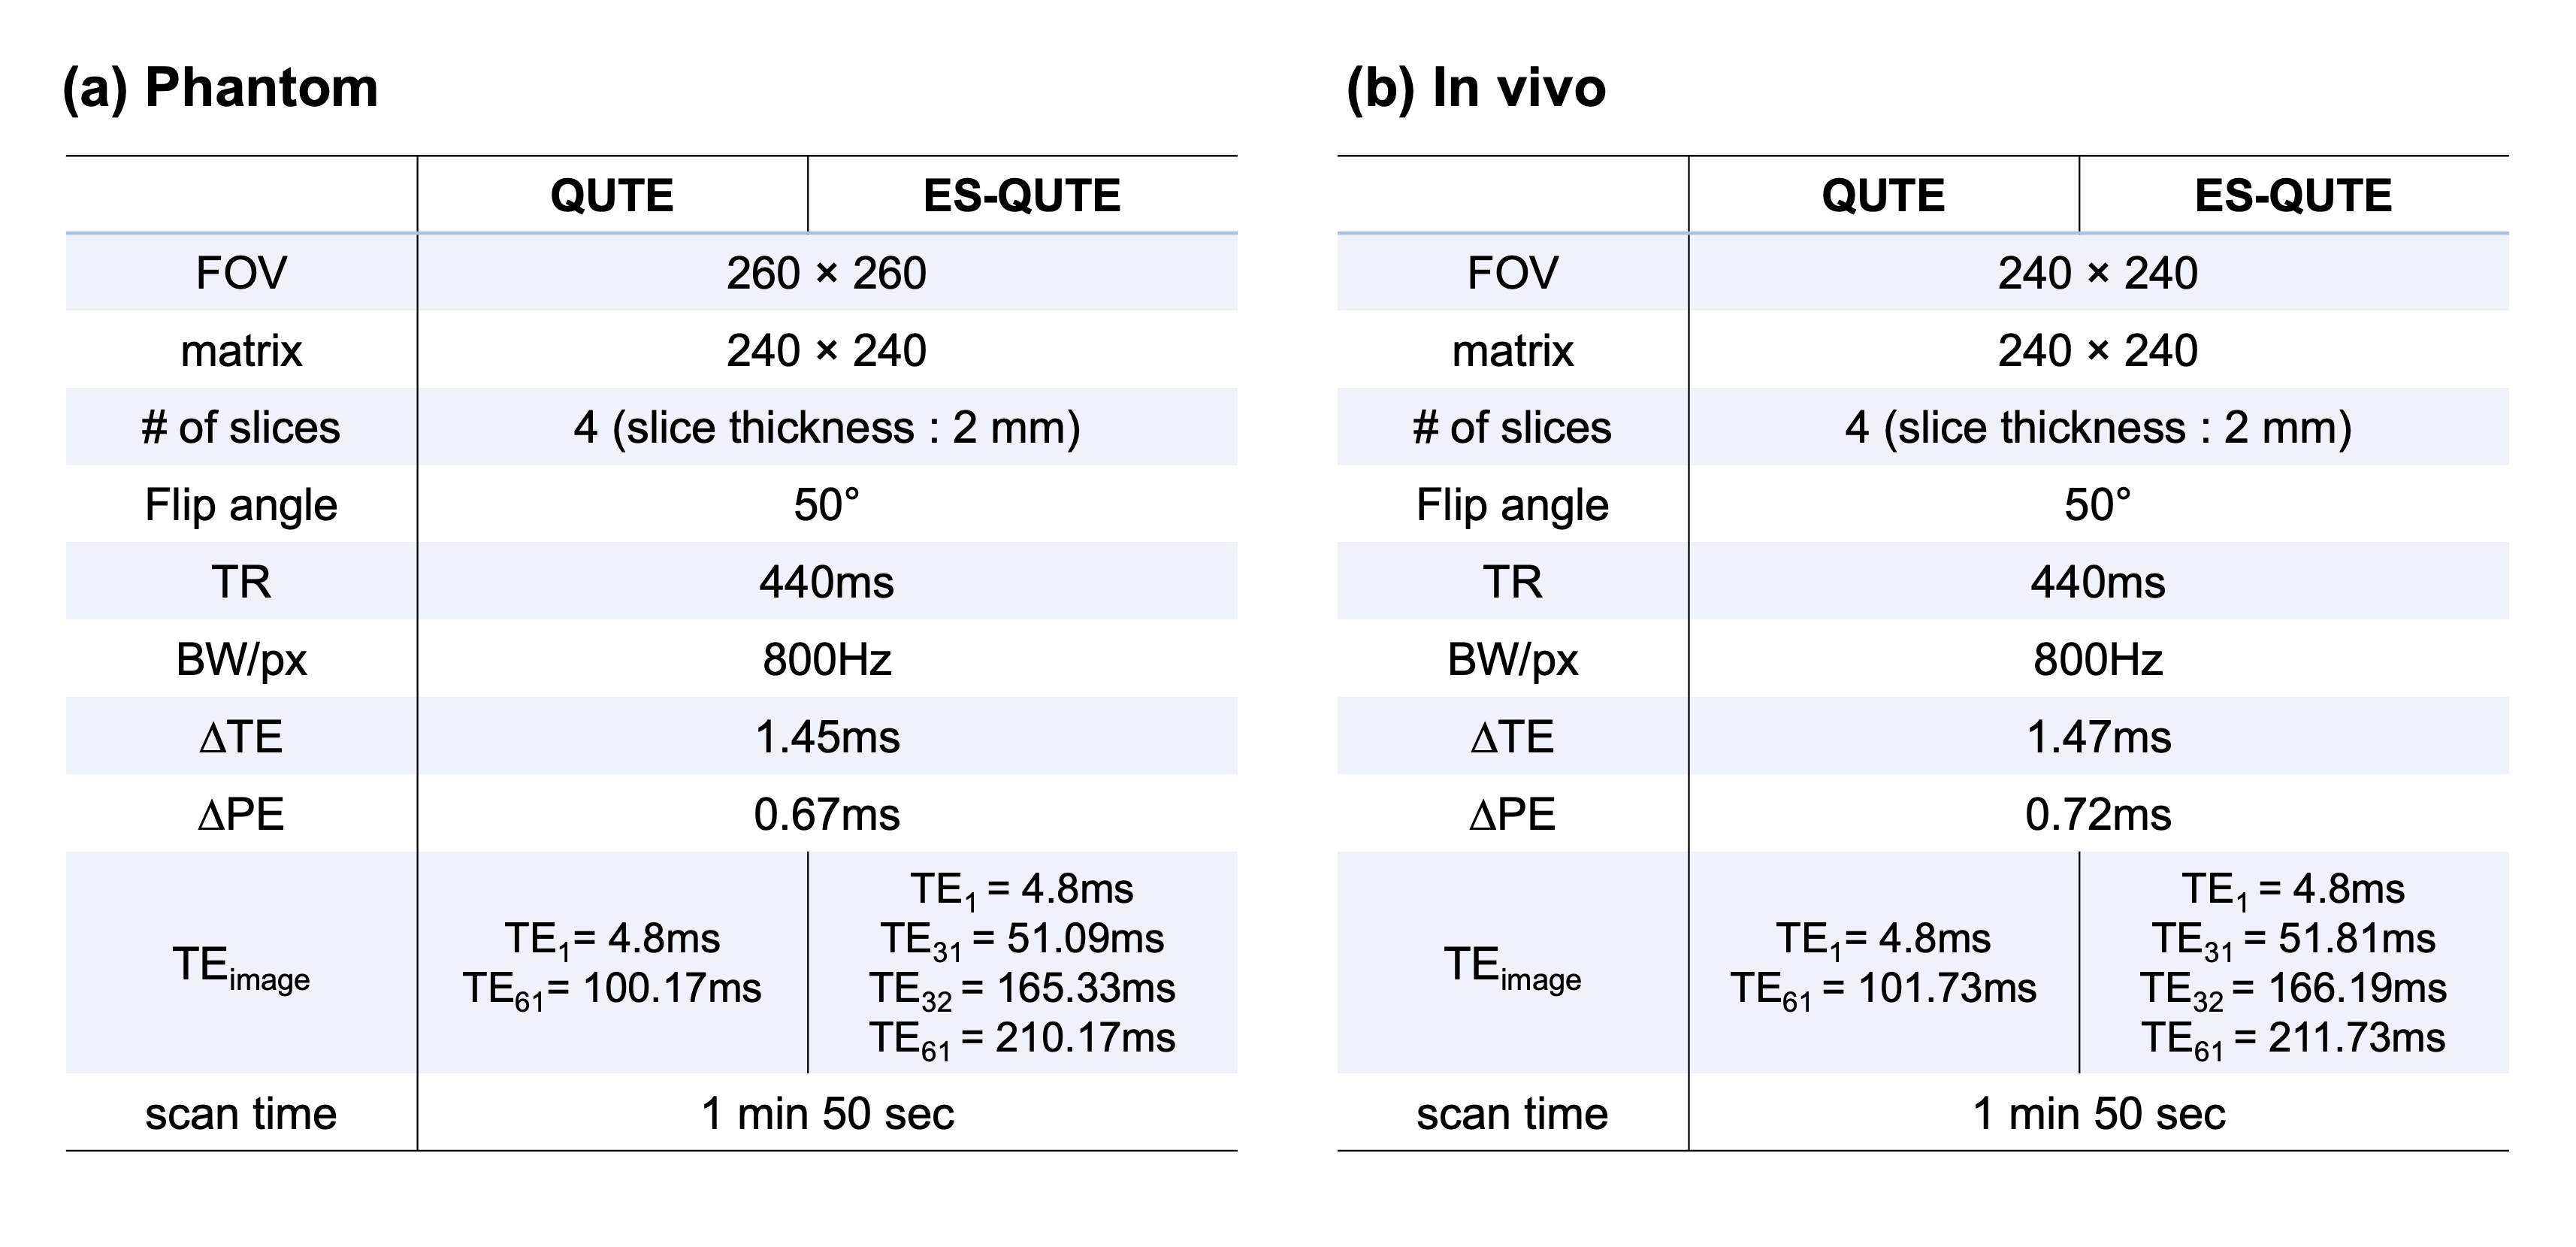
Table 1. Sequence parameters for (a) phantom and (b) in vivo experiments. ∆PE is the time required for applying phase-encoding gradients prior to and following the acquisition of navigator echo. ES-QUTE offers a longer TE range than QUTE under the same imaging condition. To obtain a comparably long TE range, the acquisition time of QUTE must be doubled.
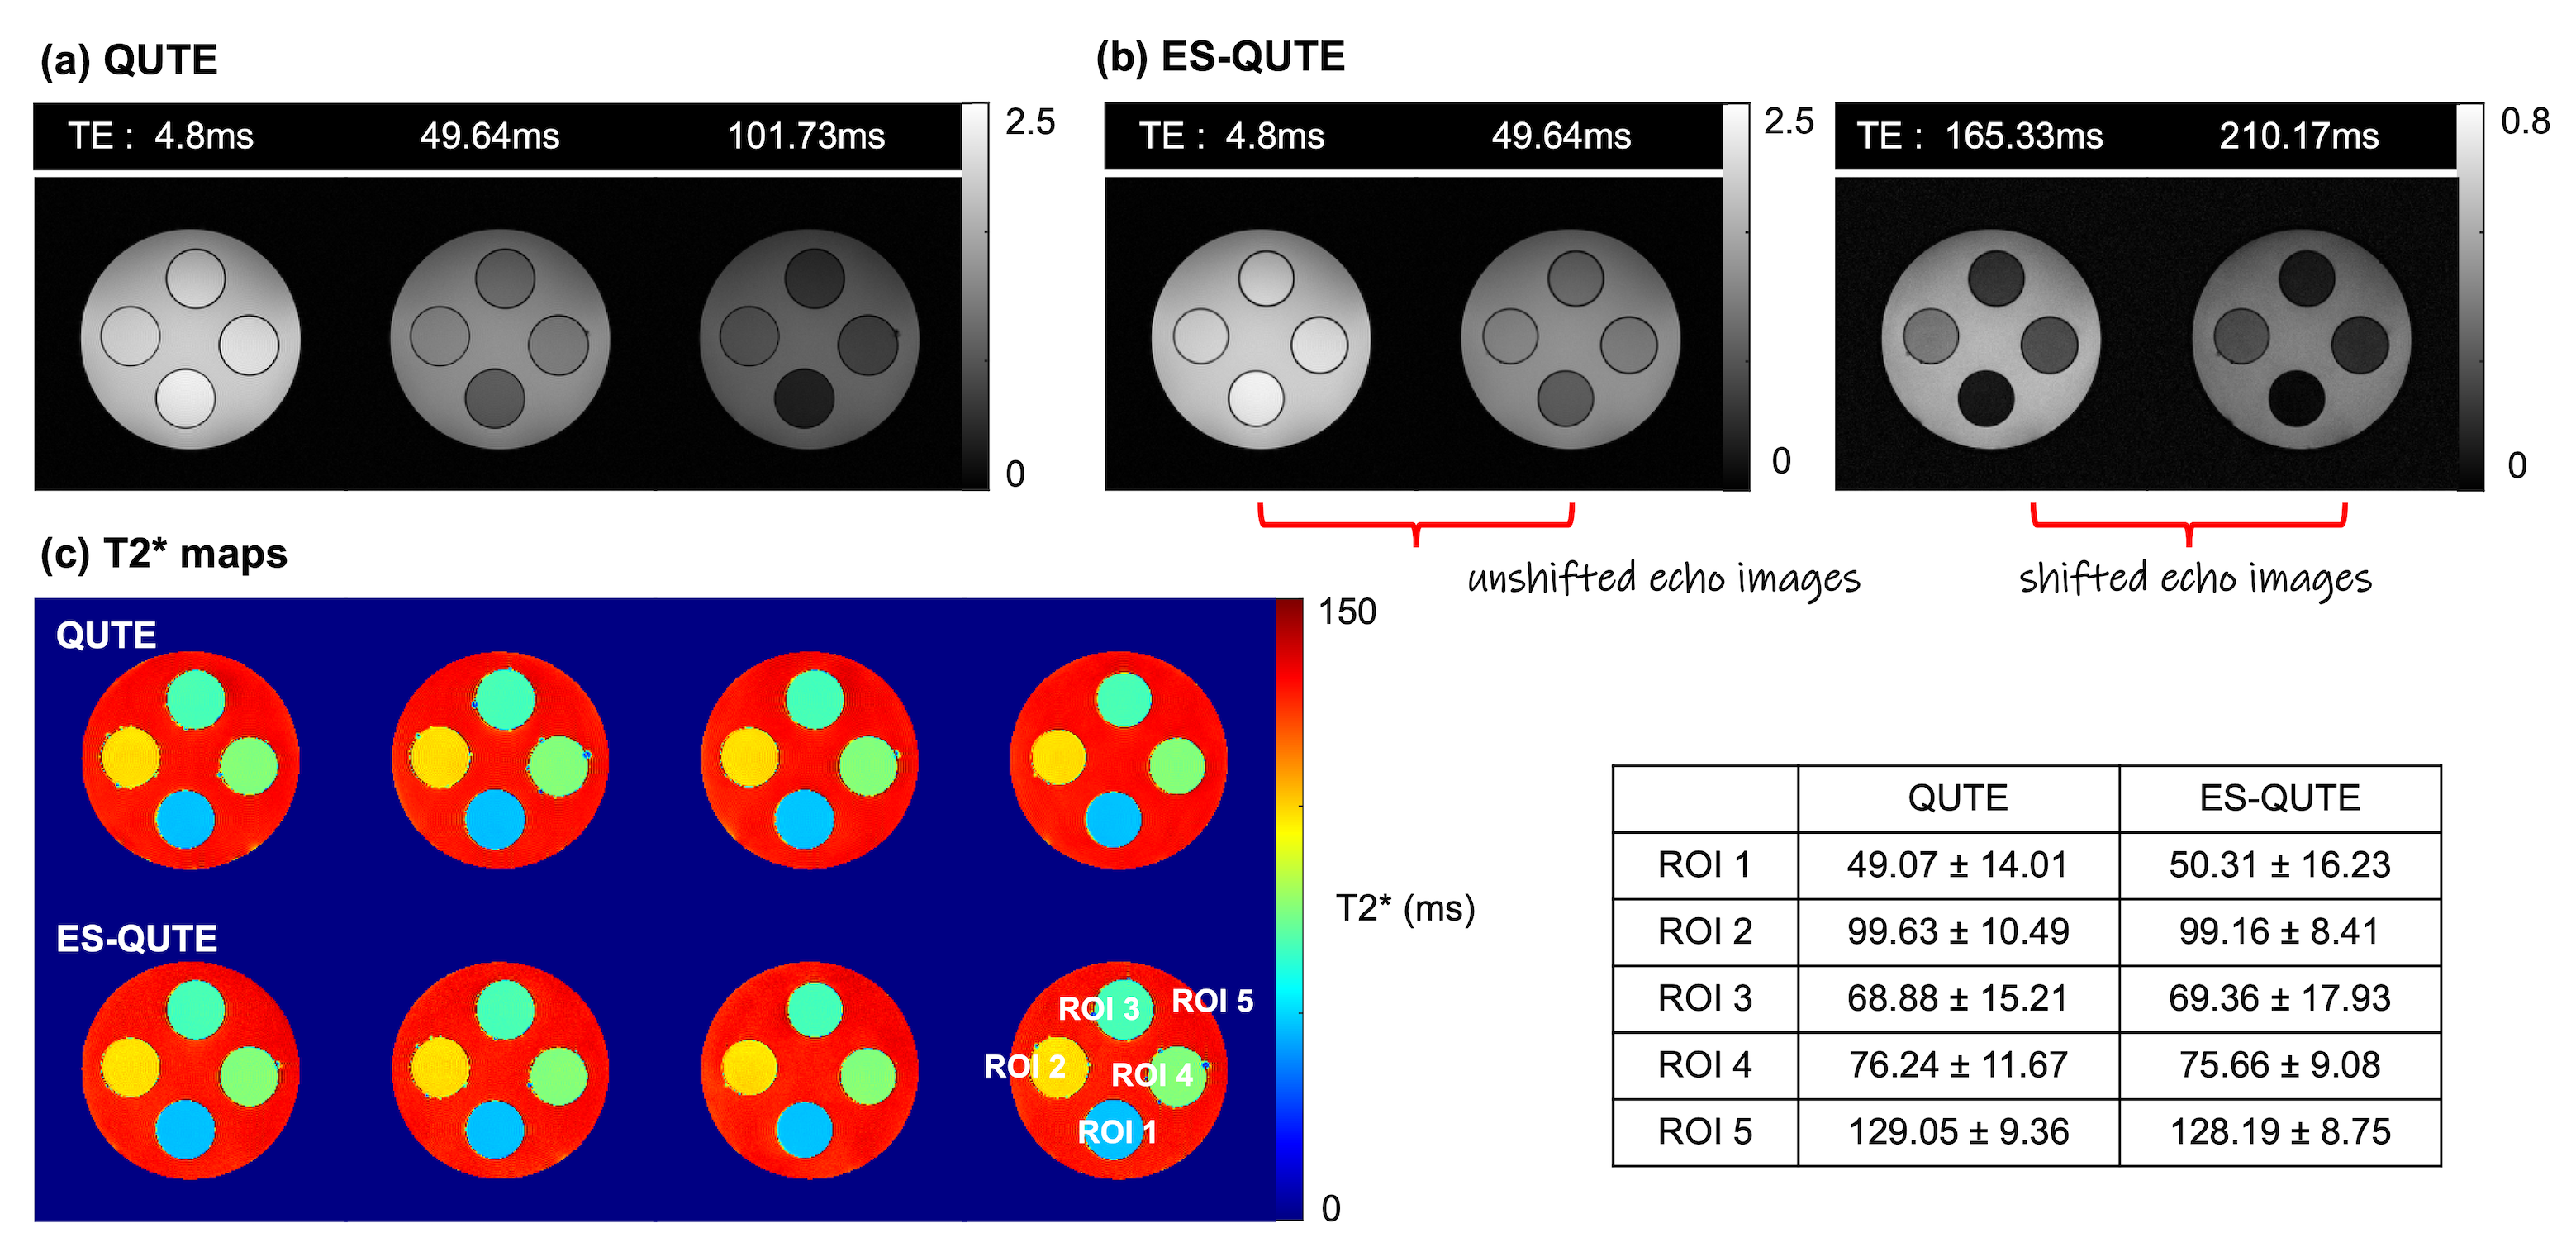
Figure 2. T2* weighted images at different TEs and T2* maps acquired from phantom experiments. In (b), the left two columns show the unshifted echo images, whereas the right two columns depict the shifted echo images. The mean and standard deviations calculated for each ROI are shown next to the T2* maps.
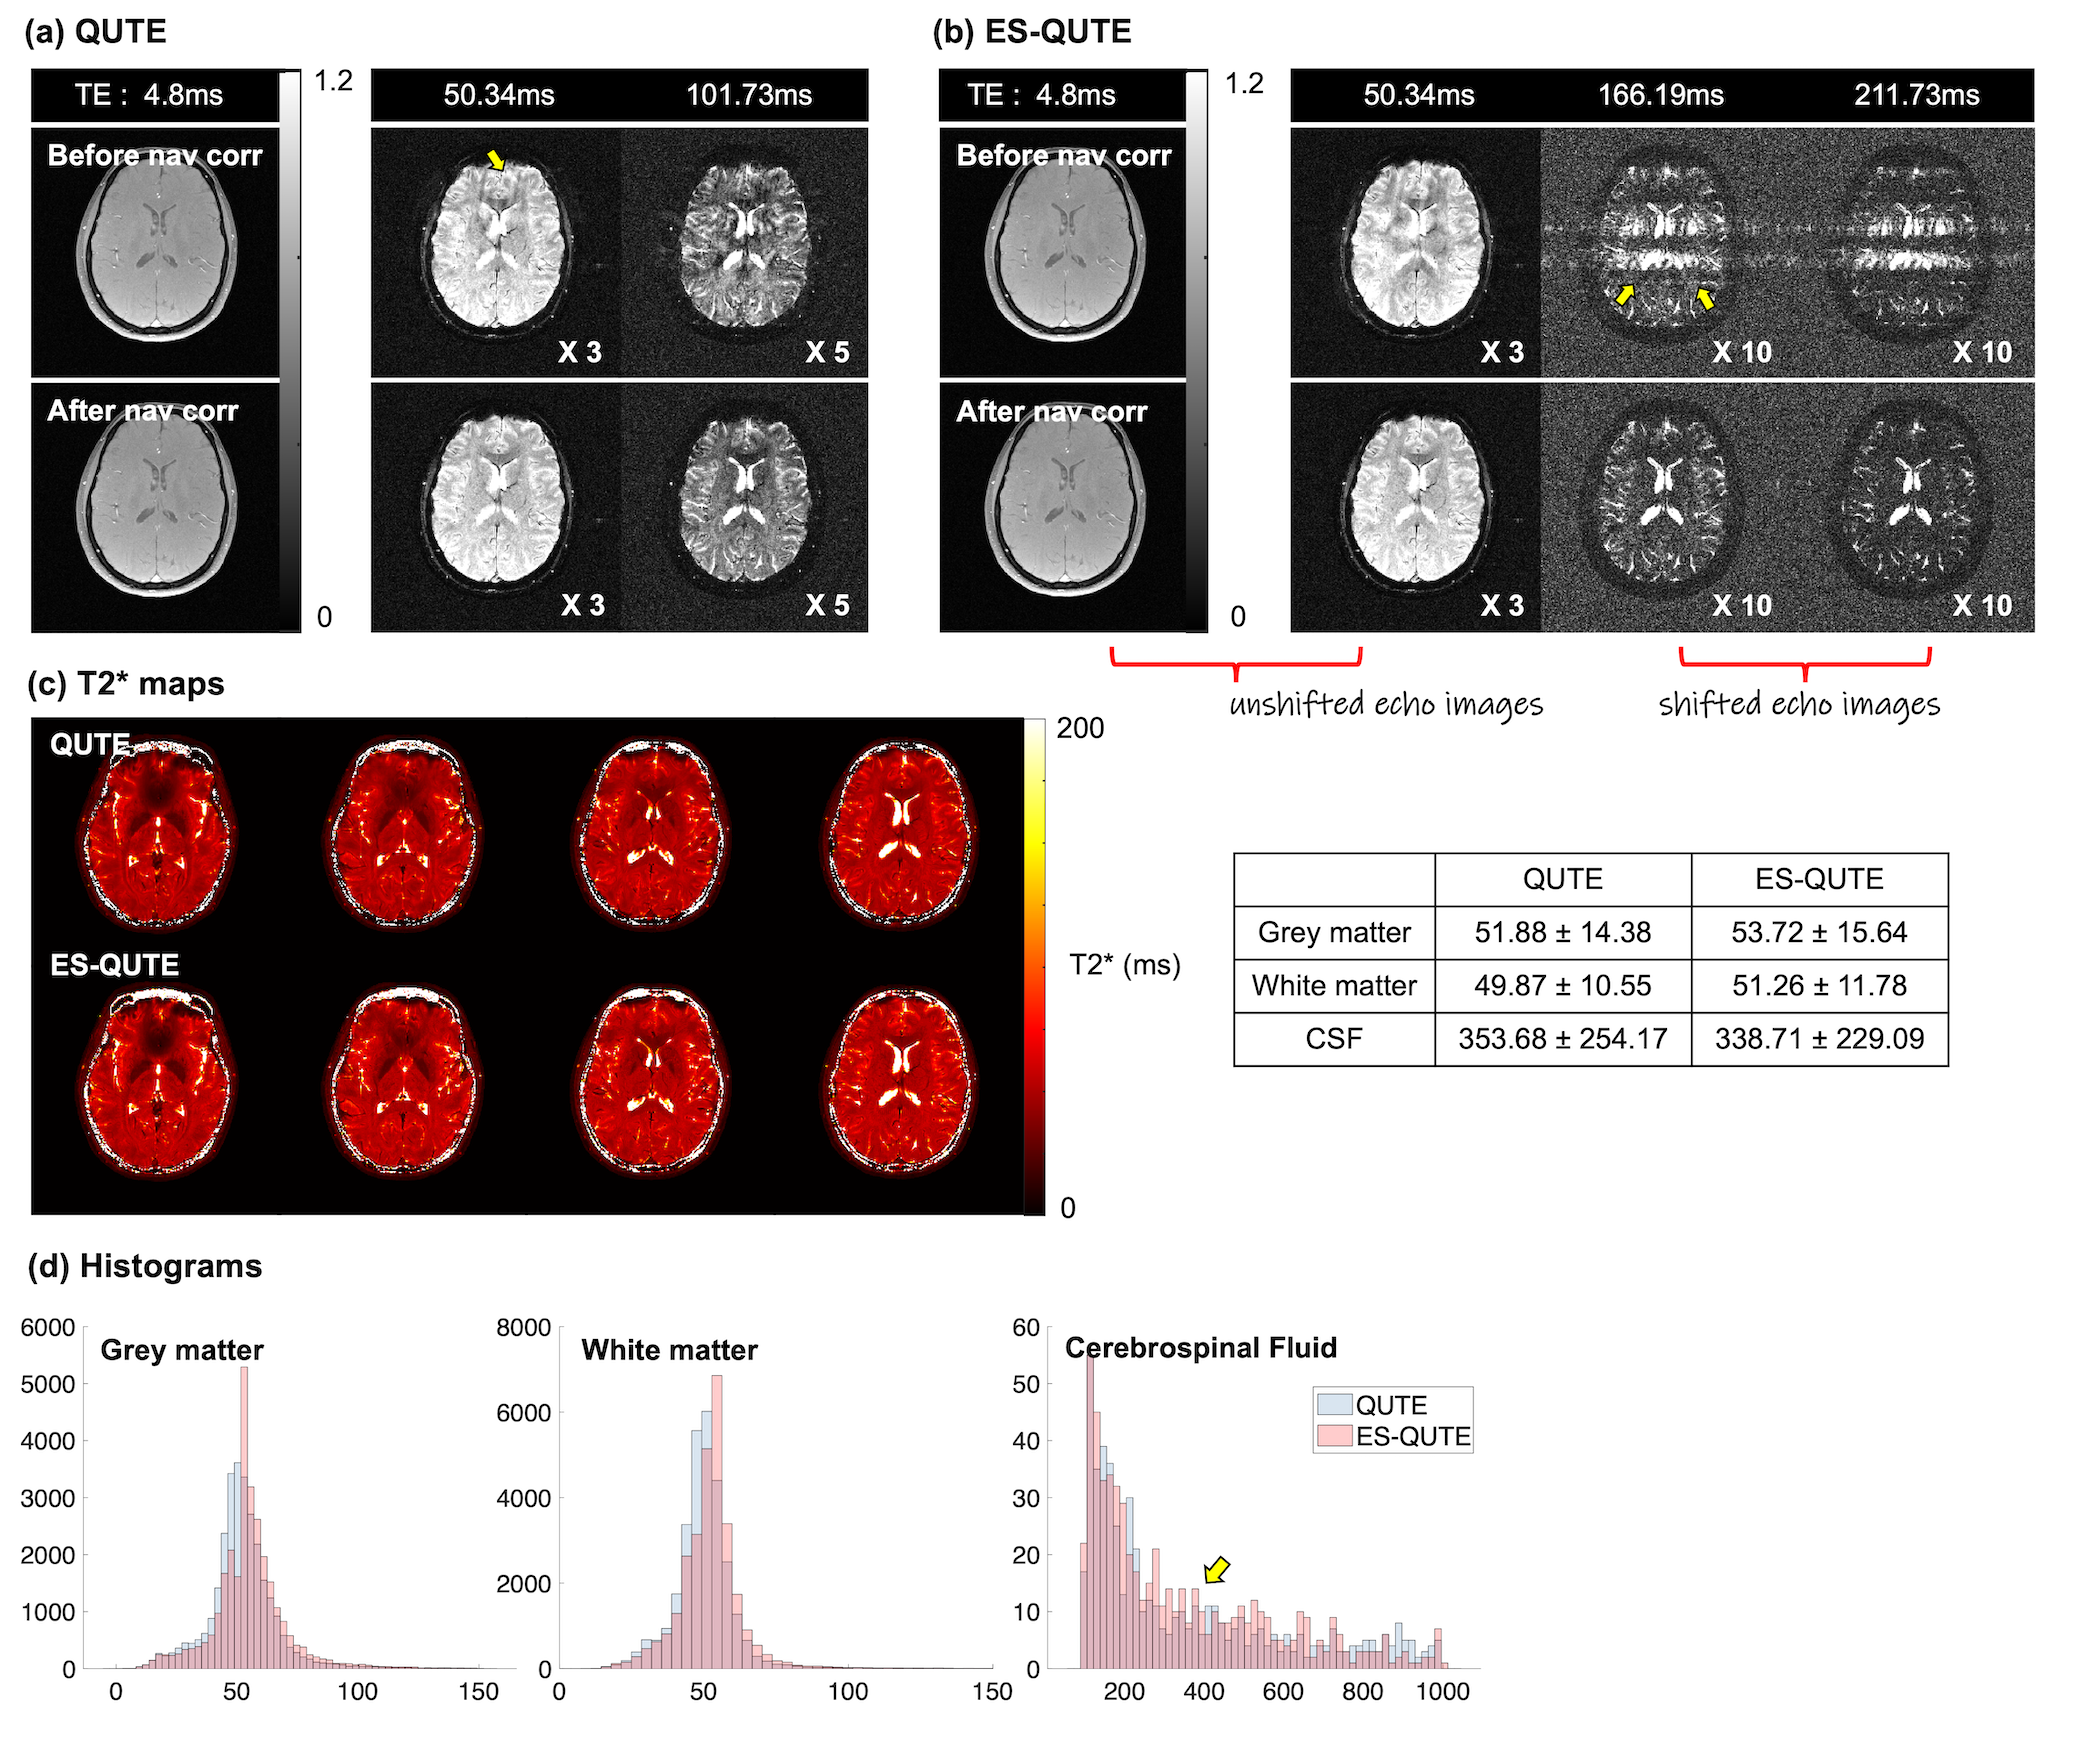
Figure 3. T2* weighted images at different TEs and T2* maps obtained from in vivo experiments. In figures 3a and b, the first and second rows show the images before and after the navigator echo correction, respectively. Histograms of the computed T2* values in grey matter, white matter, and CSF are displayed in figure 3d. The pink and blue colours represent the distribution from QUTE and ES-QUTE, respectively.
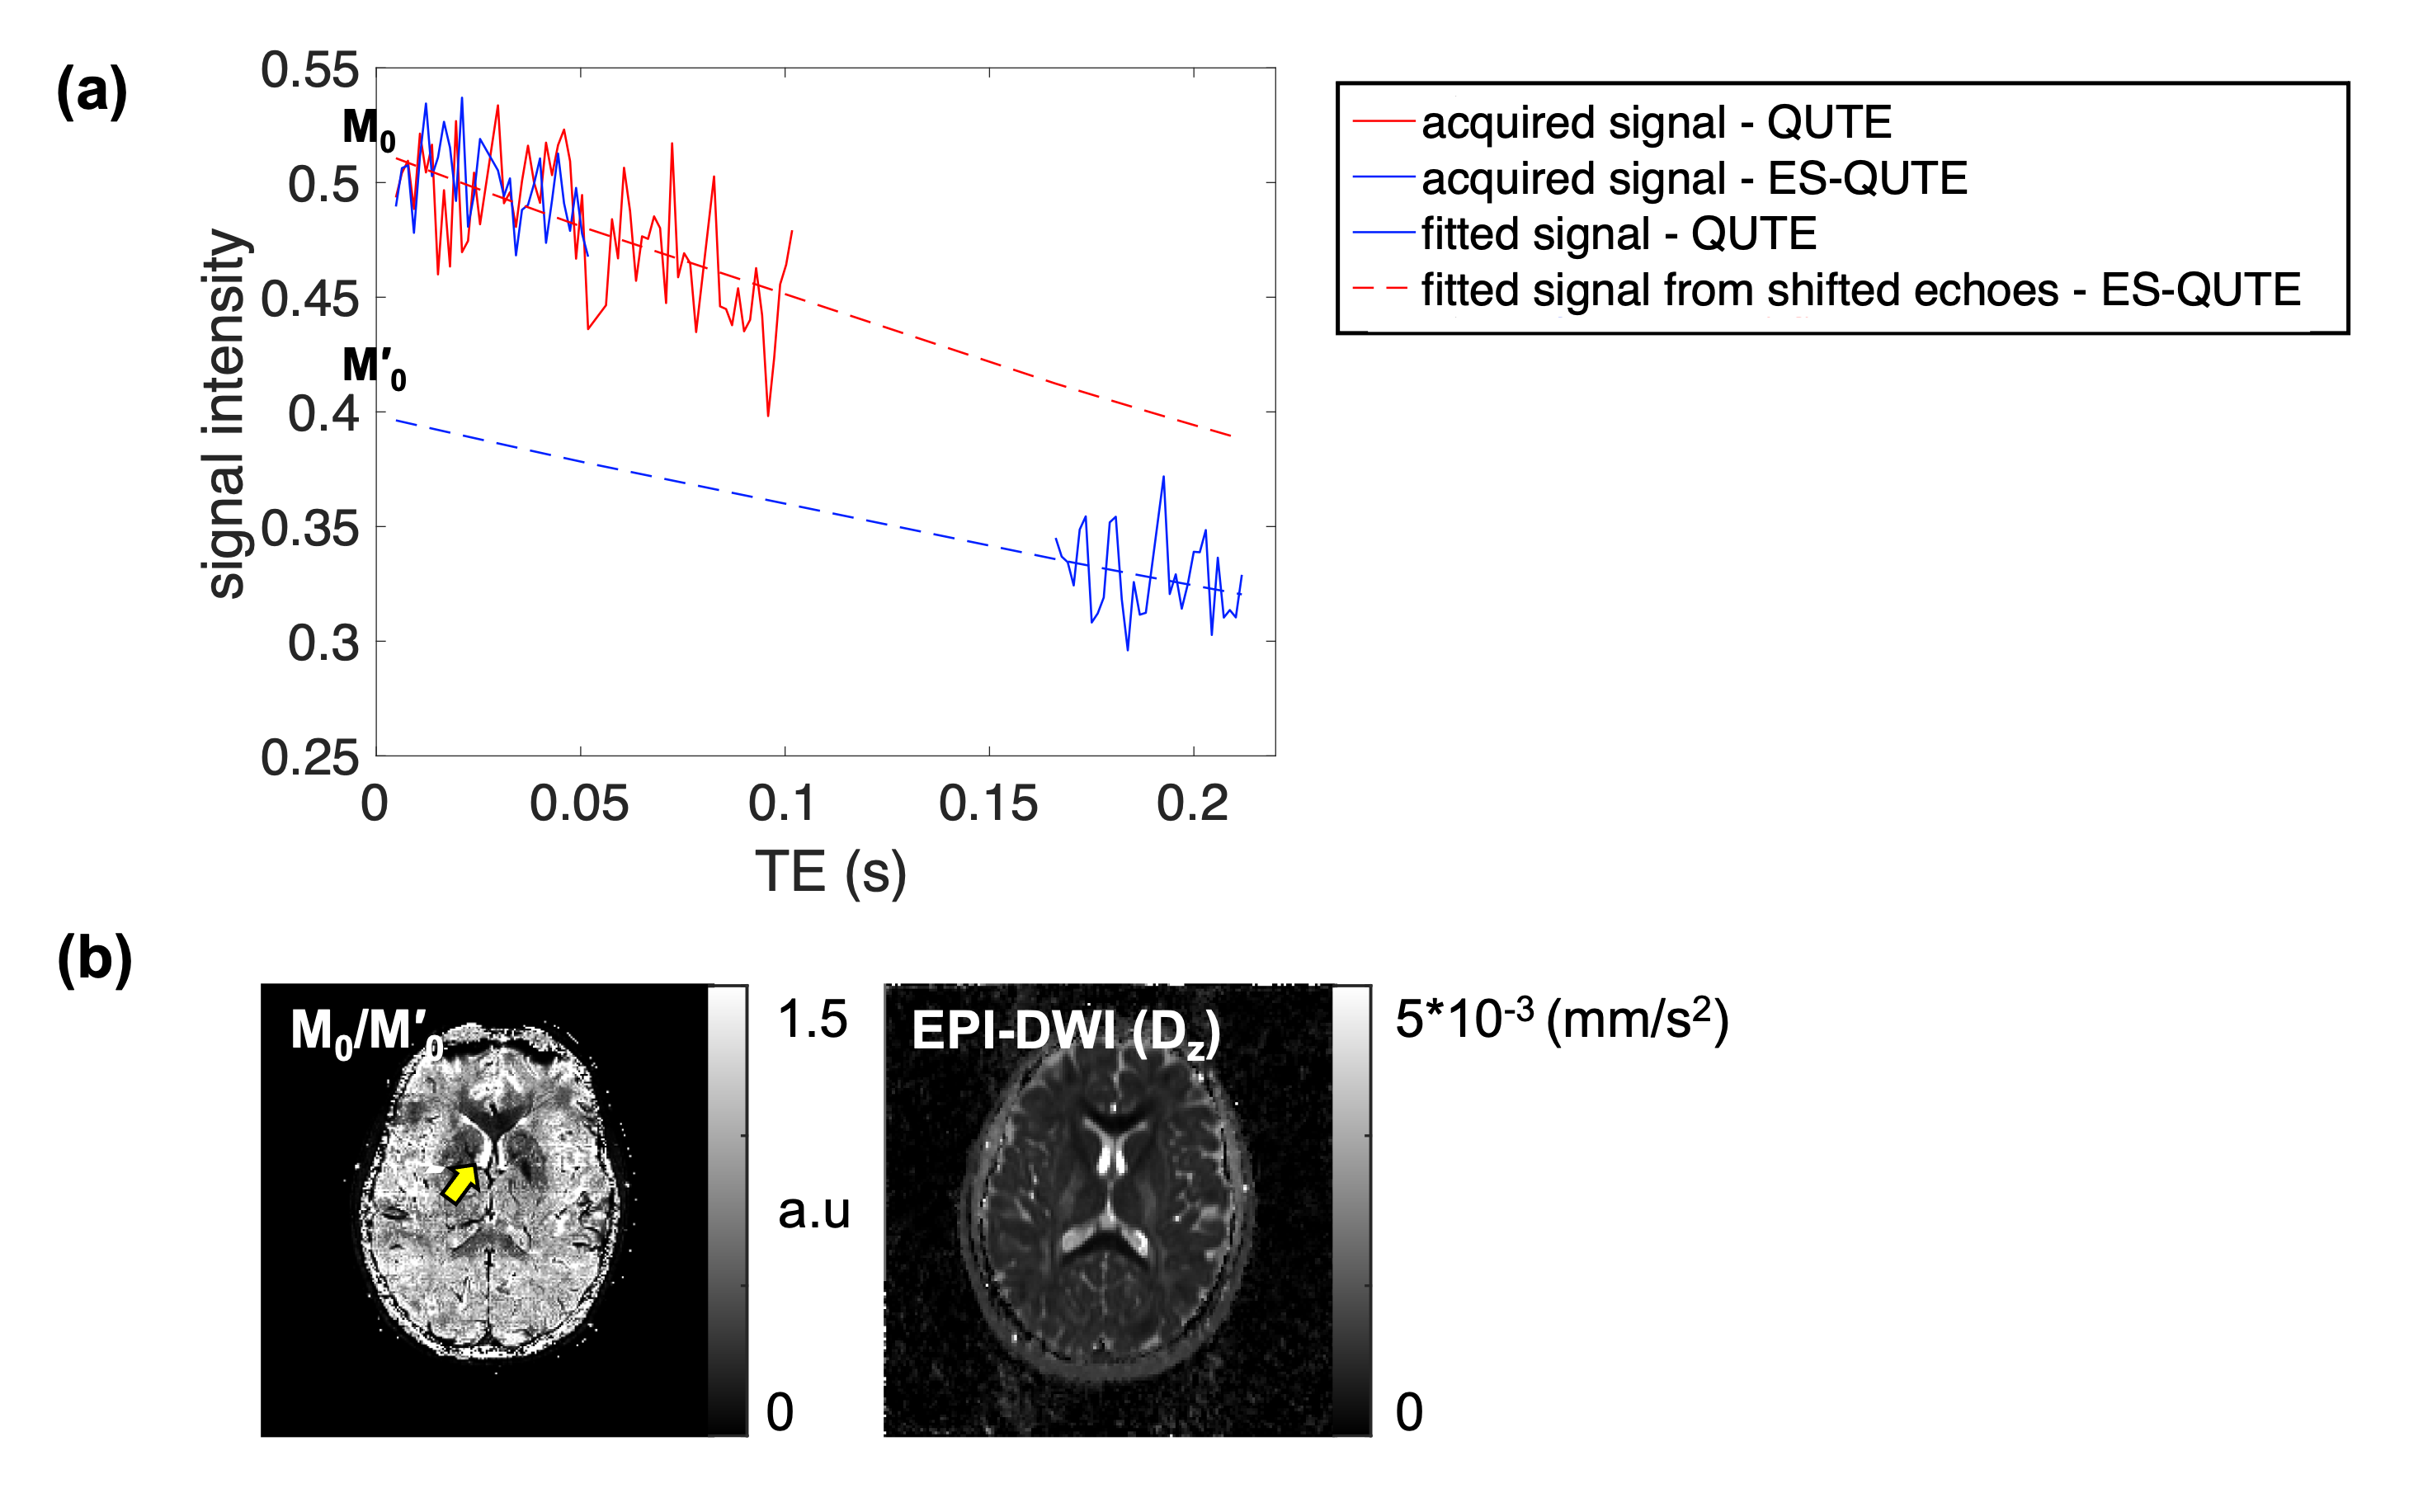
Figure 4. (a) Signal decay from a CSF voxel in the ventricle. The blue and red lines indicate signals from QUTE and ES-QUTE, respectively. The dashed lines represent the fitted signals. (b) Ratio image derived from M0 and M0' on the left and diffusivity map from EPI-DWI on the right. Imaging parameters for EPI-DWI: FOV = 240 × 240mm2, matrix = 160 × 160, slice thickness = 2mm, TR =5000ms, flip angle = 90°, # of slices = 24, TE = 57ms, GRAPPA acceleration factor = 2, Partial Fourier factor = 6/8, and b = 0, 200, 400, 600, 800, and 1000.
DOI: https://doi.org/10.58530/2023/0666