0665
Quantitative 3D DESS T2 mapping with Deep Learning Reconstruction for Magnetic Resonance Neurography1Hospital for Special Surgery, New York, NY, United States
Synopsis
Keywords: Quantitative Imaging, Nerves, Deep Learning
Conventional, quantitative T2 mapping for MR neurography may depict peripheral neuropathy related changes but has insufficient spatial resolution within acceptable acquisition times (<6 min.) to mitigate motion. Alternatively, dual-echo steady-state (DESS) can simultaneously provide high resolution 3D qualitative anatomical data and quantitative T2 maps for characterizing both nerve and muscle within this targeted acquisition window. Analysis of subjects with peripheral neuropathy in the elbow/forearm region showed that DESS-T2 was higher in involved nerves and muscles, and that DL-reconstruction slightly decreased DESS-T2. Additionally, DESS enabled analysis of the magic angle effect, demonstrating a positive correlation between nerve orientation and DESS-T2 values.Introduction
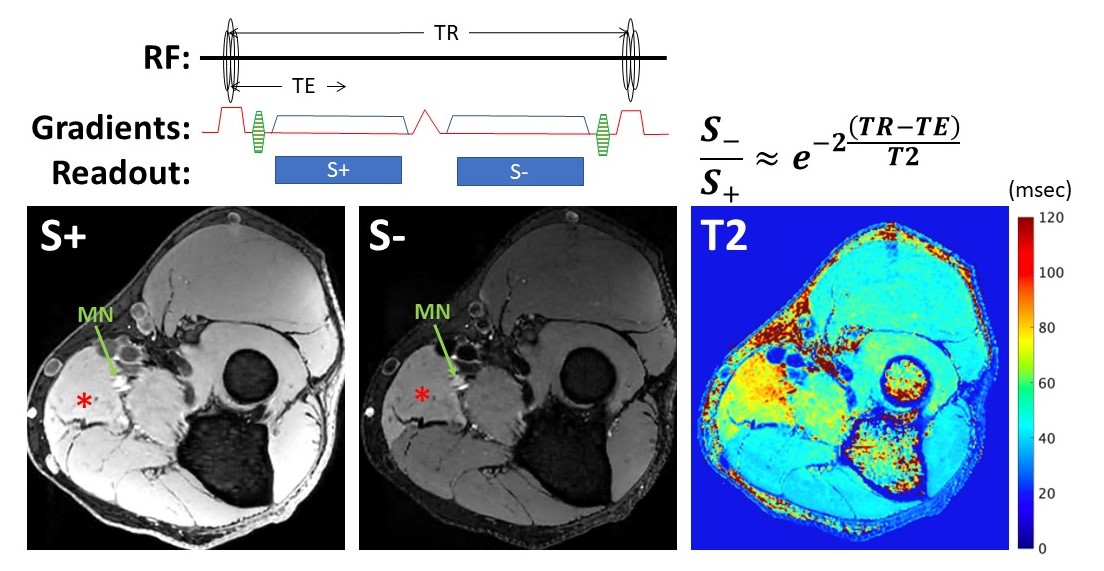
Peripheral neuropathies most commonly result from chronic compression, inflammation or trauma and may lead to muscle denervation if there is axonal injury. MR neurography (MRN) techniques utilize heavily T2-weighted, fat-suppressed sequences to depict peripheral nerve morphology and to highlight pathologically increased T2 signal of both nerve and muscle, the latter if denervated1. T2 mapping can quantify these changes2,3, but conventional methods provide inadequate spatial resolution for resolving nerve fascicular bundles for quantitative purposes. Dual-echo steady-state (DESS)4, sometimes used in 3D MRN, can provide high resolution, T2-weighted, 3D data for morphologic nerve assessment, and can simultaneously generate T2 maps at the same resolution5 (Figure 1). However, bias to DESS-T2 values may result from motion, magic angle effect (in nerves)6 and noise secondary to high spatial resolution acquisitions. Applying deep learning (DL) reconstruction techniques that increase SNR and sharpness can improve peripheral nerve conspicuity7, which in 3D-DESS may improve morphologic and quantitative assessment. This study’s main aims were (1) to evaluate the feasibility of using DESS-T2 maps to differentiate pathologic from normal nerves and muscles and (2) to evaluate the effect of 3D-DL reconstruction methods on DESS-T2 values. We hypothesized that mean T2 would increase in involved nerves and muscles, and that application of a DL-type reconstruction would reduce the DESS-T2 standard deviation without biasing the mean. Secondarily, this work explored if the magic-angle effect also affects DESS-T2 values of peripheral nerves.Methods
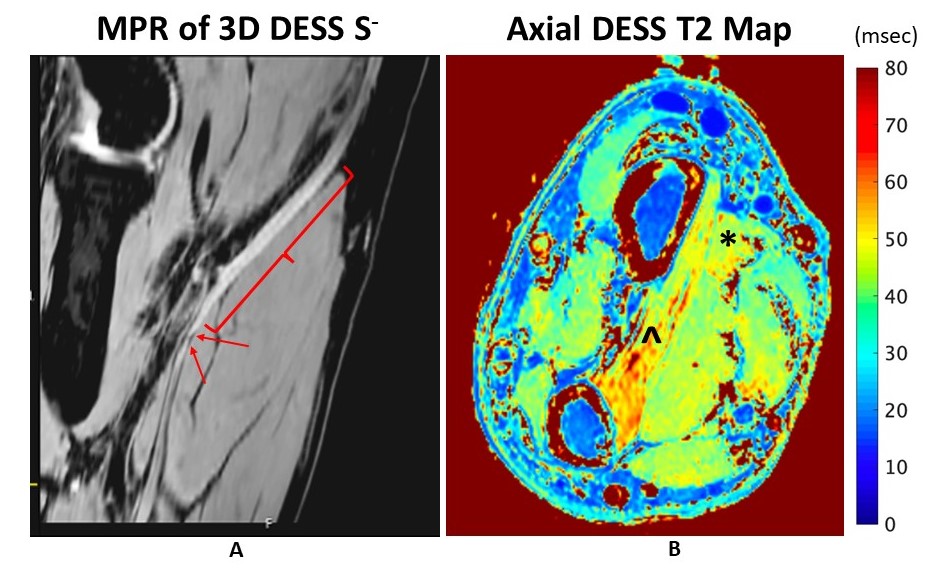
Data from 15 patients undergoing standard, clinical MRN at 3T (Premier, GE Healthcare) to evaluate suspected neuropathy in the elbow or forearm region was retrospectively analyzed under an IRB-approved protocol. The imaging protocol included standard 2D MRN sequences and an additional DESS sequence (3D axial, FOV=9-12cm, 320x320 matrix, 72-90 slices, TR/TE=15/5-10ms, FA=35o, spectral-spatial water excitation, 4-6 min.). The two DESS echoes were separately reconstructed with standard image reconstruction, and with 3D-DL8. DESS-T2 values were computed by assuming T1=1500ms using a dictionary generated with standard DESS equations9.Abnormal nerve appearance (hyperintensity and/or enlargement) was determined (by a board-certified radiologist with MRN experience) in either the ulnar, median, or radial nerves, with resulting denervation in at least one muscle innervated by the involved nerve, manifest as a diffuse edema pattern on MRI. Image segmentation was performed on three image slices of the involved nerve and muscle, and those of an uninvolved nerve and muscle within the same FOV. T2 mean values and standard deviation normalized to the mean were obtained. Statistical analyses were performed using (1) a paired t-test to examine the mean T2 differences between involved and uninvolved nerves and muscles and (2) a paired t-test or Wilcoxon signed-rank test to examine the differences in mean T2 and standard deviation between the standard and DL reconstructions of the same acquired data. All statistical analyses were performed using R (version 4.0.3). A p-value < 0.05 was considered statistically significant. The nerve orientation with respect to B0 was determined by manually obtaining the tangent along a distance of 8mm proximal and distal to the segmented region, before calculating the angle from B0. Linear regressions were performed separately for involved and uninvolved nerves to determine the relationship between calculated angle and DESS-T2.
Results
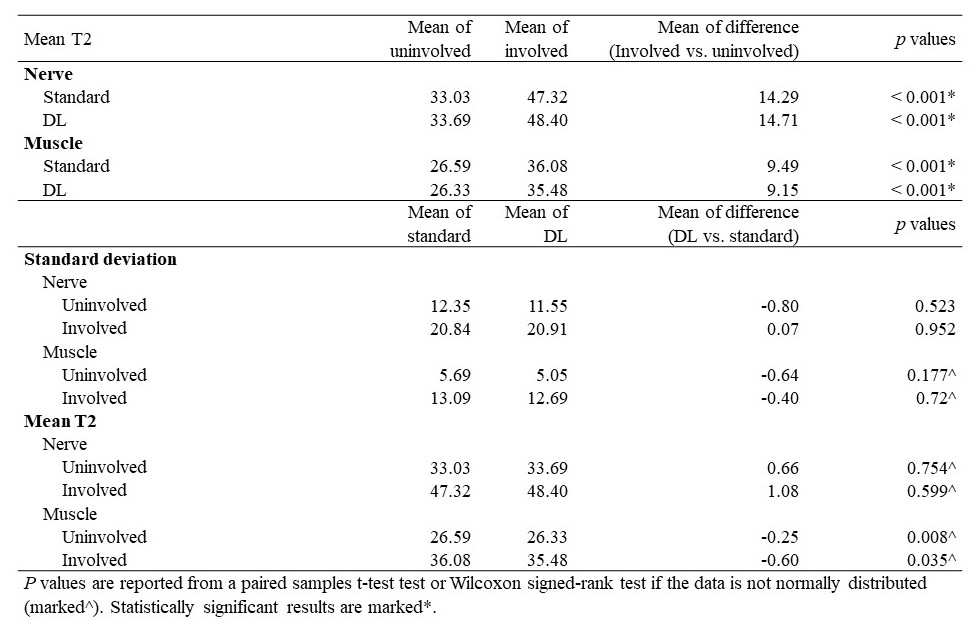
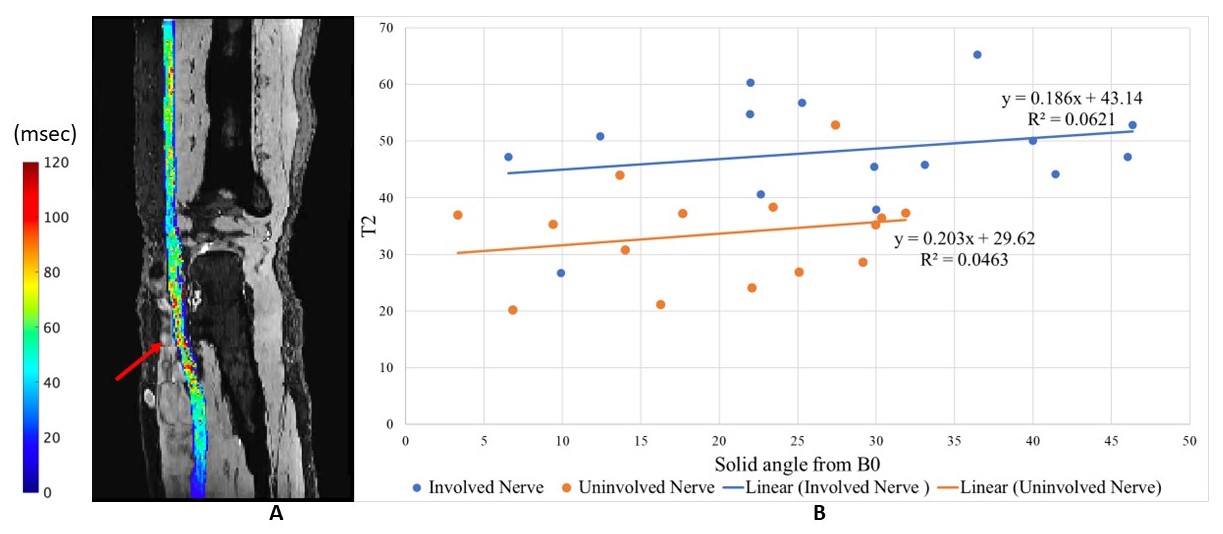
Mean T2 of the involved nerve was significantly greater than that of the uninvolved nerve in both standard DESS-T2 maps (by 14.29msec, p<0.001) and DESS-T2 with DL (by 14.71msec, p<0.001); mean T2 of the involved muscle was significantly greater than that of the uninvolved muscle in both standard (by 9.49msec, p<0.001) and DL (by 9.15msec, p<0.001) maps (Table 1). Standard deviations of T2 in uninvolved nerves and muscles were reduced after DL reconstruction without statistical significance. Mean muscle T2 values were significantly reduced after DL reconstruction (by 0.60msec, p=0.035 for involved and by 0.25msec, p=0.008 for uninvolved), but significant changes were not observed in mean T2 nerve values (Table 1). The nerve angle relative to B0 was positively correlated with DESS-T2, with a slope of 0.186msec/degree for involved nerves and 0.203msec/degree for uninvolved nerves (Figure 4).Discussion
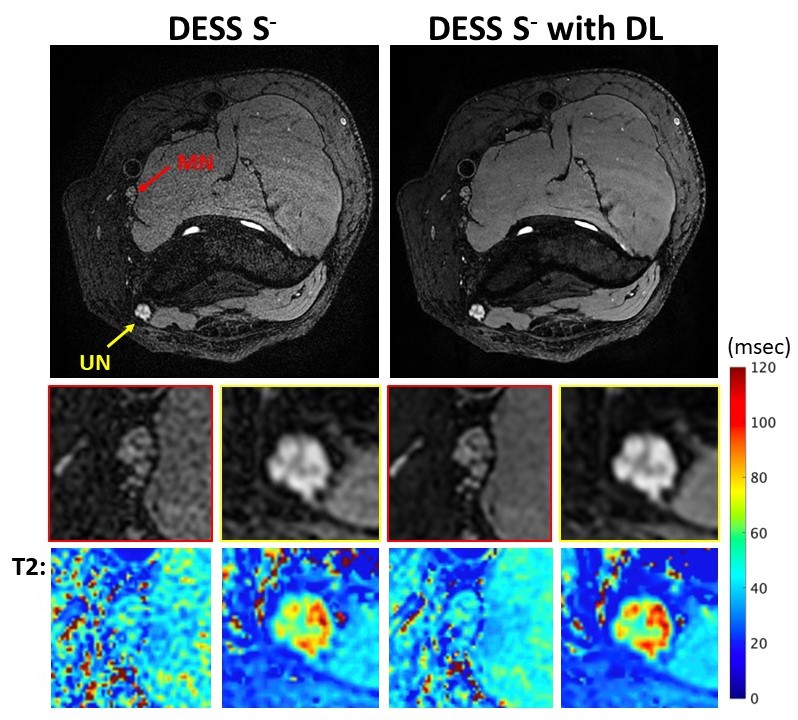
Quantitative comparisons found that, in patients with peripheral neuropathy, DESS-T2 values for involved muscles and nerves were higher than those for uninvolved, using both standard and 3D-DL reconstruction methods. These preliminary results suggest that DESS T2-mapping may be useful for quantitative evaluation of peripheral neuropathies (Figure 2). 3D-DL mostly reduced T2 standard deviations, although this was not statistically significant, perhaps due to the study’s small sample size. 3D-DL did lead to a significant, albeit small decrease in DESS-T2-values (Figure 3), but improvements in accuracy against conventional T2 mapping were not evaluated here. We measured consistent correlations between nerve angle and mean T2 in both involved and uninvolved nerves, suggesting the presence of a magic angle affect in DESS-T2 mapping (Figure 4), that was uncorrected in this work. Furthermore, motion artifacts and fat suppression that can impact quantitative DESS-T2 accuracy may be addressed in future studies. Finally, correlation with electrodiagnostic and strength testing to determine the clinical relevance of these findings can be performed.Conclusion
3D-DESS generated T2 maps with DL reconstruction can quantitatively evaluate nerves and muscles involved in peripheral neuropathies, though nerve orientation relative to B0 should be considered to avoid this potential bias.Acknowledgements
The authors thank Yan Wen and Maggie Fung from GE Healthcare for technical assistance and useful discussion. HSS receives institutional research support from GE Healthcare.References
1. Filler AG, Maravilla KR, Tsuruda JS. MR neurography and muscle MR imaging for image diagnosis of disorders affecting the peripheral nerves and musculature. Neurol Clin 2004;22:643 682 doi: 10.1016/j.ncl.2004.03.005.
2. Preisner F, Behnisch R, Foesleitner O, et al. Reliability and reproducibility of sciatic nerve magnetization transfer imaging and T2 relaxometry. Eur Radiol 2021:1–11 doi: 10.1007/s00330-021-08072-9.
3. Argentieri EC, Tan ET, Whang JS, et al. Quantitative T2‐mapping magnetic resonance imaging for assessment of muscle motor unit recruitment patterns. Muscle Nerve 2021;63:703–709 doi: 10.1002/mus.27186.
4. Redpath TW, Jones RA. FADE–A new fast imaging sequence. Magnet Reson Med 1988;6:224–234 doi: 10.1002/mrm.1910060211.
5. Sveinsson B, Chaudhari A, Gold G, Hargreaves B. A simple analytic method for estimating T2 in the knee from DESS. Magn Reson Imaging 2017;38:63–70 doi: 10.1016/j.mri.2016.12.018.
6. Kästel T, Heiland S, Bäumer P, Bartsch AJ, Bendszus M, Pham M. Magic Angle Effect: A Relevant Artifact in MR Neurography at 3T? Am J Neuroradiol 2011;32:821–827 doi: 10.3174/ajnr.a2402.
7. Zochowski KC, Tan ET, Argentieri EC, et al. Improvement of peripheral nerve visualization using a deep learning-based MR reconstruction algorithm. Magn Reson Imaging 2022;85:186–192 doi: 10.1016/j.mri.2021.10.038.
8. Sun S, Tan ET, Mintz DN, et al. Evaluation of deep learning reconstructed high-resolution 3D lumbar spine MRI. Eur Radiol 2022:1–11 doi: 10.1007/s00330-022-08708-4.
9. Hardy PA, Recht MP, Piraino D, Thomasson D. Optimization of a dual echo in the steady state (DESS) free‐precession sequence for imaging cartilage. J Magn Reson Imaging 1996;6:329–335 doi: 10.1002/jmri.1880060212.
Figures