0664
T1 mapping of the entire abdomen using a time efficient free breathing neural network radial Look Locker approach
Eze Ahanonu1, Kevin Johnson2, Ute Goerke3, Brian Toner4, Vibhas Deshpande5, Ali Bilgin1,2,6, and Maria Altbach2,6
1Department of Electrical and Computer Engineering, The University of Arizona, Tucson, AZ, United States, 2Department of Medical Imaging, The University of Arizona, Tucson, AZ, United States, 3Siemens Healthineers, Tucson, AZ, United States, 4Applied Math Program, The University of Arizona, Tucson, AZ, United States, 5Siemens Healthineers, Austin, TX, United States, 6Department of Biomedical Engineering, The University of Arizona, Tucson, AZ, United States
1Department of Electrical and Computer Engineering, The University of Arizona, Tucson, AZ, United States, 2Department of Medical Imaging, The University of Arizona, Tucson, AZ, United States, 3Siemens Healthineers, Tucson, AZ, United States, 4Applied Math Program, The University of Arizona, Tucson, AZ, United States, 5Siemens Healthineers, Austin, TX, United States, 6Department of Biomedical Engineering, The University of Arizona, Tucson, AZ, United States
Synopsis
Keywords: Quantitative Imaging, Body
The interest in developing quantitative metrics in abdominal imaging has grown in recent years. In particular, abdominal T1 mapping plays a role in the characterization of abdominal pathologies. However, current T1 mapping of the abdomen is limited by poor anatomical coverage, long acquisitions related to sufficient sampling of the T1 recovery curve and recovery times, and reduced T1 accuracy secondary to respiratory motion. Here we present a novel approach for free-breathing T1 mapping of the abdomen, which leverages the undersampling robustness of radial MRI and combines fast data acquisition with deep learning for accurate and efficient abdominal T1 mapping.Introduction
Abdominal T1 mapping plays a role in the characterization of chronic liver disease1, kidney function2, chronic pancreatitis3, and tumor malignancy4,5. However, current T1 mapping of the abdomen is limited by reduced anatomical coverage, long acquisitions to ensure adequate sampling of the T1 recovery curve and sufficient recovery time after inversion, and T1 accuracy due to respiratory motion for free breathing (FB) scans. Recently, a radial Look Locker technique based on undersampled radial data has been proposed for breath hold abdominal imaging6. The goal of this work is to develop a radial Look Locker technique for robust T1 mapping with full anatomical coverage within a short FB scan.Methods
Pulse Sequence: A 2D radial Look Locker T1 mapping technique using a slice-selective inversion-recovery (IR) pulse was implemented at 3T (Skyra, Siemens). The pulse sequence (Figure 1A) consists of an IR RF pulse followed by a series of radial gradient echo (GRE) readouts to sample the IR curve for each slice. The slice-selective IR pulse combined with an advanced slice interleaving scheme6 eliminate the need for a wait time between IR pulses which increases slice efficiency7. Data at each TI are reconstructed using groups of 16 radial views per TI (using a locally low rank (LLR) algorithm8 to overcome undersampling), yielding a well sampled IR curve for improved T1 estimation.For FB data, Prospective Acquisition CorrEction (PACE) triggering is used for the acquisition of each slice (Figure 1B). To reduce the effect of respiratory motion, we sample only a portion of the IR curve and use a convolutional neural network (CNN) to generate accurate T1 maps from the reduced curve.
Deep-Learning Model: A supervised framework is used to train a CNN that takes TI images as input and directly estimates T1 maps at the output. Model training is based on breath-hold data acquired with a 2.5s IR curve. Reference T1 maps are generated using this dataset by fitting the TI images pixel-wise using a non-linear least squares (NLLS) algorithm. Retrospective truncation of radial views followed by LLR reconstruction are performed to generate TI images corresponding to a 1s recovery curve. The network is trained to estimate the reference T1 maps, given the TI images from a 1s curve. For testing, FB data are acquired with a 1s curve, and the pre-trained CNN model is used to estimate T1 maps from the resulting TI images.
Breath hold (BH) in vivo imaging: Data were acquired from 20 subjects with TR/TE/α=3.3ms/1.75ms/100 and pixel-resolution=1.56 x 1.56 x 8mm. For each subject, 21 slices were acquired across 3 BHs. The acquired IR curve length was 2.5s and consisted of 768 radial views; this dataset was truncated to 304 radial views to produce 1s IR curve data for CNN training.
Free breathing in vivo imaging: Data were acquired on 4 subjects with PACE triggering with TR/TE/α=3.3ms/1.75ms/100 and pixel-resolution=1.56 x 1.56 x 8mm. For each subject, 32 slices were acquired in <2 minutes. Data were acquired with a 1s IR curve (304 radial views) and a 2.5s IR curve (768 radial views). After LLR reconstruction, the 1s and 2.5s IR curve data yielded 19 TIs and 48 TIs, respectively. In both cases the temporal spacing was 53.2ms.
Results and Discussion
Figure 2 illustrates the effect of the IR curve length on T1 mapping when acquiring FB data. As shown in Figure 2A, if the respiratory cycle is shorter than normal (<3s) and comparable to the length of the IR curve (e.g., 2.5s), the last part of the IR curve is affected by respiratory motion. The T1 maps estimated under this scenario will have artifacts. This is illustrated in Figure 2B by comparing the T1 maps from FB and BH data acquired with a 2.5s IR curve. Note that the FB data has a halo with high T1 values around the liver (arrows) which is not seen in the BH data.When FB data are acquired with a 1s IR curve the halo disappears as shown in Figure 3A for subjects 1 and 2. However, the T1 maps obtained from the FB 1s IR curve using conventional NLLS fitting are noisy and the T1s of tissues (e.g., muscle, kidney, and spleen) are overestimated compared to the BH reference (arrows in Figure 3). When T1 maps are generated using the CNN (Figure 3B), the T1 maps are similar to the BH reference as can be seen qualitatively in Figure 3 and quantitively in Table 1. With the short IR curve CNN approach, FB T1 mapping of the full abdomen (Figure 5) is achieved in <2 minutes.
Conclusions
A short IR curve T1 mapping approach that combines the unique undersampling properties of radial MRI with deep learning has been developed for efficient T1 mapping of the whole abdomen. Because of its slice efficiency and T1 robustness the new technique should provide an alternative to current T1 mapping methods in the clinic.Acknowledgements
We would like to acknowledge support from the NIH (CA245920 and EB031894), Arizona Biomedical Research Centre (CTR056039), and the Technology and Research Initiative Fund (TRIF) Improving Health Initiative.References
1. Kim JW, Lee YS, Park YS, Kim BH, Lee SY, Yeon JE, Lee CH. Multiparametric MR Index for the Diagnosis of Non-Alcoholic Steatohepatitis in Patients with Non-Alcoholic Fatty Liver Disease. Sci Rep. 2020;10(1):2671.2. Huang Y, Sadowski EA, Artz NS, et al. Measurement and comparison of T1 relaxation times in native and transplanted kidney cortex and medulla. J Magn Reson Imaging. 2011;33:1241-1247.
3. Tirkes T, Lin C, Fogel EL, Sherman SS, Wang Q, Sandrasegaran K. T1 mapping for diagnosis of mild chronic pancreatitis. J Magn Reson Imaging. 2017 Apr;45(4):1171-1176.
4. Fahlenkamp, U.L., Ziegeler, K., Adams, L.C. et al. Native T1 mapping for assessment of the perilesional zone in metastases and benign lesions of the liver. Sci Rep 10, 12889 (2020).
5. Goldberg MA, Hahn PF, Saini S, Cohen MS, Reimer P, Brady TJ, Mueller PR. Value of T1 and T2 relaxation times from echoplanar MR imaging in the characterization of focal hepatic lesions. AJR Am J Roentgenol. 1993;160(5):1011-1017.
6. Li Z, Bilgin A, Johnson K, Galons JP, Martin DR, and Altbach MI, Rapid high-resolution T1 mapping using highly accelerated radial steady-state free-precession acquisition, J Magn Reson Imaging, 2019 Jan;49(1):239-252. doi: 10.1002/jmri.26170. Epub 2018 Aug 24. PMID: 30142230.
7. Goerke U, Ahanonu E, Keerthivasan M, Bilgin A, Deshpande V, Altbach MI, Inversion Recovery Look-Locker T1-Mapping for Abdominal Imaging: How Many Slices Can One Fit in a Single Breath-Hold? Proceedings of Annual Meeting of the ISMRM, 30:107, 2022.
8. https://mrirecon.github.io/bart/
Figures
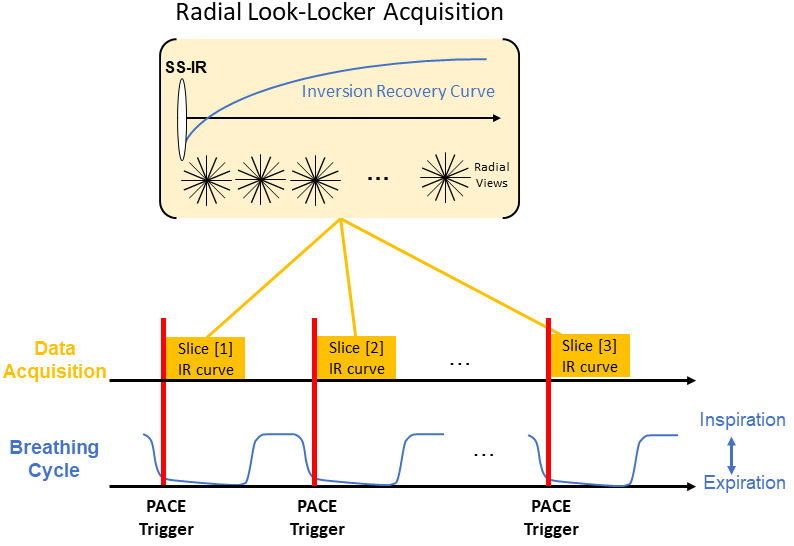
Figure 1. Schematic representation of the PACE triggered radial Look Locker T1 mapping technique.
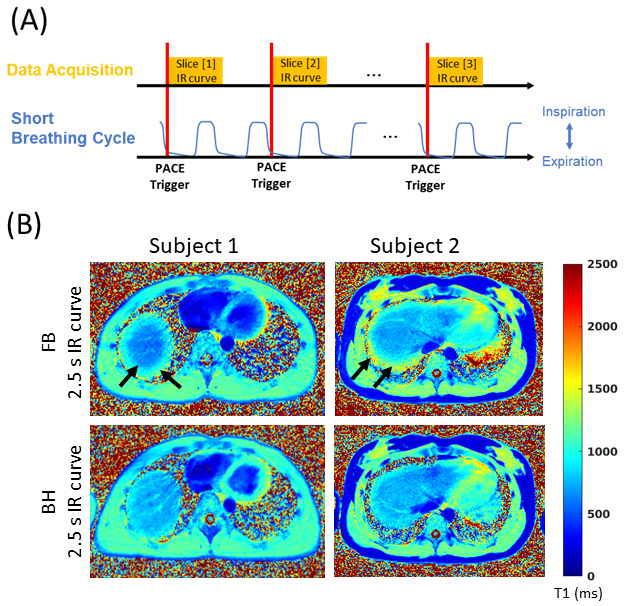
Figure 2. Effect of a short breathing cycle on T1 mapping. (A) Schematic illustration of data acquisition when the breathing cycle is comparable to the length of the IR curve. When the breathing cycle approaches the length of the IR curve, the data will be affected by motion. (B) Effect of breathing motion on T1 maps obtained from a 2.5s FB scan compared to a BH reference scan. The T1 maps acquired under FB with a 2.5s IR curve have an artifactual halo (arrows) not present in the reference BH data.
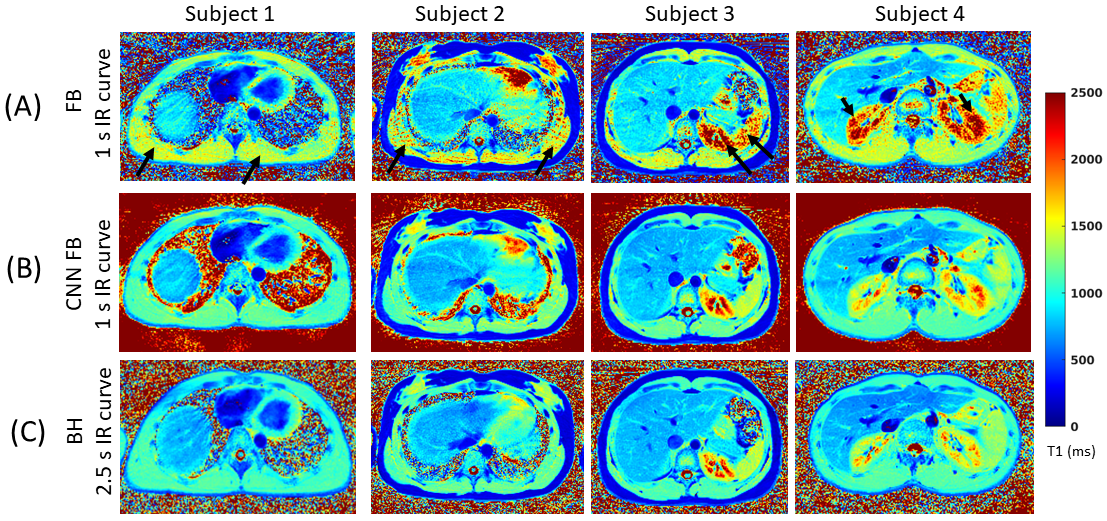
Figure 3. Comparison of FB data acquired with a 1s IR curve where the T1 maps are generated using (A) the conventional non-linear least squares (NLLS) fitting or (B) a CNN approach. (C) T1 maps obtained from BH data acquired with a 2.5s IR curve and fitted using a NLLS algorithm are shown as reference.
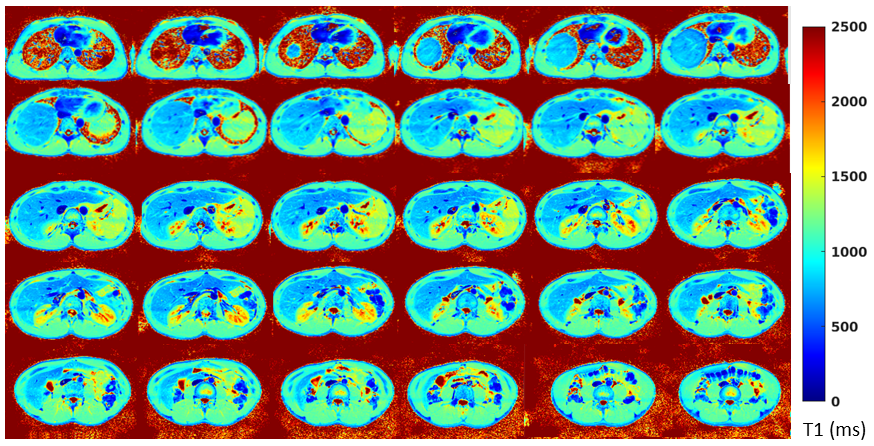
Figure 4. Full abdomen FB T1 mapping with the CNN radial Look Locker technique. Shown in the figure are the T1 maps corresponding to 30 of 32 slices yielded by the CNN radial Look Locker technique. Data for the 32 slices was acquired in < 2 minutes. The T1 maps have a pixel resolution of 1.56x1.56x8.0 mm and were generated from TI images with a temporal resolution of 53.2 ms.
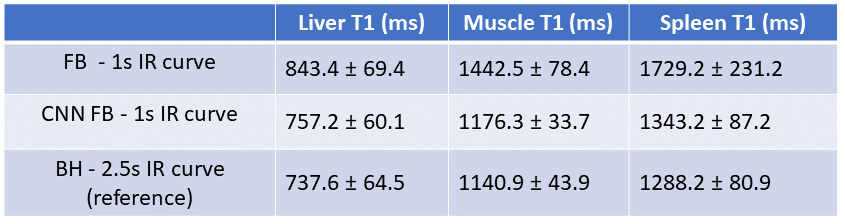
Figure 5. T1 estimates (mean and standard deviation) from ROIs selected in the liver, spleen, and muscle across the 32 slices per subject. The data in the table is the average over 4 subjects.
DOI: https://doi.org/10.58530/2023/0664