0663
Imaging the perivascular and cerebrospinal fluid spaces in TgF344-AD rats using ultra-long echo time MRI1Division of Psychology, Communication and Human Neuroscience, School of Health Sciences, Faculty of Biology, Medicine and Health, The University of Manchester, Manchester, United Kingdom, 2Geoffrey Jefferson Brain Research Centre, Manchester Academic Health Science Centre, Manchester, United Kingdom, 3Division of Neuroscience, School of Biological Sciences, Faculty of Biology, Medicine and Health, The University of Manchester, Manchester, United Kingdom, 4Department of Mathematics, The University of Manchester, Manchester, United Kingdom, 5Division of Informatics, Imaging and Data Sciences, Faculty of Biology, Medicine and Health, The University of Manchester, Manchester, United Kingdom
Synopsis
Keywords: Neurofluids, Alzheimer's Disease, Perivascular space
Enlargement of perivascular and ventricular spaces are associated with neuroinflammation in neurodegenerative diseases, including cerebral small vessel disease and Alzheimer’s disease. In this study we develop methodology for measuring the anatomy of the perivascular space around the anterior cerebral artery and partial-volume-free estimates of total CSF volume and apply this approach to TgF344-AD rats. Neither the area under the curve of perivascular space profiles, nor overall width of the perivascular space, or the total CSF volume differed between TgF344-AD rats and wild-types.Introduction
Cerebrospinal fluid (CSF) is located in the ventricular system, subarachnoid space, and perivascular spaces (PVS) of penetrating arteries1. Recently, PVSs have been identified as entry and exit points of CSF into the brain parenchyma via the AQP4 mediated water-exchange2,3. Since ventricular CSF, perivascular CSF, and the glymphatic system are connected, measurements of CSF and/or PVS morphology may reflect wider glymphatic dysfunction4,5,6.Enlargement of PVSs has been associated with Alzheimer’s disease7,8. While histological analyses of the PVS and CSF spaces exist, ex-vivo studies suffer from the collapse of these structures during autopsy and brain fixation9. Therefore, it is advantageous to develop imaging techniques that study PVSs in vivo. One approach for quantifying PVSs utilises diffusion-tensor imaging analysis along perivascular space (DTI-ALPS) where an ALPS-index has been associated with MMSE scores10. However, this metric is likely to be highly non-specific as it lacks spatial resolution necessary to resolve PVS from normal tissue.
In this study, we use ultra-long TE fast-spin-echo imaging to measure perivascular space anatomy around a large artery within the rat brain. Additionally, we are able to assess the volume of total ventricular CSF in a way that is not hampered by partial volume effects with surrounding tissue. We then apply the approach to investigate PVS and ventricular changes in TgF344-AD rats.
Methods
All experimental procedures were carried out in accordance with the UK Animals (Scientific Procedures) Act 1986 and EU Directive 2010/63/EU for animal experiments.Six wild-type (WT) and seven TgF334-AD (TG) rats were scanned. Rats were anaesthetised using 2% isoflurane and placed on the MRI bed, and the head secured using ear bars and a bite bar. Respiration was monitored using a pressure pad placed under the rib cage and temperature maintained using a feedback-controlled air-heating system connected to a rectal temperature probe.
MRI was performed on an Agilant 7T magnet interfaced to a Bruker Avance III console, using a volume transmitter and rat brain surface coil for reception. To visualise tissue anatomy, including blood vessels, high-resolution sagittal T2-weighted TurboRARE scans were acquired with a short TE and the following parameters: 0.117mm2 in-plane × 0.5mm slices, TR/TE = 4200/33ms, 5 signal averages, echo spacing 11ms, rare factor 8, matrix size 256x256, 40 slices. To null tissue and blood signal, leaving only signal from CSF, the same sequence was repeated using a long echo time (TE = 200ms).
Gibbs ringing were removed from both scans using DIPY package (version 1.5.0). The two T2-TurboRARE scans from each rat were co-registered using rigid registration in Elastix (version 5.0.1). The anterior cerebral artery (ACA) was manually segmented on the short TE T2-TurboRARE scan. Segmentations were dilated in 1-pixel steps to find the average signal at different distances from the centre of the vessel (Figure 1C). The masks for each dilation were then applied to the long-TE image, and the total signal along the dilation mask was averaged to create a PVS profile for each rat. The profile for each rat was normalised to the signal the in the centre of the vessel (i.e. the long TE blood signal). The PVS width was calculated as the full-width half-maximum (FWHM) of the two peaks immediately surrounding the centre of the vessel (displacement = 0 mm, see Figure 4). Total CSF volume was determined by segmenting the long-TE image and counting the number of CSF-filled voxels. Group-wise data was compared using student’s t-test.
Results
Figure 2 shows the total CSF volume (mean WT = 114±19mm3, TG = 129±33mm3) which did not differ between groups (p = 0.34). Figures 3 and 4 show the perivascular signal increase compared to surrounding parenchyma. The widths of the peaks did not differ between groups in rostral-dorsal (p = 0.61) or ventral-caudal (p = 0.59) directions, see Figure 5, neither did the two peak widths differ within TG (p = 0.86) or WT (p = 0.19) animals.Discussion
An ultra-long TE imaging protocol was used to visualise the anatomy of PVS around the ACA and the total CSF volume free from partial volume effects. Using this approach, we were able to clearly delineate the PVS profile along the ACA, demonstrating the PVS is at least as wide as the vessel itself2,11. Contrary to reports in AD patients7, we did not find significant differences in PVS or total CSF between TG and WT rats. Many patients with AD present with small vessel disease pathology, and it is possible that AD pathology does not alter PVS itself.The anatomical scans had a slice thickness that was approximately twice the diameter of ACA (500 µm vs literature estimates of ~200 µm11). This meant that PVS profiles were collapsed into the sagittal plane, and the 3D structure of the PVS was lost. Furthermore, the in-plane resolution was 0.117mm2, which was too coarse to visualise the PVS of smaller offshoots from ACA. For analysis of total CSF, we estimated the total CSF volume only, and did not investigate whether changes in CSF volume appeared more locally, for example near the hippocampus. Future work will aim to increase through and in-plane resolution of PVS images and to perform regional analysis of CSF anatomy.
Acknowledgements
MK is funded through a Medical Research Council (MRC, UK) Doctoral Training Programme Grant [No. MR/N013751/1].References
1. Pizzo M E, et al. Intrathecal antibody distribution in the rat brain: surface diffusion, perivascular transport and osmotic enhancement of delivery. J Physiol. 2018;596(3):445-475.
2. Ineichen B V, et al. Perivascular spaces and their role in neuroinflammation. Neuron. 2022;110(21):3566-81.
3. Alshuhri M S, et al. Direct imaging of glymphatic transport using H217O MRI. JCI Insight. 2021;6(10):e141159.
4. Ma Q, et al. Outflow of cerebrospinal fluid is predominantly through lymphatic vessels and is reduced in aged mice. Nat commun. 2017;8:1434.
5. Selkoe D J, Hardy J. The amyloid hypothesis of Alzheimer's disease at 25 years. EMBO Mol Med. 2016;8(6):595-608.
6. Xu Z, et al. Deletion of aquaporin-4 in APP/PS1 mice exacerbates brain Aβ accumulation and memory deficits. Mol Neurodegener. 2015;10:58.
7. Vilor-Tejedor N, et al. Perivascular spaces are associated with tau pathophysiology and synaptic dysfunction in early Alzheimer’s continuum. Alzheimers Res Ther. 2021;13:135.
8. Boespflug E L, et al. Targeted Assessment of Enlargement of the Perivascular Space in Alzheimer’s Disease and Vascular Dementia Subtypes Implicates Astroglial Involvement Specific to Alzheimer’s Disease. J Alzheimers Dis. 2018;66(4):1587-1597.
9. Mestre H, et al. Flow of cerebrospinal fluid is driven by arterial pulsations and is reduced in hypertension. Nat commun. 2018;9:4878.
10. Taoka T, et al. Evaluation of glymphatic system activity with the diffusion MR technique: diffusion tensor image analysis along the perivascular space (DTI-ALPS) in Alzheimer's disease cases. Jpn J Radiol. 2017;35(4):172-178.
11. Lee R M K W. Morphology of cerebral arteries. Pharmacol Ther. 1995;66(1):149-173.Figures
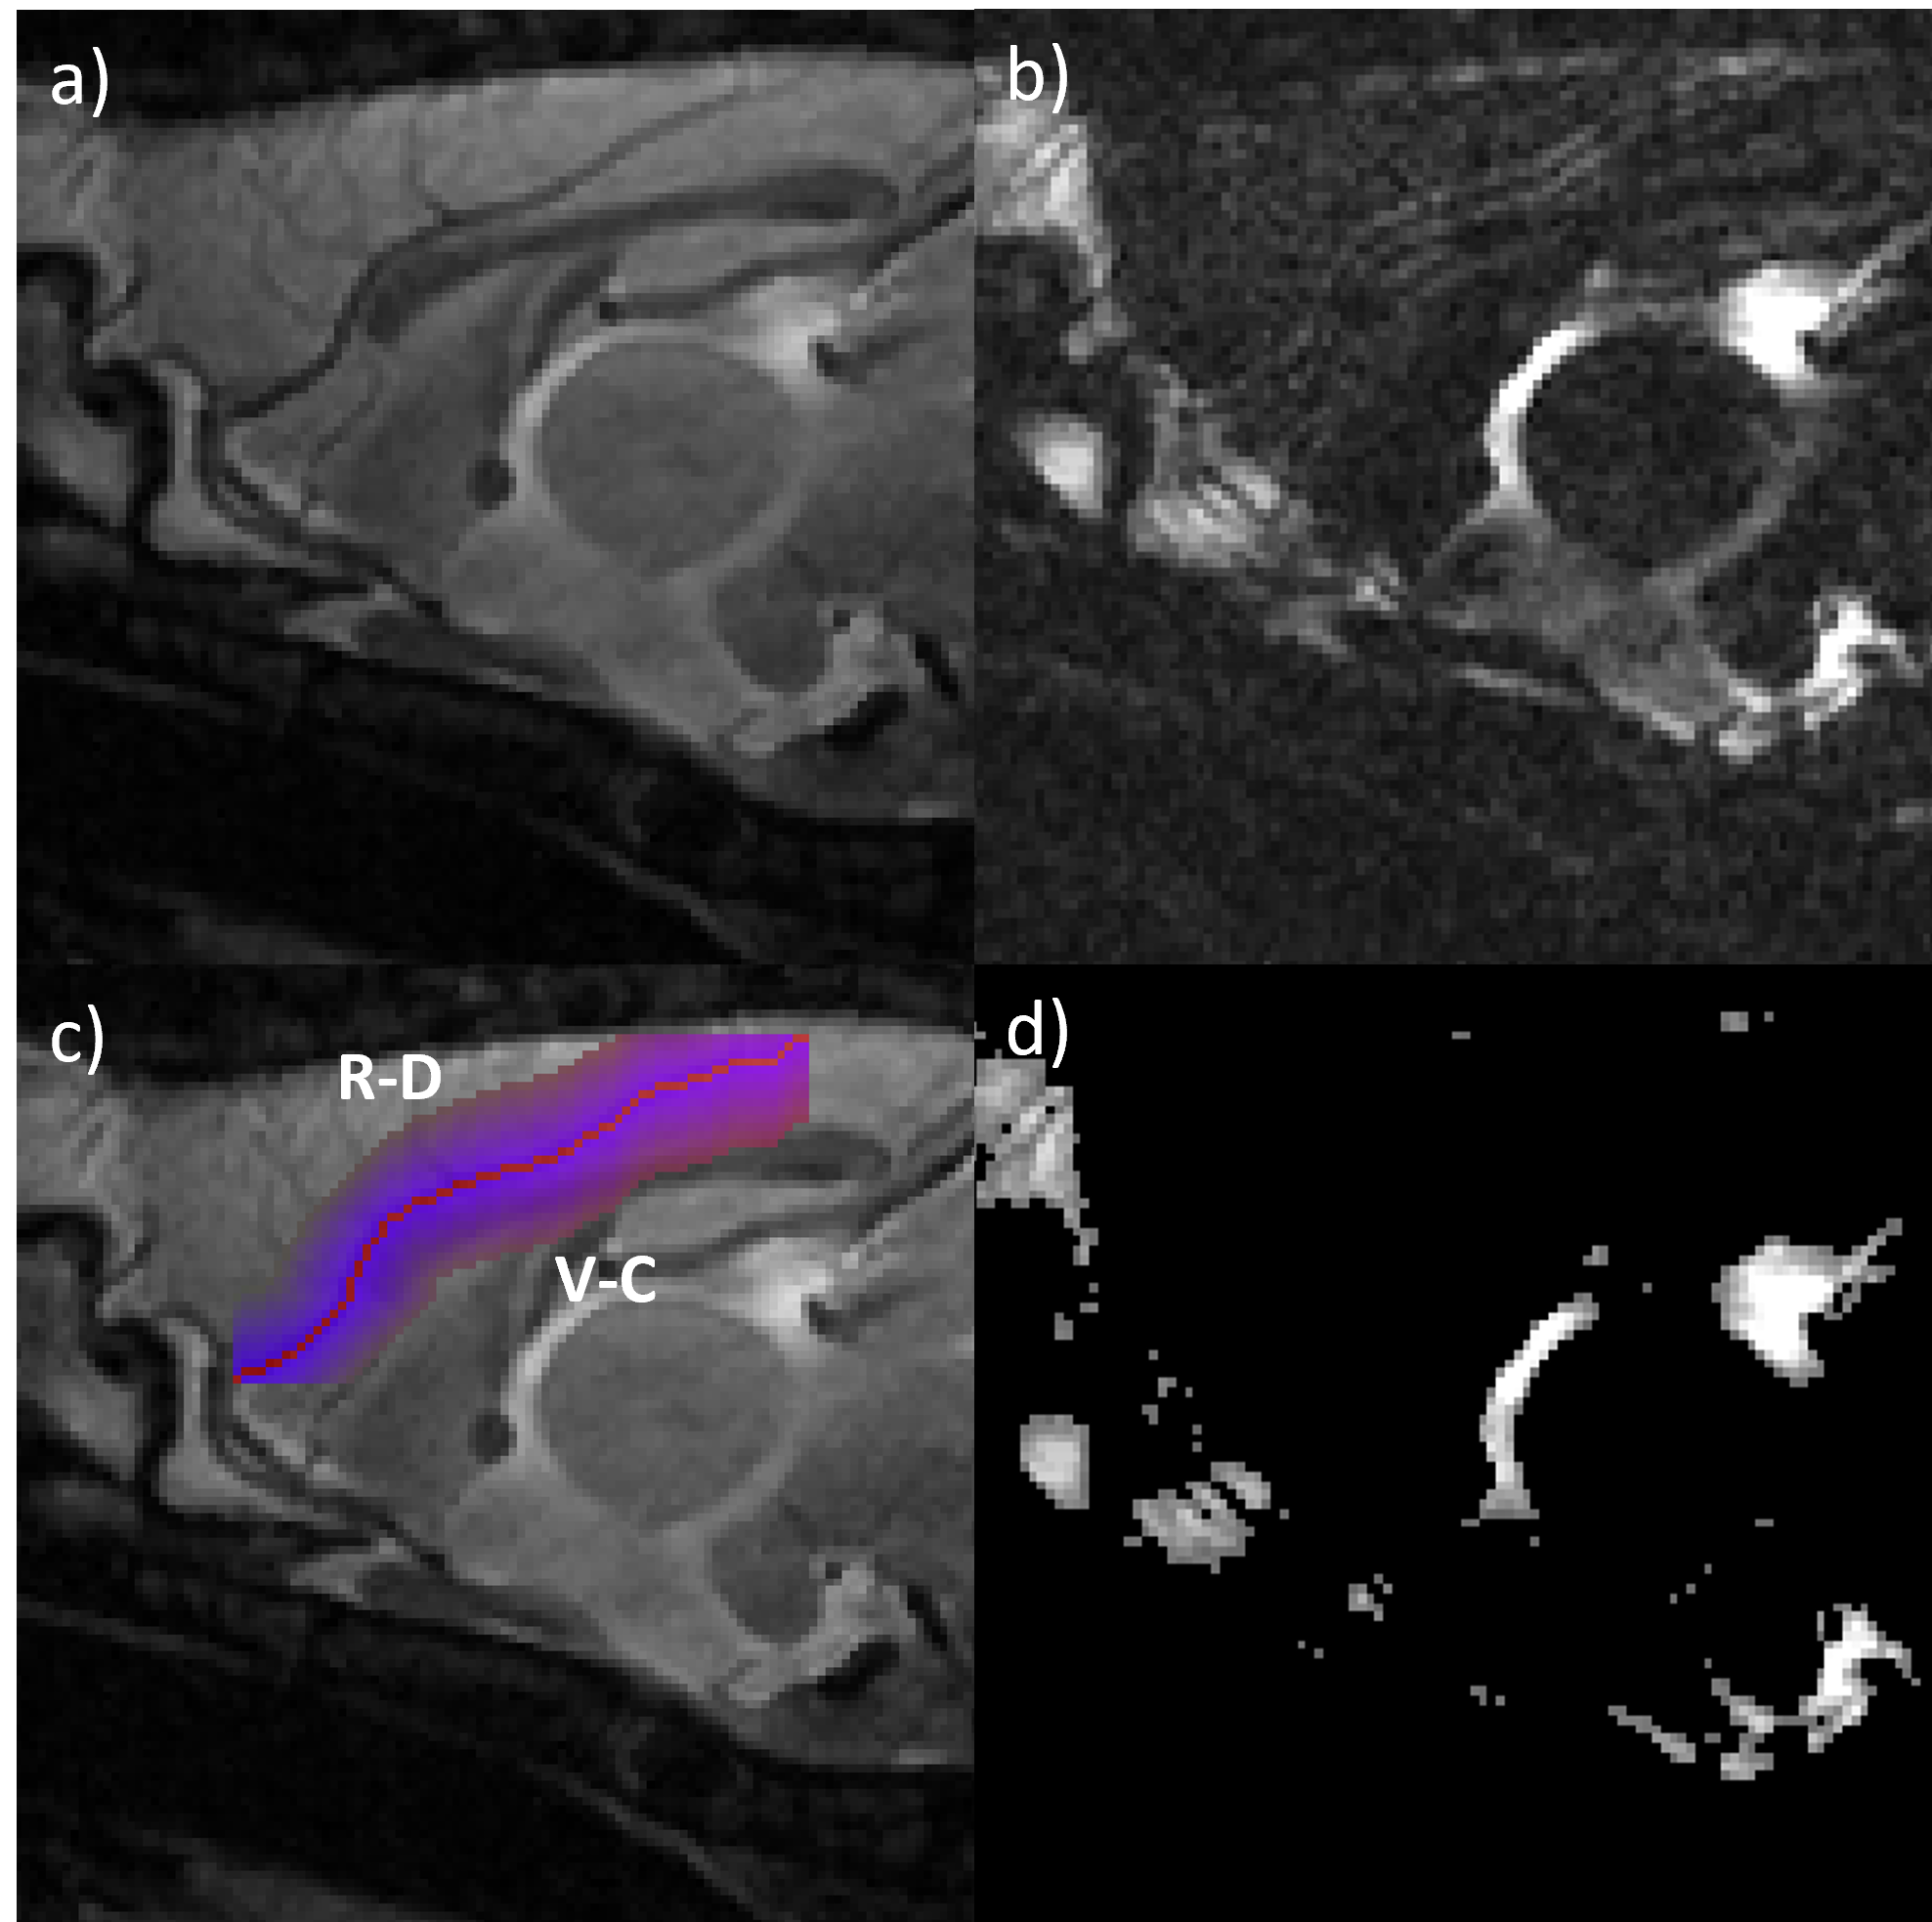
Figure 1: Central sagittal slice of a representative wild-type rat. a) Short TE anatomical image. b) Long TE image with increased CSF contrast. c) Dilation image overlaid on long TE anatomical image. R-D is the rostral-dorsal direction and V-C is ventral-caudal. d) CSF mask derived from long-TE image by thresholding.
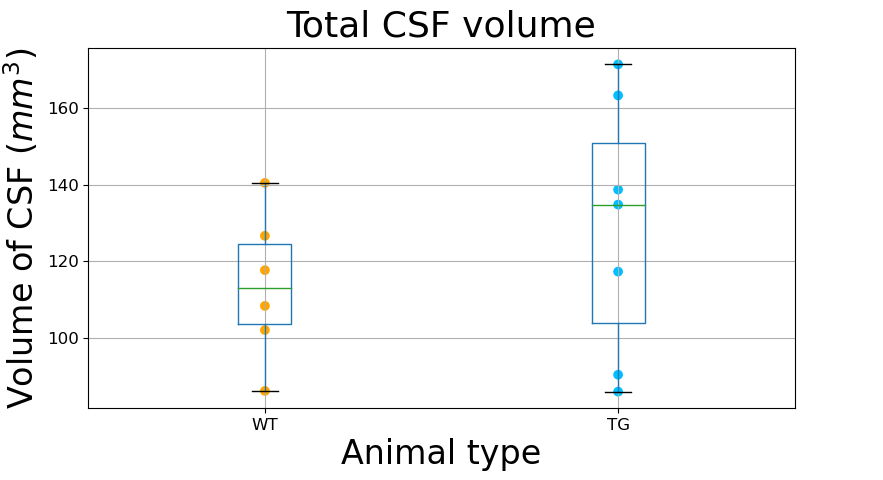
Figure 2: Boxplots showing the total CSF volume obtained by segmenting masked long TE scans using the Otsu method.
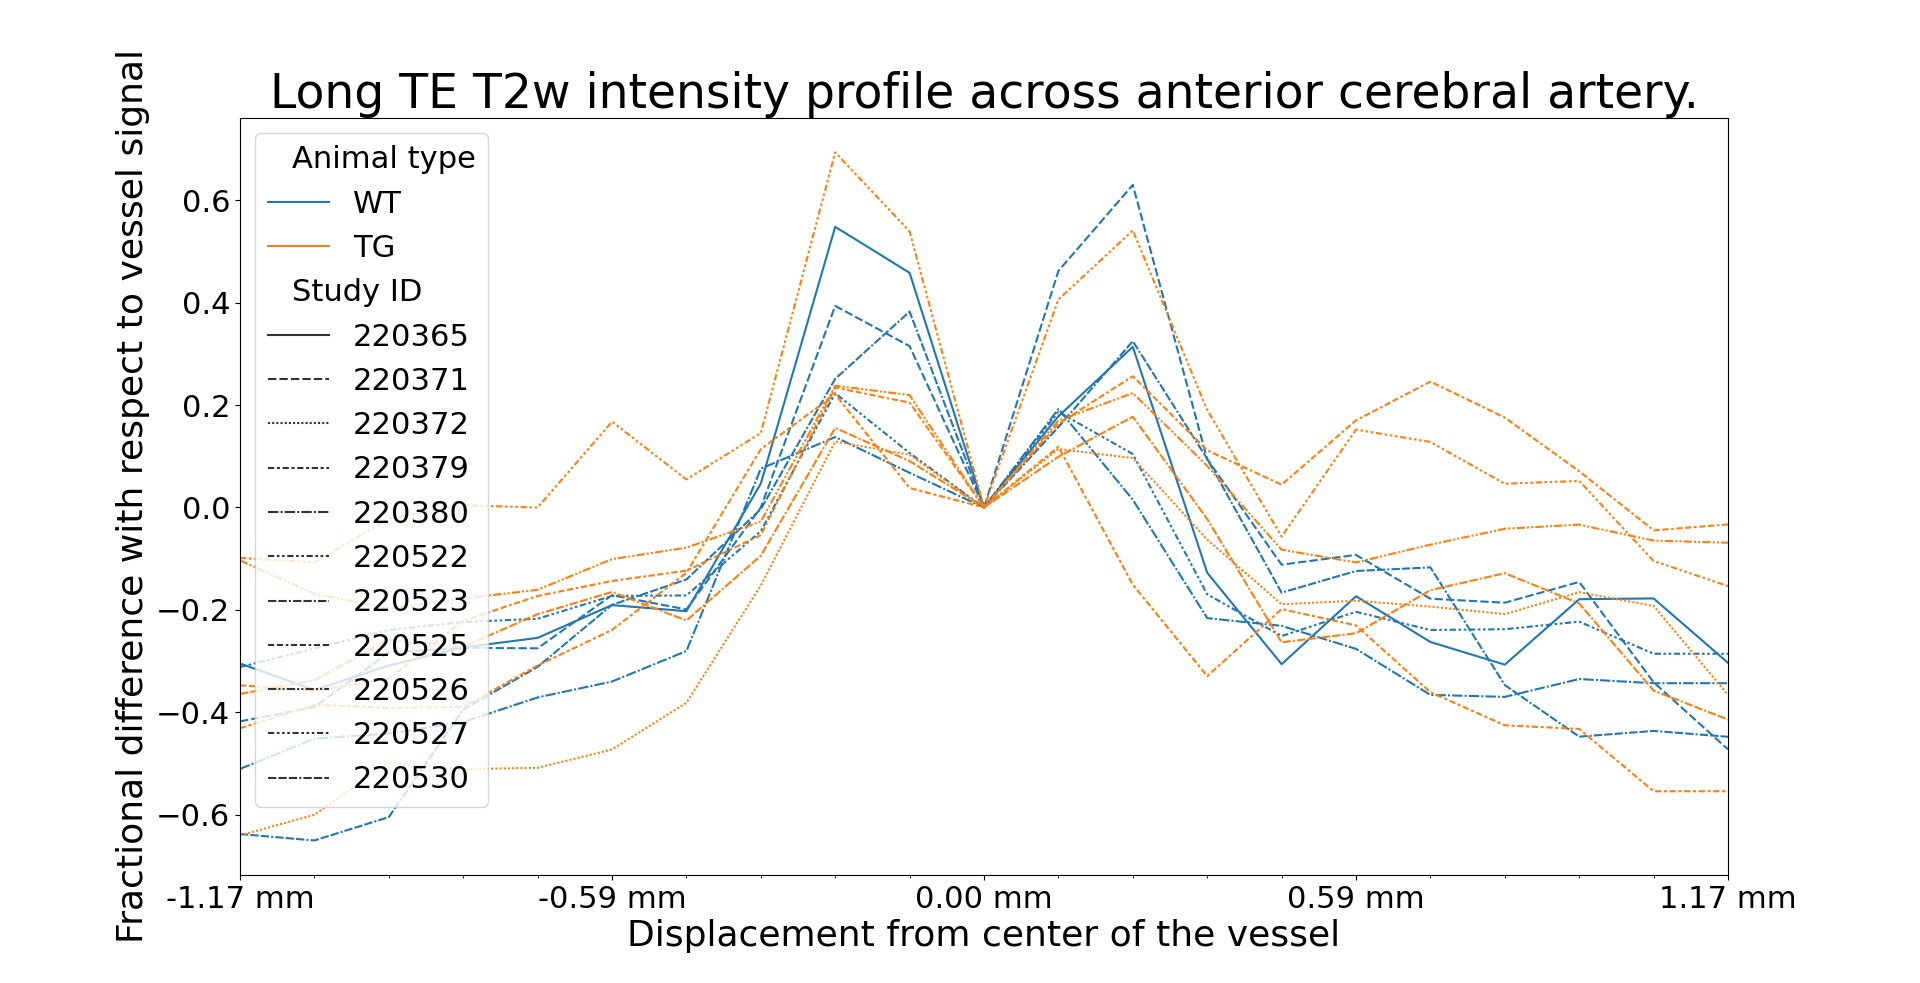
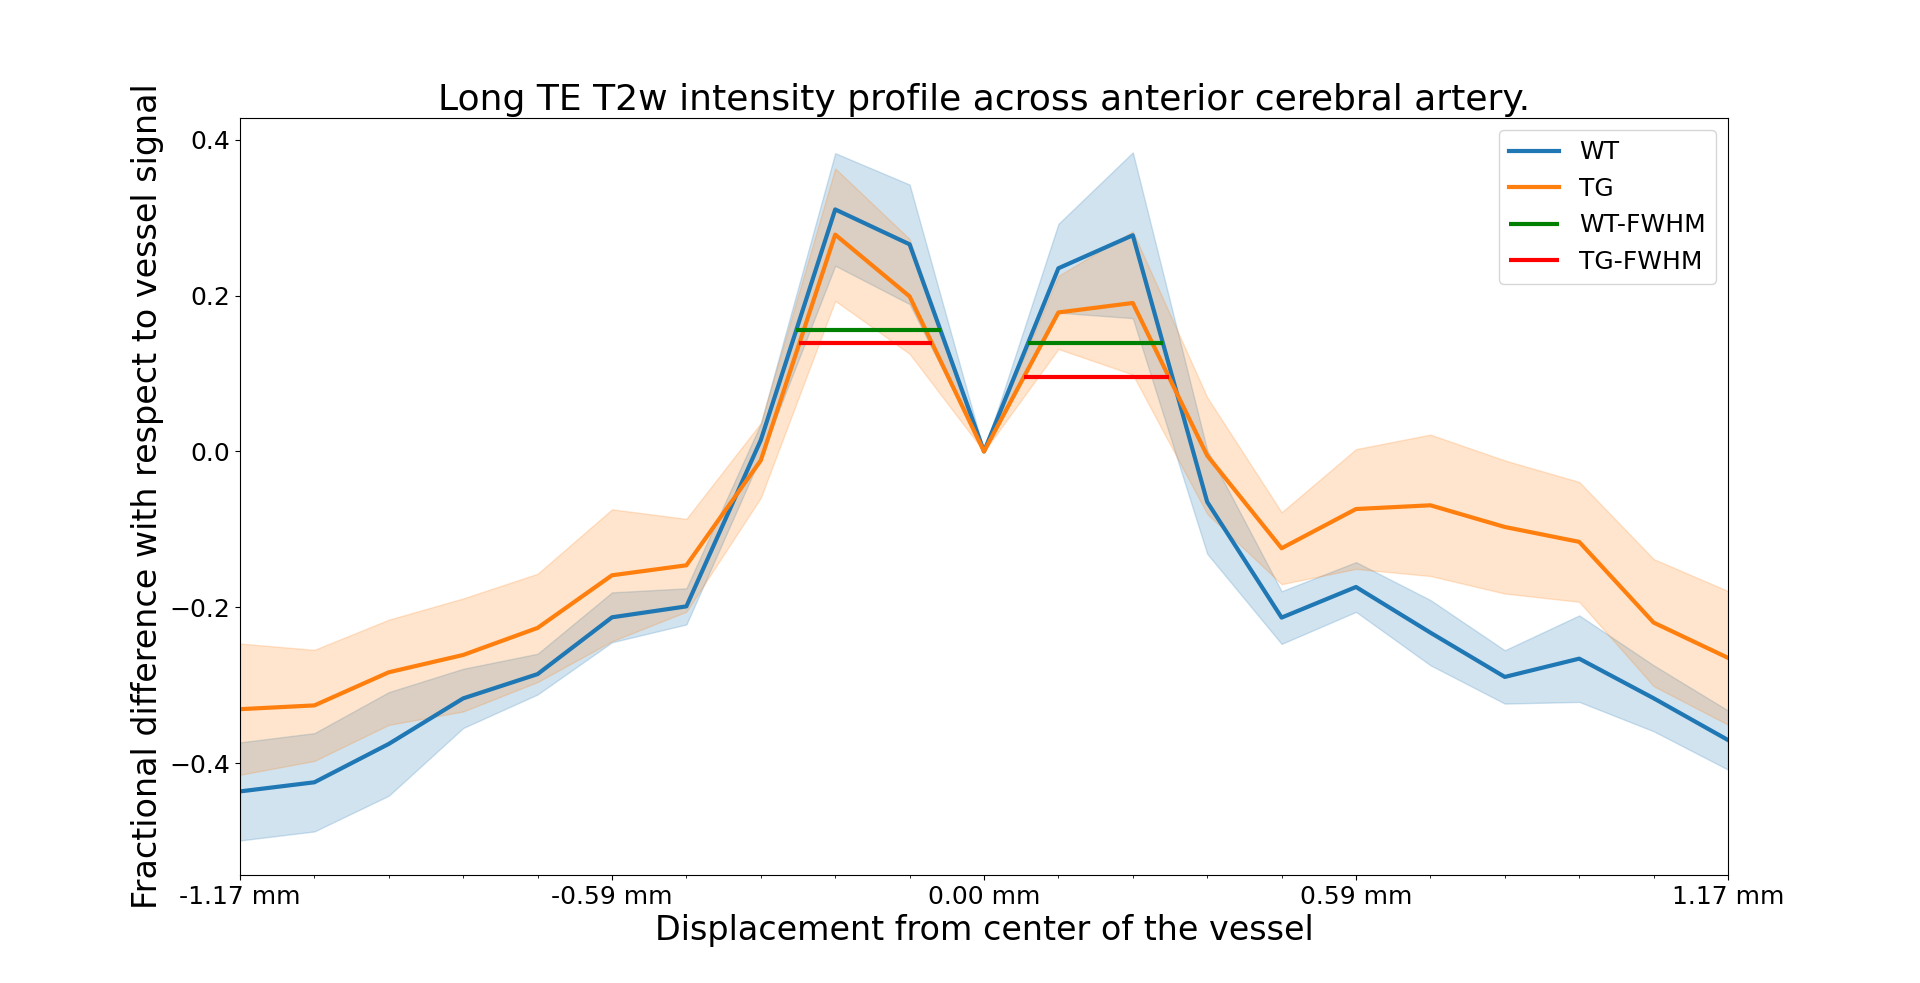
Figure 4: Average perivascular signal intensity across the two groups with bands showing the standard error. Both groups show similar signal enhancement in the blood vessel proximity. Signal from further away is contaminated by various structures. Horizontal lines show FWHM of the mean intensity curve. Left-side peaks have FWHM 0.23 and 0.21mm and right-side peaks have FWHM 0.21 and 0.23mm for WT and TG respectively.
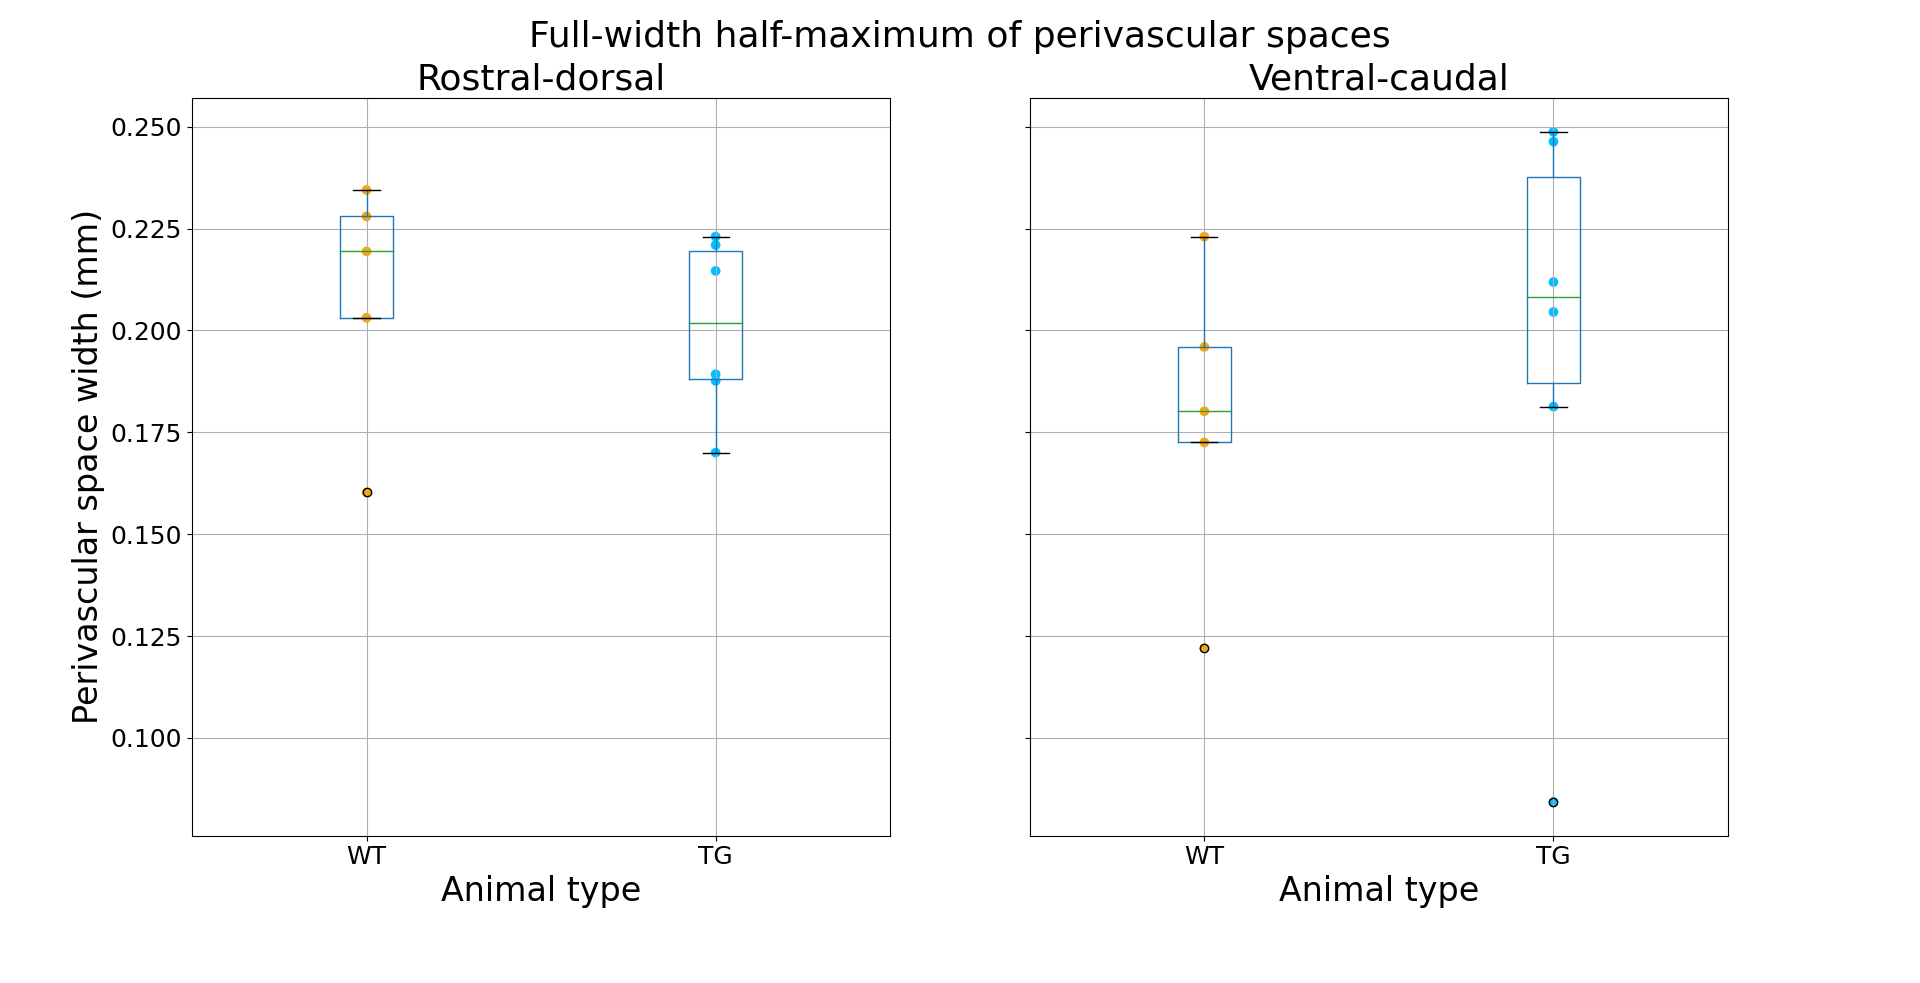
Figure 5: FWHM measures in each rat. Rostral-dorsal perivascular space has mean FWHM (± standard deviation) 0.21±0.03 and 0.20±0.02mm and ventral-caudal perivascular space has mean FWHM 0.18±0.04 and 0.20±0.06mm for WT and TG respectively (see Figure 1C for directions).