0661
QSM in rats with minimal hepatic encephalopathy: does iron overload aggravate cognitive impairment by promoting neuroinflammation?1Ningxia Medical University, Yingchuan, China, 2Department of Radiology, General Hospital of Ningxia Medical University, Yingchuan, China, 3GE Healthcare, MR Enhancement Application, Beijing, China
Synopsis
Keywords: Neurodegeneration, Quantitative Susceptibility mapping, Minimal hepatic encephalopathy; Iron
In this study, we used the QSM technique to quantitatively evaluate the levels of brain iron in the hippocampus of MHE rats and by evaluating the neuroinflammatory response to explore the relationship between iron with neuroinflammation and cognition. It is expected to provide important insights into the occurrence of MHE disease symptoms and the related biological mechanisms behind them. Meanwhile, our findings also suggested that an abnormal susceptibility values in certain brain areas identified using the QSM may be a potential biomarker to reflect the severity of cognitive impairment and to monitor its progression in cirrhotic patients with MHE.Introduction
Minimal hepatic encephalopathy (MHE) is a neuropsychiatric disorder often resulting from chronic or acute liver failure [1-2]. Studies have found that MHE may cause transient mild cognitive impairment, increasing the risk of various accidents and occupational disabilities [3]. Thus, while timely diagnosis and treatment are important for improving prognosis, the neuropathology and pathogenesis of MHE are poorly understood. It has been thought that MHE may result from the accumulation of neurotoxins in the body, leading to neurological damage [4]. Scholars found iron deposits in the brain has been linked with neurodegenerative diseases, including diseases such as Alzheimer's disease [5] and Parkinson's disease [6]. From the perspective of neuropathology, we hypothesized that MHE neurocognitive deficits were associated with brain iron overload. Quantitative susceptibility mapping (QSM) is a new form of MRI that quantifies the magnetic susceptibility of tissues [7]. Many studies have used QSM to investigate correlations between susceptibility properties, physiological changes, and cognitive function by observing the changes in susceptibility [8]. Here, the association between hippocampal iron accumulation and cognitive impairment in MHE rats was investigated using QSM. Iron is essential for normal neuronal activity, and excessive accumulation of the iron in the brain may herald an increase of neuronal metabolism and/or neuroinflammatory response mediated by glial cells, suggesting a possible link with MHE disease symptoms.Materials and Methods
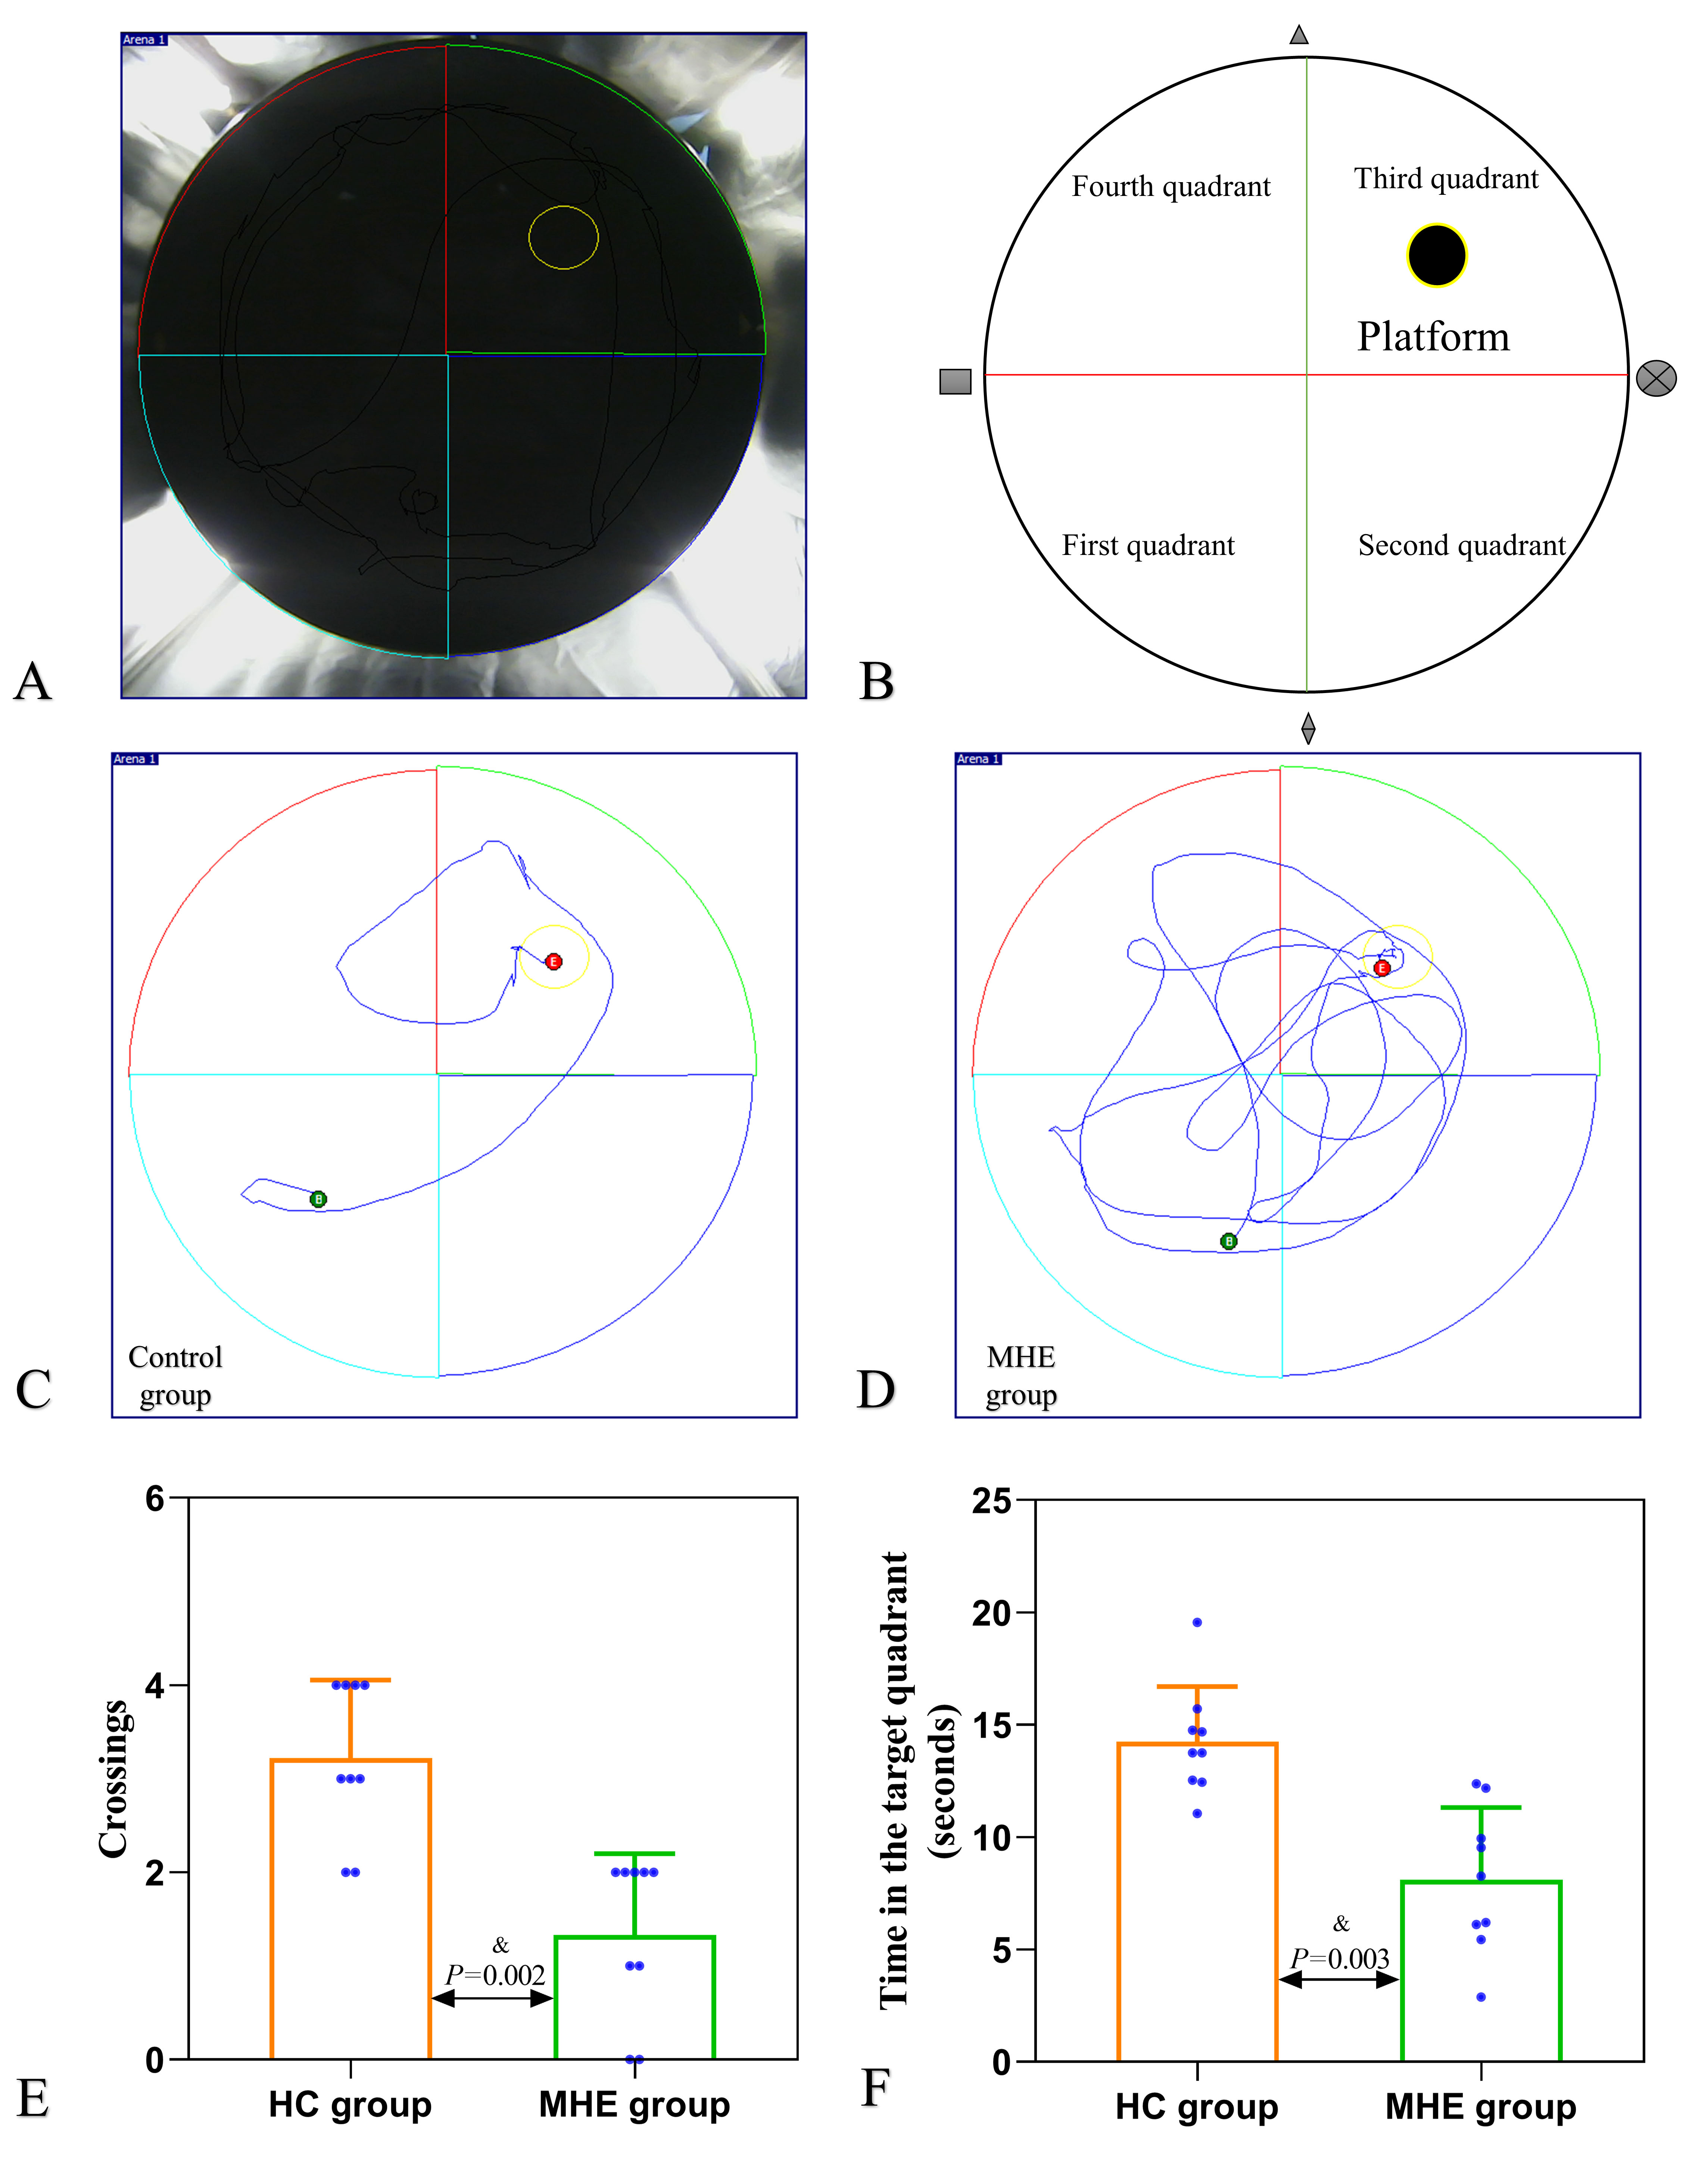
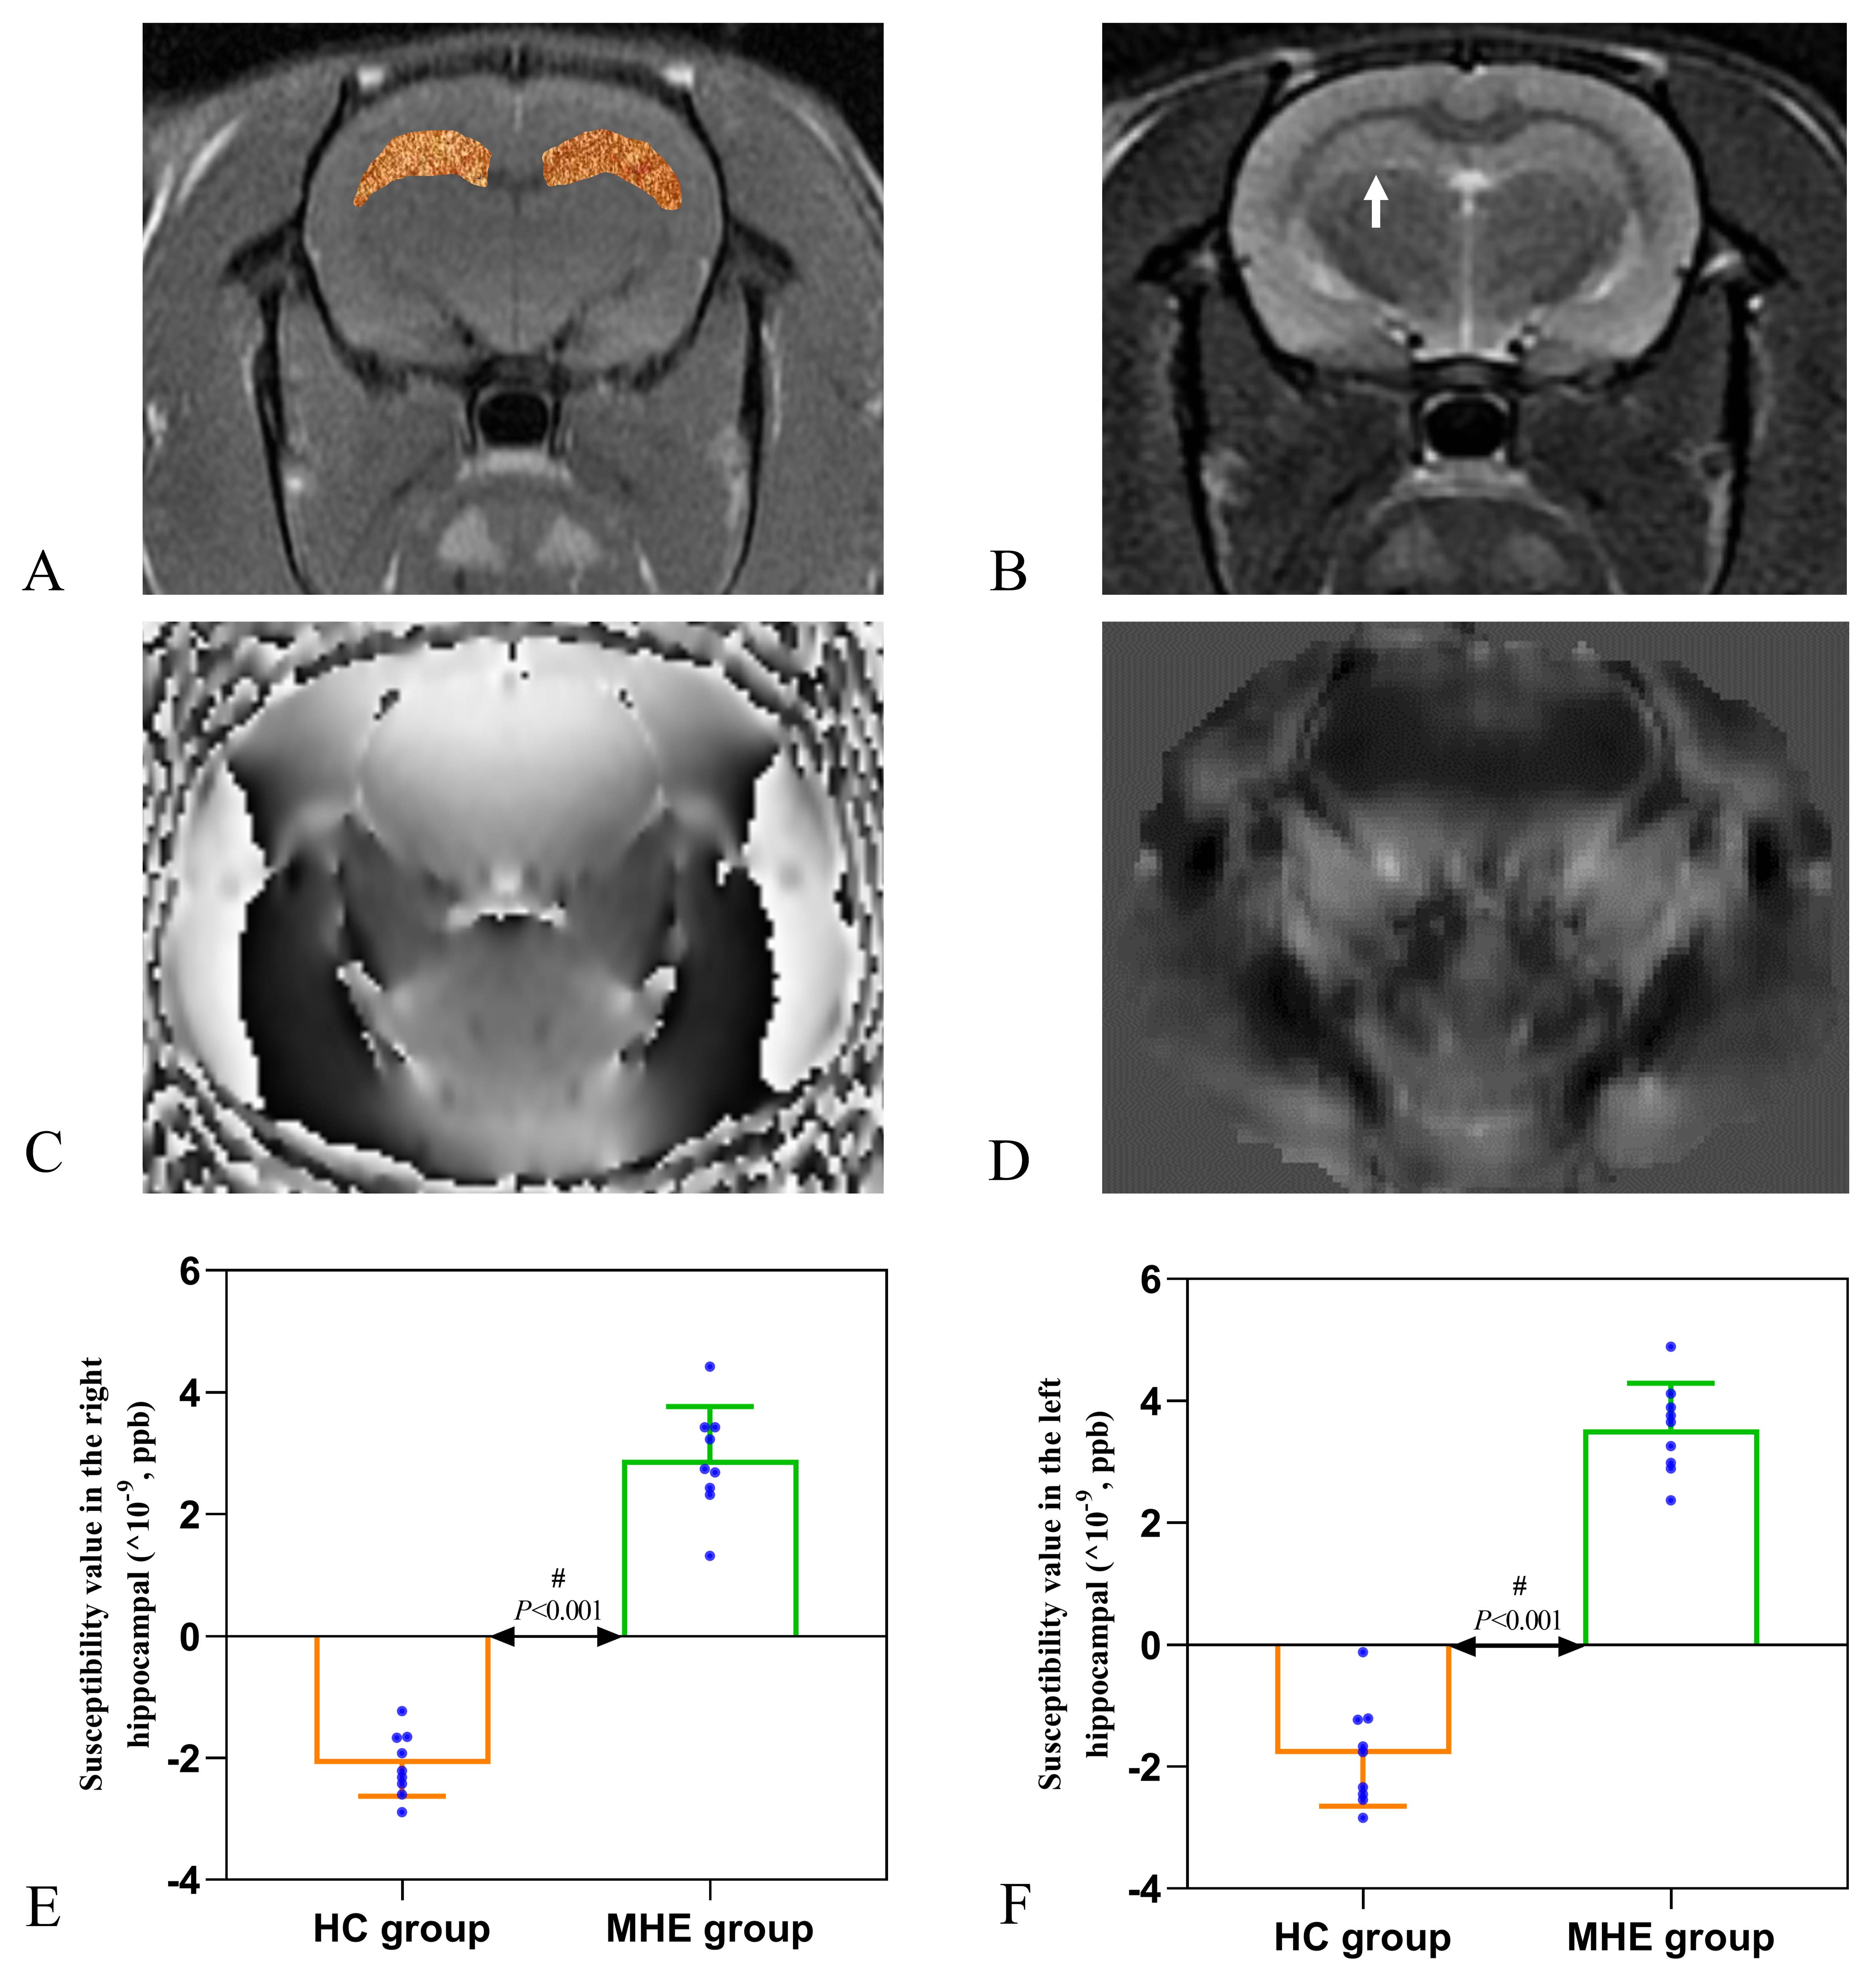
18 Sprague-Dawley rats (6-8 weeks, 200-260g) were purchased from the Experimental Animal Center of Ningxia Medical University and were randomly assigned to MHE (n=9) and control (n=9) groups. The study was approved by the Laboratory Animal Care and Use Committee of Ningxia Medical University (NO: IACUC- NYLAC -2021-114). The rats were housed in a standard animal laboratory with a temperature of 20-22°C, relative humidity of 65-70%, and a 12-h light/dark cycle. The MHE group was prepared using thioacetamide (TAA) (Macklin Biochemical, China) [9], the rats received intraperitoneal injections of 150 mg/kg TAA three times a week for 12 weeks. Control rats were injected with physiological saline. Spatial memory was assessed by the Morris water maze. Hippocampal susceptibility was measured by QSM, rats were anesthetized by medical air (1.0 L/min) and isoflurane (2-2.5%) and were imaged using a GE Architect 3.0T MR scanner with a dedicated rat coil. The parameters used for the routine brain imaging were axial T1WI (TR/TE=720 ms/14.1 ms) and axial T2WI (TR=/TE=4921 ms/100.4 ms). The QSM data were acquired using a 3D gradient-echo (GRE) sequence with the imaging parameters: TR/TE=98.1 ms/8 ms; FA, 12°; slice thickness, 0.7 mm; slice distance, 1.0 mm; FOV, 80×80 mm; QSM acquisition time, 5 min 48 s. We used ITK-SNAP_3.8 (http://www.itksnap.org/) software to draw the ROIs [10] and measure the susceptibility values of the hippocampus. Iron deposition in the hippocampus and liver by Prussian blue staining, and inflammatory cytokine and ferritin levels in the hippocampus were measured by ELISA. Student’s t-test and Mann-Whitney U (SPSS-23.0, IBM Corp., USA) tests were used for the analysis of changes in behavior, susceptibility values, and inflammation levels. Spearman's correlation analysis was used to determine associations between hippocampal susceptibility and latency time (time to reach the platform).Results
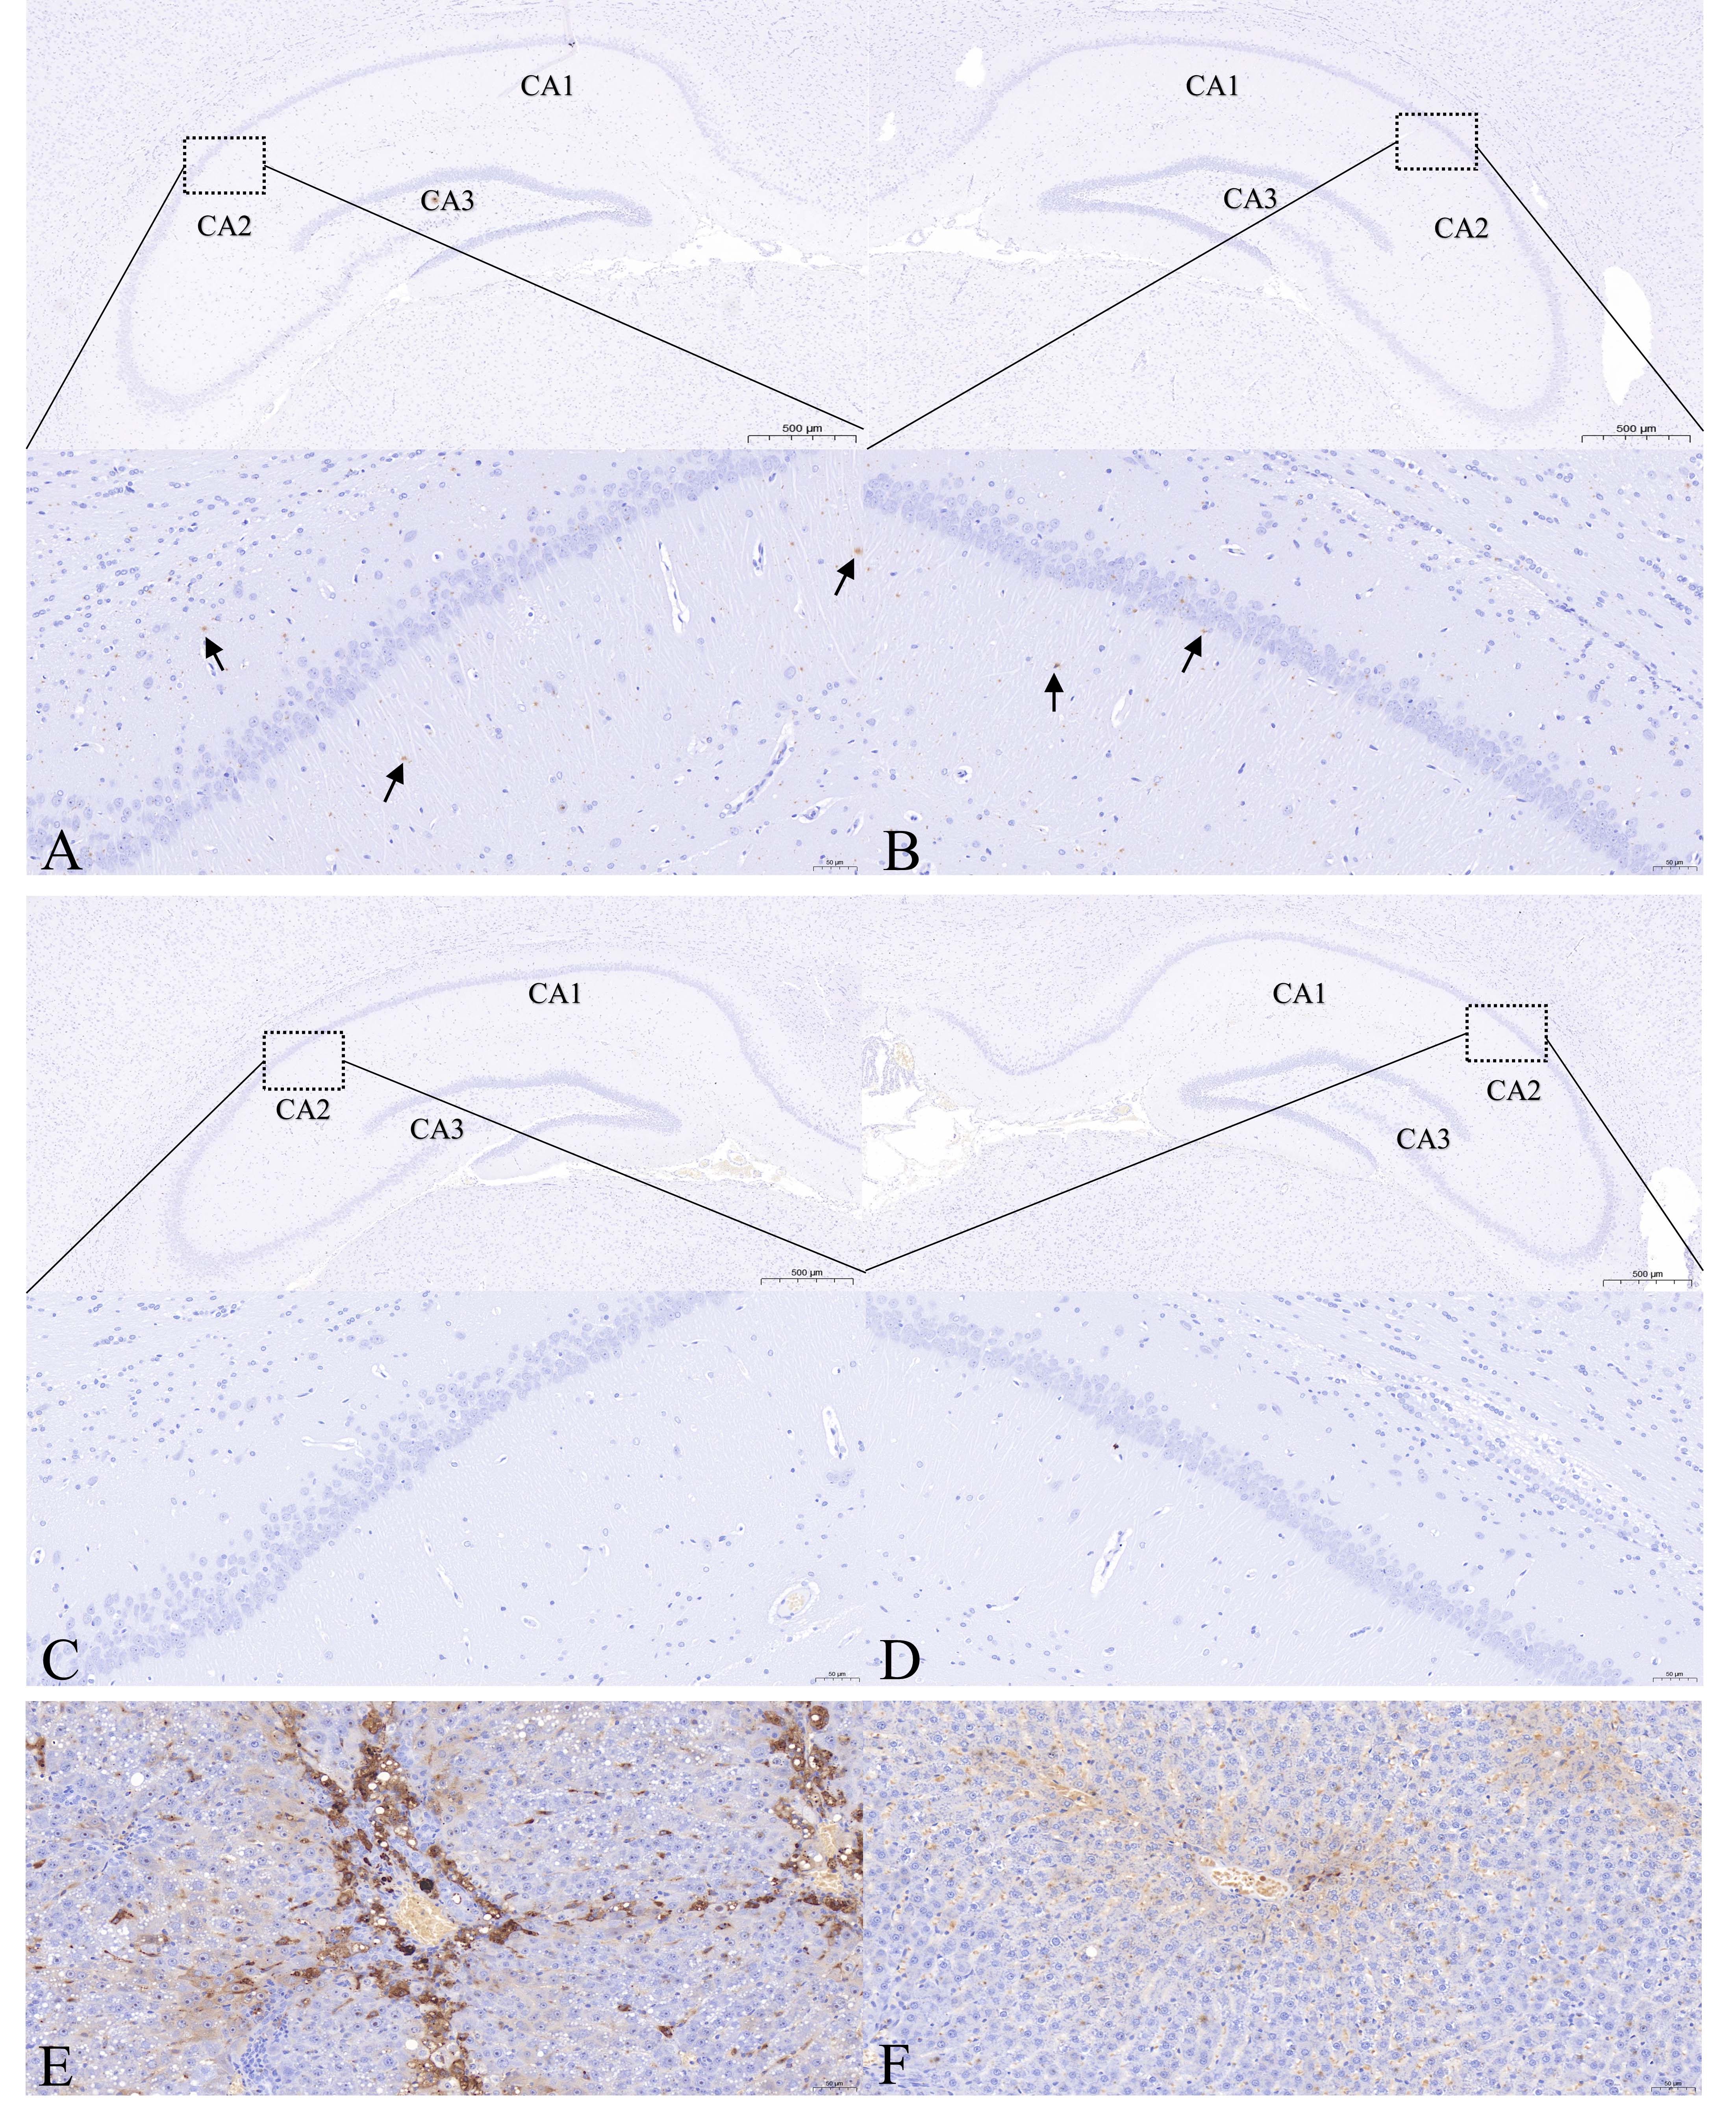
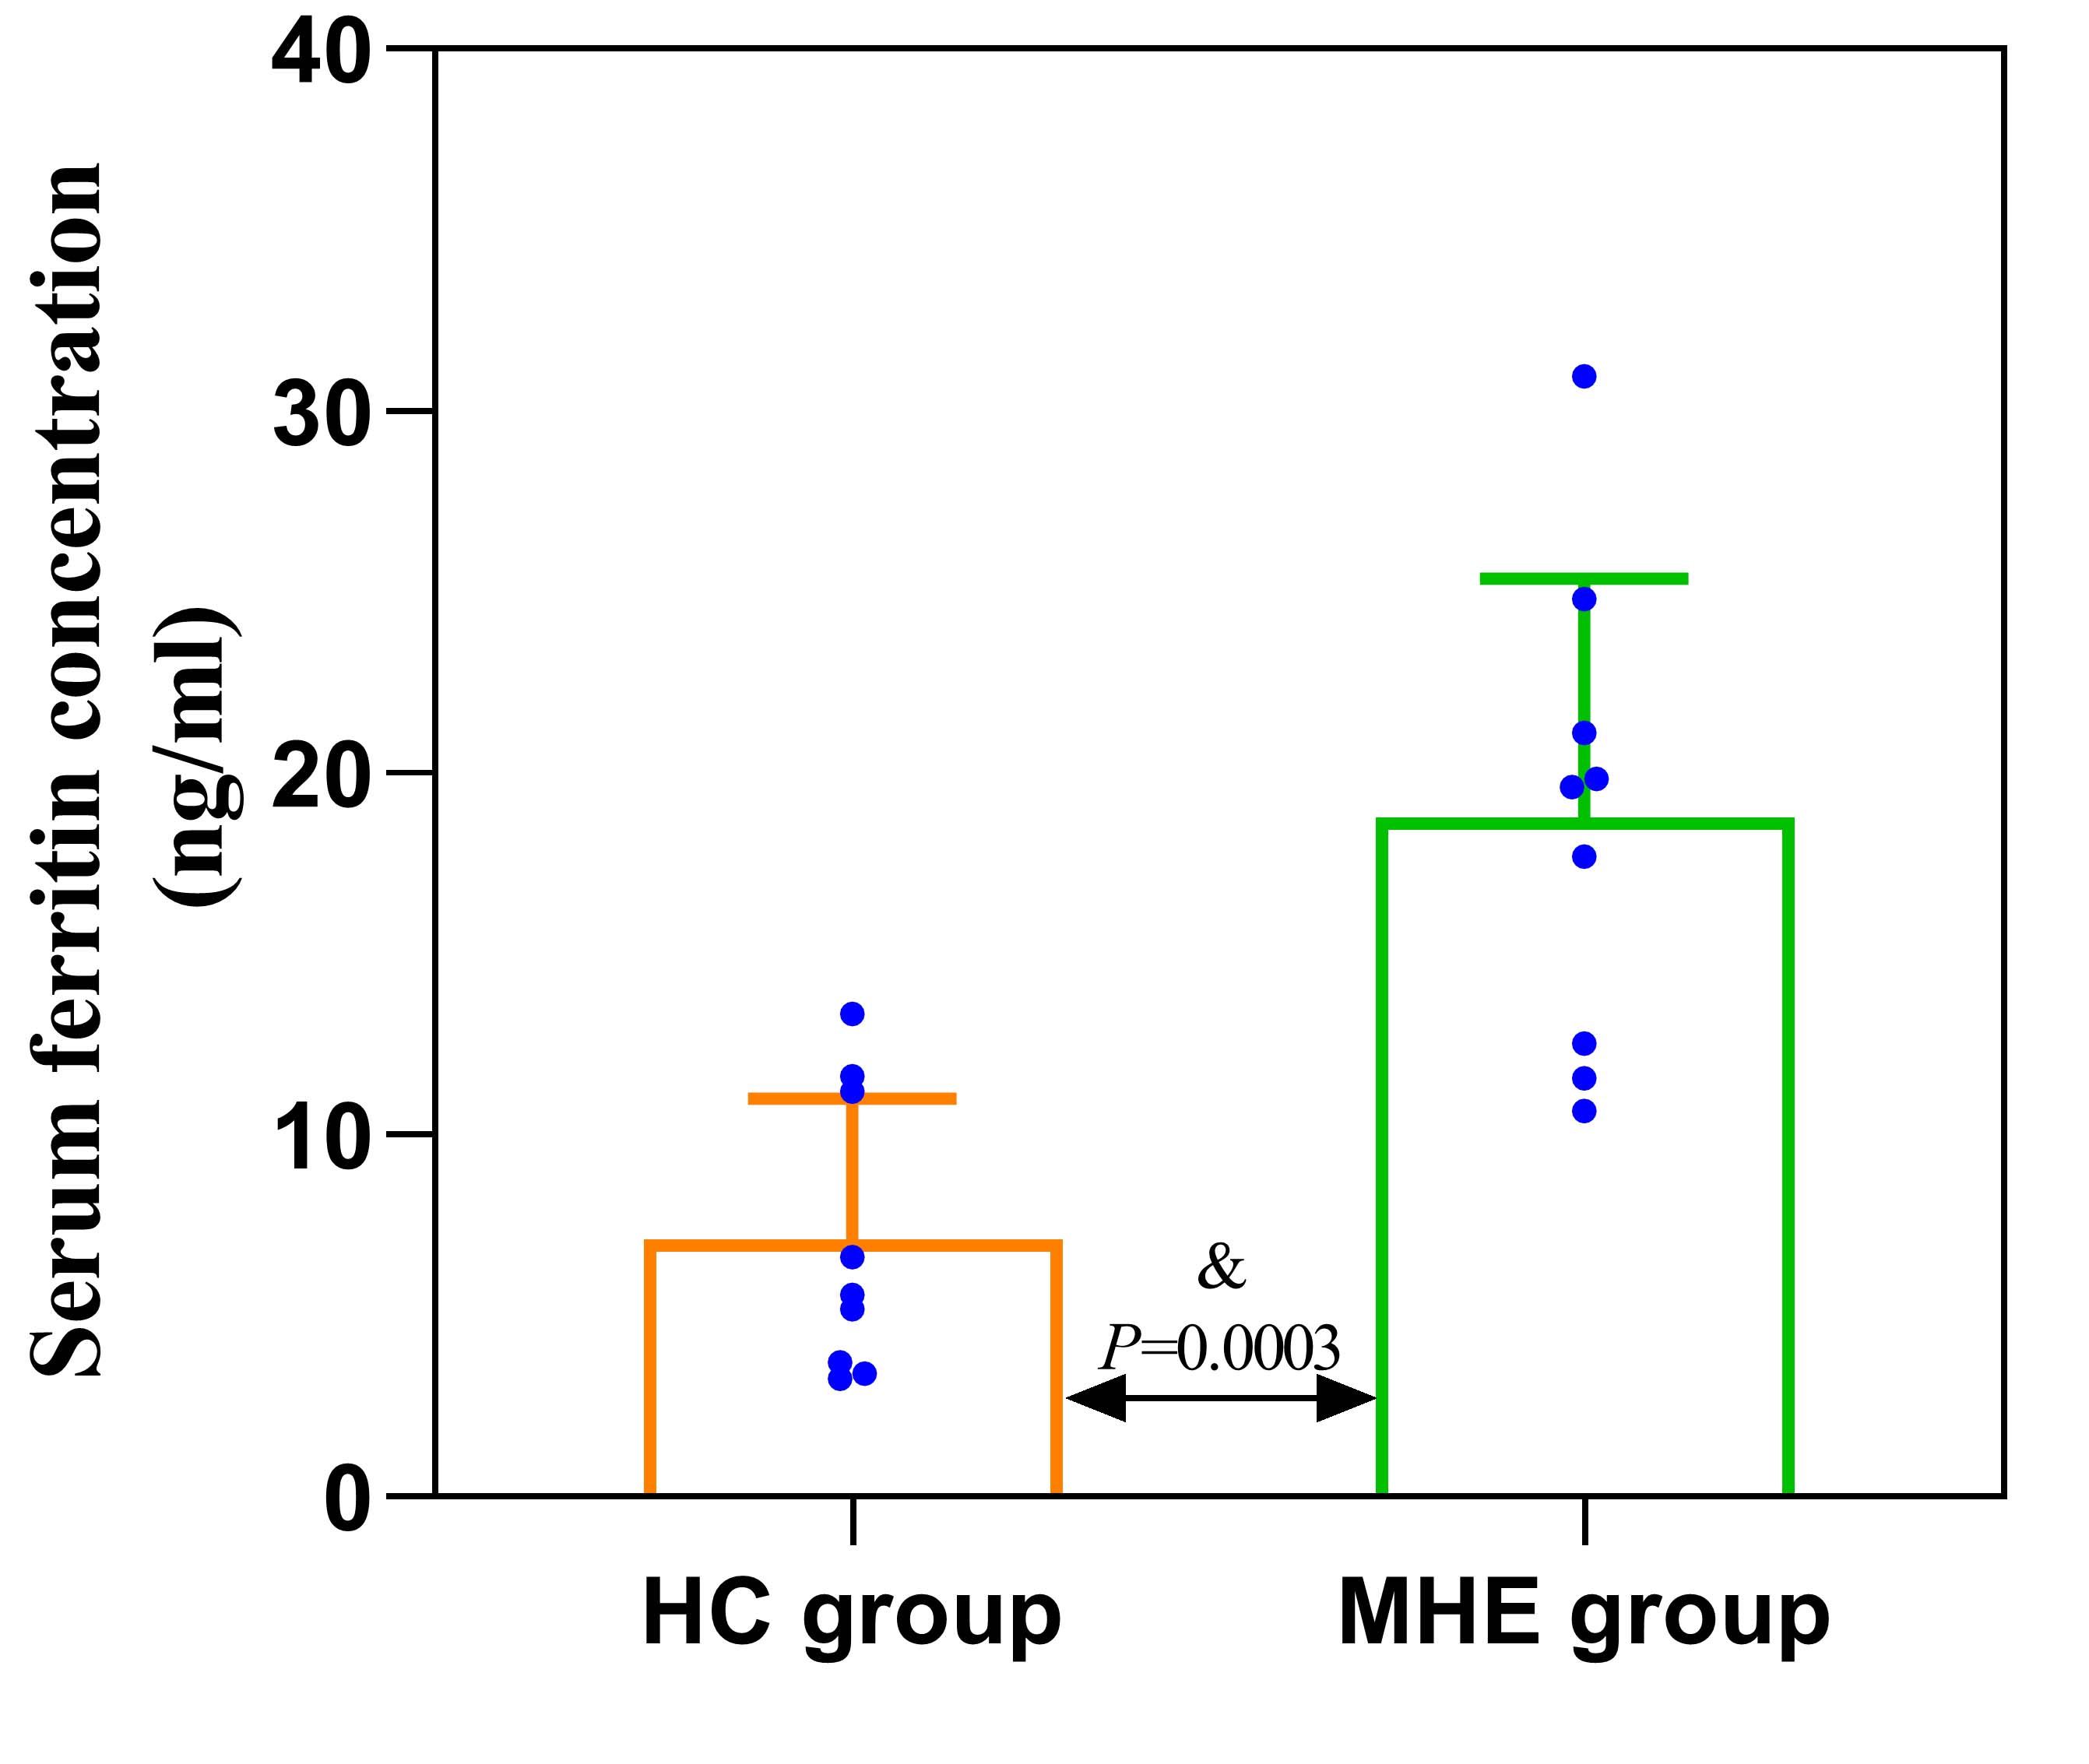
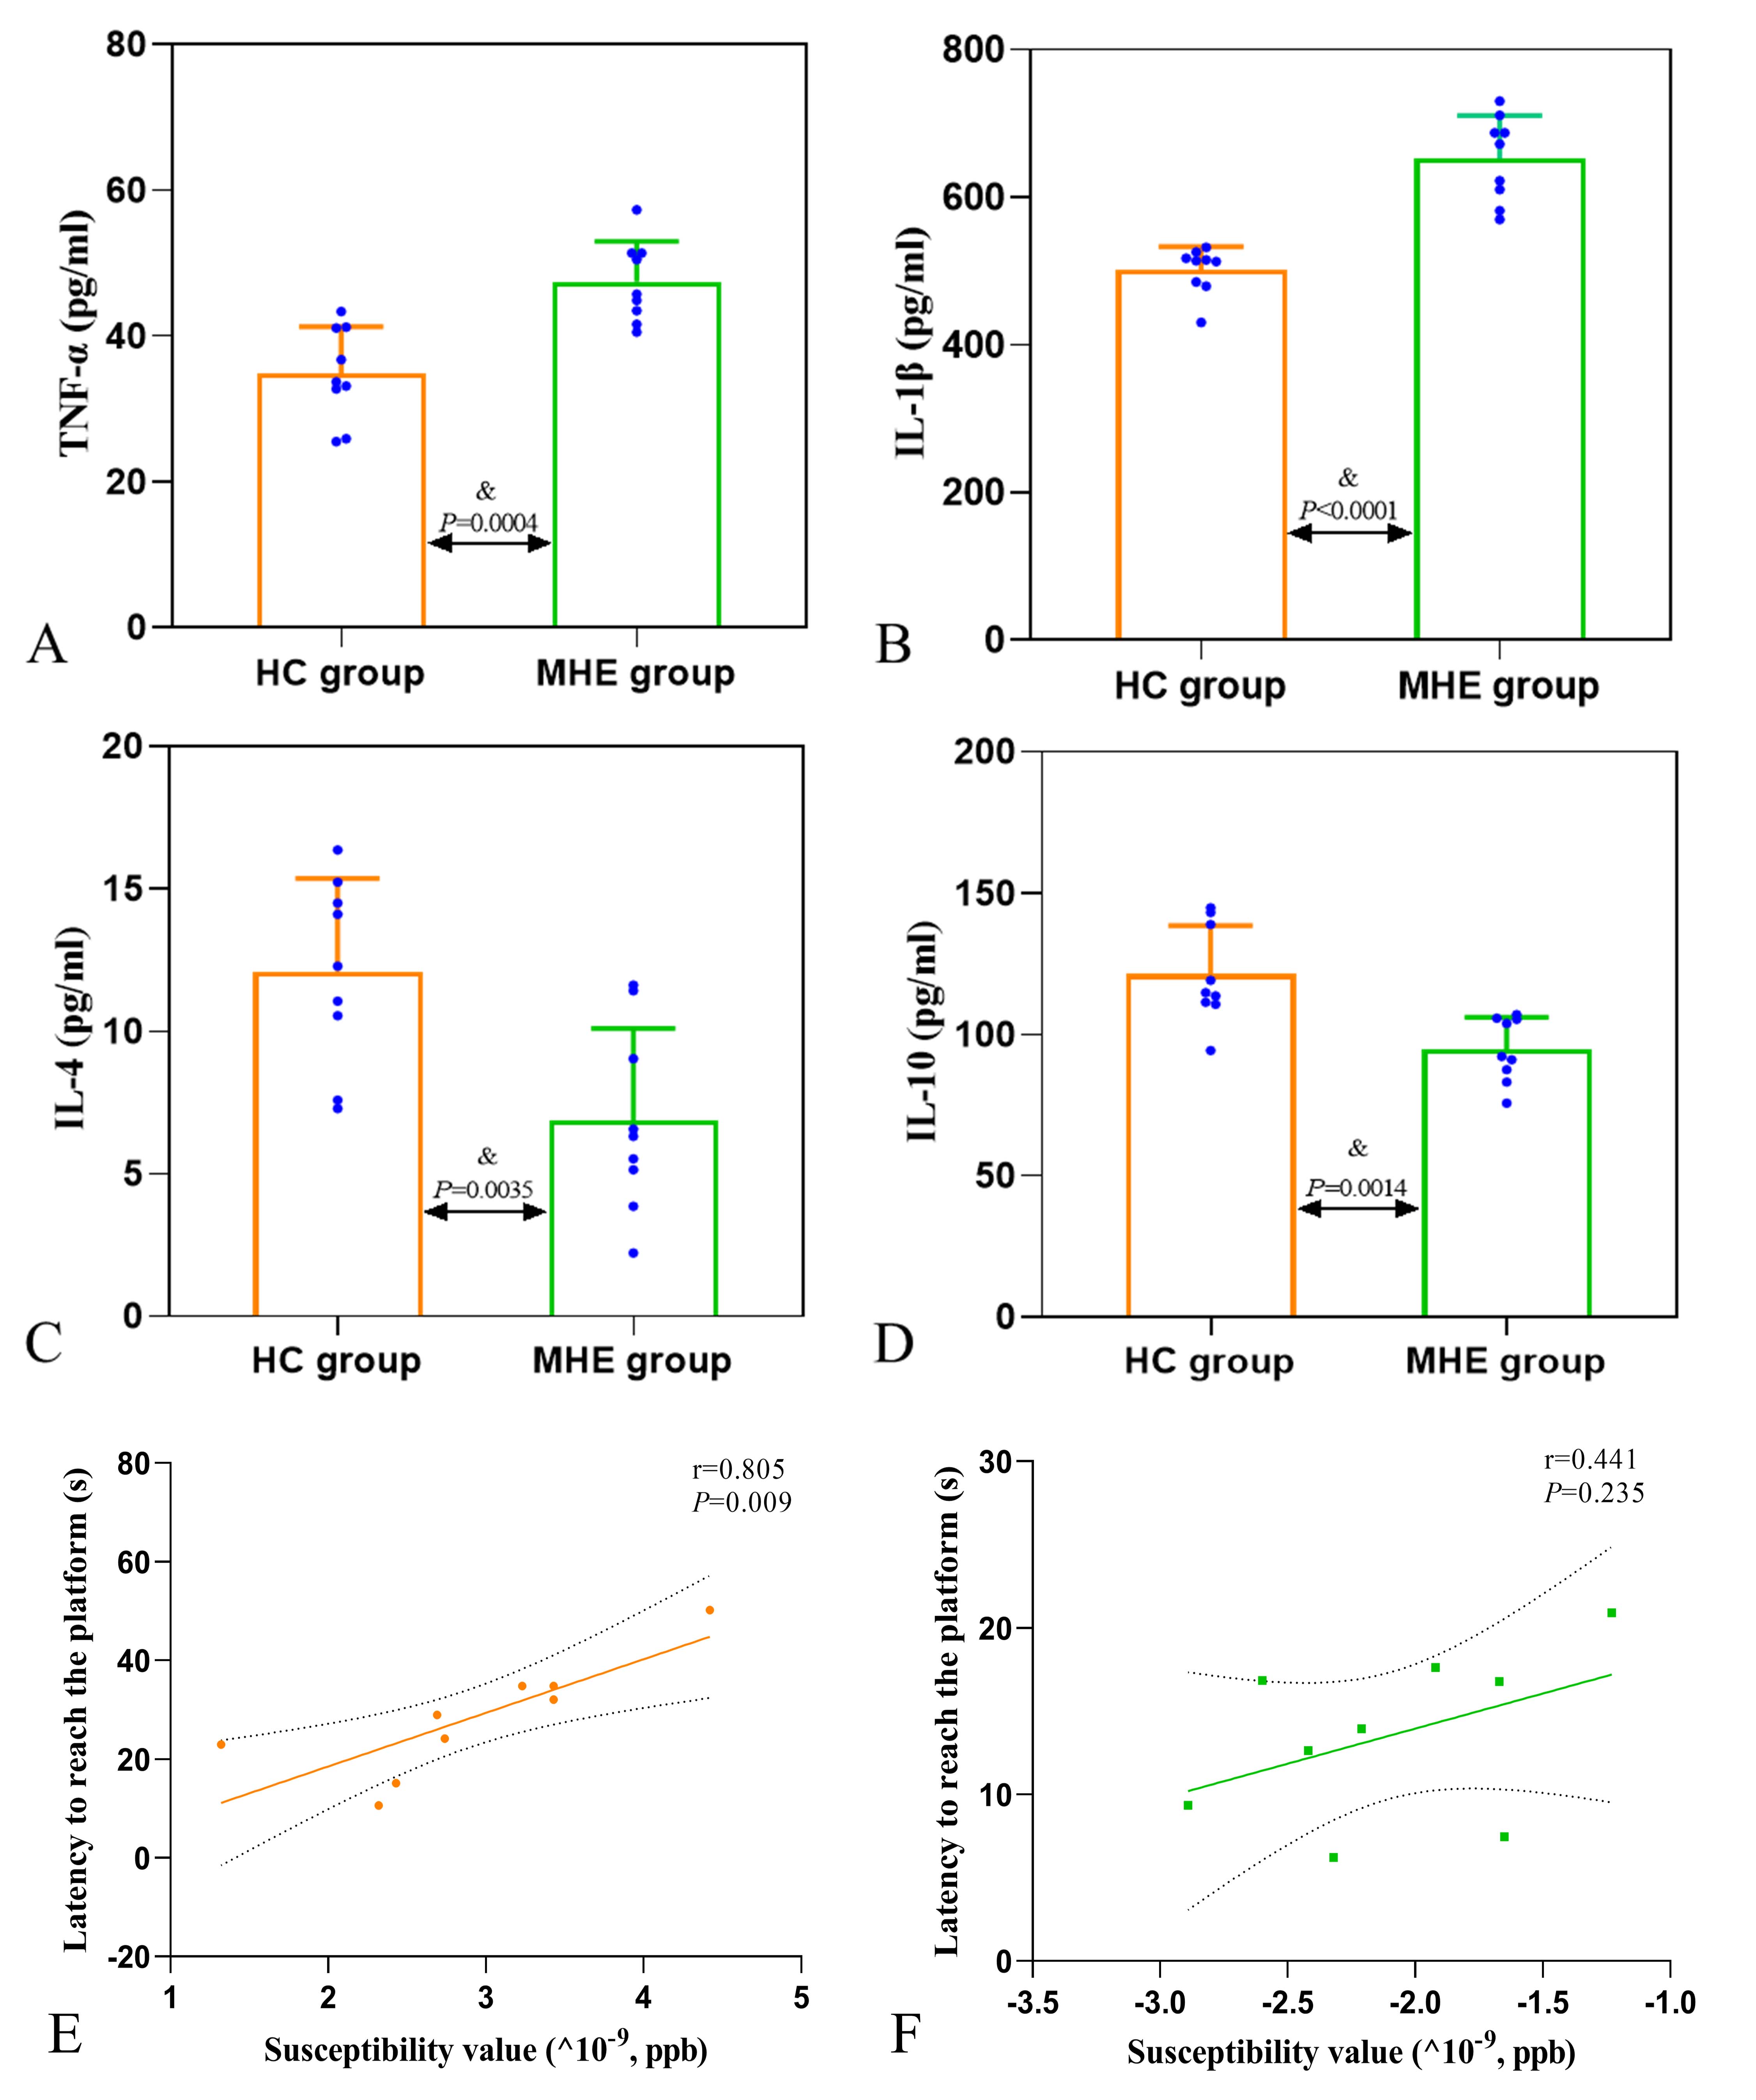
MHE rats showed impaired spatial memory (Fig.1). Brown granules indicative of iron were visible in the coronal brain sections stained with DAB-enhanced Prussian blue in the MHE hippocampi while no such granules were seen in the controls (Fig.3). Furthermore, large numbers of iron-associated brown granules were also observed in MHE rat livers, with only small amounts of iron seen in the controls and we also found that the serum ferritin levels in the MHE rats were significantly increased compared with the controls (Fig.3, 4). The bilateral hippocampal susceptibility values were significantly raised in MHE rats, together with evidence of neuroinflammation (increased pro- and decreased anti-) cytokine (Fig2, 5). Further analysis indicated good correlations between hippocampal susceptibility values with latency time in MHE but not in control rats.Discussion and Conclusion
Here, the effects of hippocampal iron deposition on cognitive function and its role in MHE were investigated. Iron is a trace element essential for the maintenance of normal cellular physiological functions but excess active iron in cells may lead to cytotoxicity through various mechanisms, including oxidative stress and the promotion of lipid peroxidation [11]. Our data demonstrated that abnormal increases in iron content in the hippocampal of the MHE rats (Fig. 2, 3). At the same time, we also observed significantly raised serum ferritin levels (Fig. 4). These data suggest peripheral iron metabolism dysfunction in MHE rats, which may be one of the initial causes of brain iron deposition. However, we assessed not only the iron content, but also its relationship with cognitive impairment. In addition, we also evaluated the neuroinflammatory response in the hippocampus of MHE rats. Such iron accumulation may result in cognition impairment by neuroinflammation-induced neurodegeneration [12-13], which is in accordance with our results. To conclude, our data support the contention that hippocampal tissue iron overload is a key mediator of the MHE-related neuroinflammatory response and impairment of spatial memory and exploratory behavior. The data also demonstrate the effectiveness of the QSM technique for assessing iron content, suggesting its potential as an imaging indicator for the diagnosis and treatment of MHE.Acknowledgements
The authors would like to thank the Natural Science Foundation of Ningxia (NO: 2022AAC03487) and Science and Technology Key Research Program of Ningxia (NO: 2019BEG03037).References
[1] C. Formentin, L. Zarantonello, C. Mangini, A.C. Frigo, S. Montagnese, C. Merkel. Clinical, neuropsychological and neurophysiological indices and predictors of hepatic encephalopathy (HE), Liver Int, 5 (2021) 1070-1082, https://doi.org/10.1111/liv.14785.
[2] T.H. Tranah, D.L. Shawcross, The rise and fall and rise again of ammonia as a therapeutic target in hepatic encephalopathy, Hepatology, (2022), https://doi.org/10.1002/hep.32319.
[3] A. Kato, H. Tanaka, T. Kawaguchi, H. Kanazawa, M. Iwasa, I. Sakaida, et al. Nutritional management contributes to improvement in minimal hepatic encephalopathy and quality of life in patients with liver cirrhosis: A preliminary, prospective, open-label study, Hepatol Res, 43 (2013) 452-458, https://doi.org/10.1111/j.1872-034X.2012.01092.x.
[4] J. Yang, M. Yin, Y. Hou, H. Li, Y. Guo, H. Yu, et al. Role of ammonia for brain abnormal protein glycosylation during the development of hepatitis B virus-related liver diseases, Cell Biosci, 12 (2022) 16, https://doi.org/10.1186/s13578-022-00751-4.
[5] D. Tran, P. DiGiacomo, D.E. Born, M. Georgiadis, M. Zeineh. Iron and Alzheimer's Disease: From Pathology to Imaging, Front Hum Neurosci, 16 (2022) 838692, https://doi.org/10.3389/fnhum.2022.838692.
[6] K.R. Li, J. Avecillas-Chasin, T.D. Nguyen, K.M. Gillen, A. Dimov, E. Chang, et al. Quantitative evaluation of brain iron accumulation in different stages of Parkinson's disease, J Neuroimaging, 32 (2022) 363-371, https://doi.org/10.1111/jon.12957.
[7] T. Harada, K. Kudo, N. Fujima, M. Yoshikawa, Y. Ikebe, R. Sato, et al. Quantitative Susceptibility Mapping: Basic Methods and Clinical Applications, Radiographics, 42 (2022) 1161-1176, https://doi.org/10.1148/rg.210054.
[8] B. Bilgic, A. Pfefferbaum, T. Rohlfing, E.V. Sullivan, E. Adalsteinsson. MRI estimates of brain iron concentration in normal aging using quantitative susceptibility mapping, Neuroimage, 59 (2012) 2625-35, https://doi.org/10.1016/j.neuroimage.2011.08.077.
[9] R.F. Butterworth, M.D. Norenberg, V. Felipo, P. Ferenci, J. Albrecht, A.T. Blei. Experimental models of hepatic encephalopathy: ISHEN guidelines, Liver Int, 29 (2009) 783-8, https://doi.org/10.1111/j.1478-3231.2009.02034.x.
[10] J. Li, Q. Zhang, N. Zhang, L. Guo, Increased Brain Iron Deposition in the Putamen in Patients with Type 2 Diabetes Mellitus Detected by Quantitative Susceptibility Mapping, J Diabetes Res, 2020 (2020) 1-11, https://doi.org/10.1155/2020/7242530.
[11] B.R. Stockwell, A.J. Friedmann, H. Bayir, A.I. Bush, M. Conrad, S.J. Dixon, et al. Ferroptosis: A Regulated Cell Death Nexus Linking Metabolism, Redox Biology, and Disease, Cell, 171 (2017) 273-285, https://doi.org/10.1016/j.cell.2017.09.021.
[12] L. Zecca, M. Gallorini, V. Schunemann, A.X. Trautwein, M. Gerlach, P. Riederer, et al. Iron, neuromelanin and ferritin content in the substantia nigra of normal subjects at different ages: consequences for iron storage and neurodegenerative processes, J Neurochem, 76 (2001) 1766-73, https://doi.org/10.1046/j.1471-4159.2001.00186.x.
[13] R.J. Ward, D.T. Dexter, R.R. Crichton. Iron, Neuroinflammation and Neurodegeneration, Int J Mol Sci, 23 (2022) 7267, https://doi.org/10.3390/ijms23137267.
Figures