0658
Diffusion MRI as a marker of neuroinflammation following intracerebral haemorrhage1Division of Neuroscience, School of Biological Sciences, Faculty of Biology, Medicine and Health, University of Manchester, Manchester Academic Health Science Centre, Manchester, M13 9PT, Manchester, United Kingdom, 2Geoffrey Jefferson Brain Research Centre, University of Manchester, Manchester Academic Health Science Centre, UK, Manchester, United Kingdom, 3Division of Psychology, Communication & Human Neuroscience, Faculty of Biology, Medicine and Health, The University of Manchester, UK, Manchester, United Kingdom, 4Division of Informatics, Imaging and Data Sciences, Faculty of Biology, Medicine and Health, University of Manchester, UK, Manchester, United Kingdom
Synopsis
Keywords: Stroke, Inflammation
Diffusion tensor imaging (DTI) and neurite orientation and density imaging (NODDI) is used to observe regional changes in brain microstructure following intracerebral haemorrhage (ICH) in rats. On day 7 following ICH, DTI and NODDI metrics were significantly altered in haemorrhaged sub-regions as well as healthy appearing overlying cortex, compared to contralateral tissue. Histological analysis suggest these changes are driven by altered cell density and populations, with notable regional changes in microglia/macrophages. In summary, DTI and NODDI parameters are altered in ICH and may reflect changes in the immune cell populations in both haemorrhaged and overlying normal-appearing cortex.Introduction
Macroscale imaging of neuroinflammation could be important for monitoring treatments aiming to dampen pro-inflammatory responses following stroke and other neuroinflammatory conditions. Neurite orientation dispersion and density imaging (NODDI) provides estimates of microstructural parameters associated with neural tissue by modelling the cellular environment as sticks (cell processes), cell bodies, and free water1. Given that immune cells change shape upon activation, particularly by changing the density of "stick-like" processes, NODDI may be highly sensitive to neuroinflammatory changes2,3. In this work, we apply diffusion tensor imaging (DTI) and NODDI to a rat model of intracerebral haemorrhage (ICH), and study how DTI and NODDI parameters vary in the haematoma core, border, and overlying cortex. To evaluate cell populations, we quantify total cell density using haematoxylin and eosin (H&E) staining and microglia and macrophages using Iba1 staining.Methods
Experimental model of ICHMale Sprague Dawley rats (300-450g) were used. ICH was induced by intrastriatal injection of 0.2 U type VII collagenase using a micropipette needle. MRI data were combined from 3 groups (ICH, ICH + conditioned medium, ICH + mesenchymal stem cells (MSCs)) of a neutral therapy study (n=12 per group). Histology data were combined from 3 groups of a similar neutral study (sham, ICH, ICH + conditioned medium; n=6 per group).
MRI
Rats were scanned with MRI on day 7 following experimental ICH. T2-TurboRARE scans were performed for segmentation of haematoma core and border, contralateral striatum, and ipsilateral and contralateral cortex ROIs. Diffusion MRI scans were acquired with the following parameters: TR/TE = 4200/33.4 ms, 2 EPI segments, FOV = 30x30 mm2, 30 contiguous coronal slices, voxel size of 0.31x0.31x1.0mm3, 40 gradient directions at b = 700 s/mm2, 60 gradient directions at b = 2000 s/mm2 and for each shell 5 b = 0 s/mm2 images.
FSL’s eddy_openmp was used to correct image artefacts associated with subject motion and eddy current-induced distortion. FSLs DTIFIT command was used to estimate mean diffusivity (MD) and fractional anisotropy (FA). The AMICO toolbox was used to fit the NODDI model to derive maps of orientation dispersion index (ODI), intracellular volume fraction (the "stick" fraction; FICVF), and isotropic diffusion fraction (FISO).
Histology
Brain sections were stained with H&E to visualise cell nuclei and Iba1 to stain microglia and macrophages. Total cell density was obtained using the brightfield fast cell count tool in QuPath-0.3.2 and results averaged across nine ROIs per brain region. Iba1 positive (Iba+) images were collected on a Zeiss Axioimager.D2 upright microscope and processed using ImageJ v1.53t. To quantify staining, mean integrated density was calculated and results averaged across six ROIs per region.
Statistical analysis
Data were analysed by paired one- or two-way ANOVA with Sidak’s or Tukey’s post hoc correction for multiple analyses, or paired t-tests.
Results
MD was significantly higher in haematoma core regions compared with border regions and contralateral striatum (Figure 1, p < 0.0001). FA was lower in both core and border regions relative contralateral striatum, with larger changes in the core (p < 0.0001). ODI was significantly elevated in both regions, however in contrast to FA, ODI changes were larger in the border (p < 0.0001). FISO was significantly elevated in both border and core regions (p < 0.0001). FICVF was lower in core regions and higher in border regions than contralateral striatum (p < 0.0001).H&E staining showed higher total cell density in the haematoma border regions (215% higher) and lower cell density in the haematoma core (51% lower), compared with contralateral striatum. Iba+ staining followed the same pattern. In contralateral regions, Iba+ cells were ramified indicative of resting microglia, whilst in border regions, cells were tightly packed, hypertrophic and amoeboid in shape, indicative of activated microglia. In haematoma core regions Iba+ staining was more diffuse and suggested loss of normal cell structure.
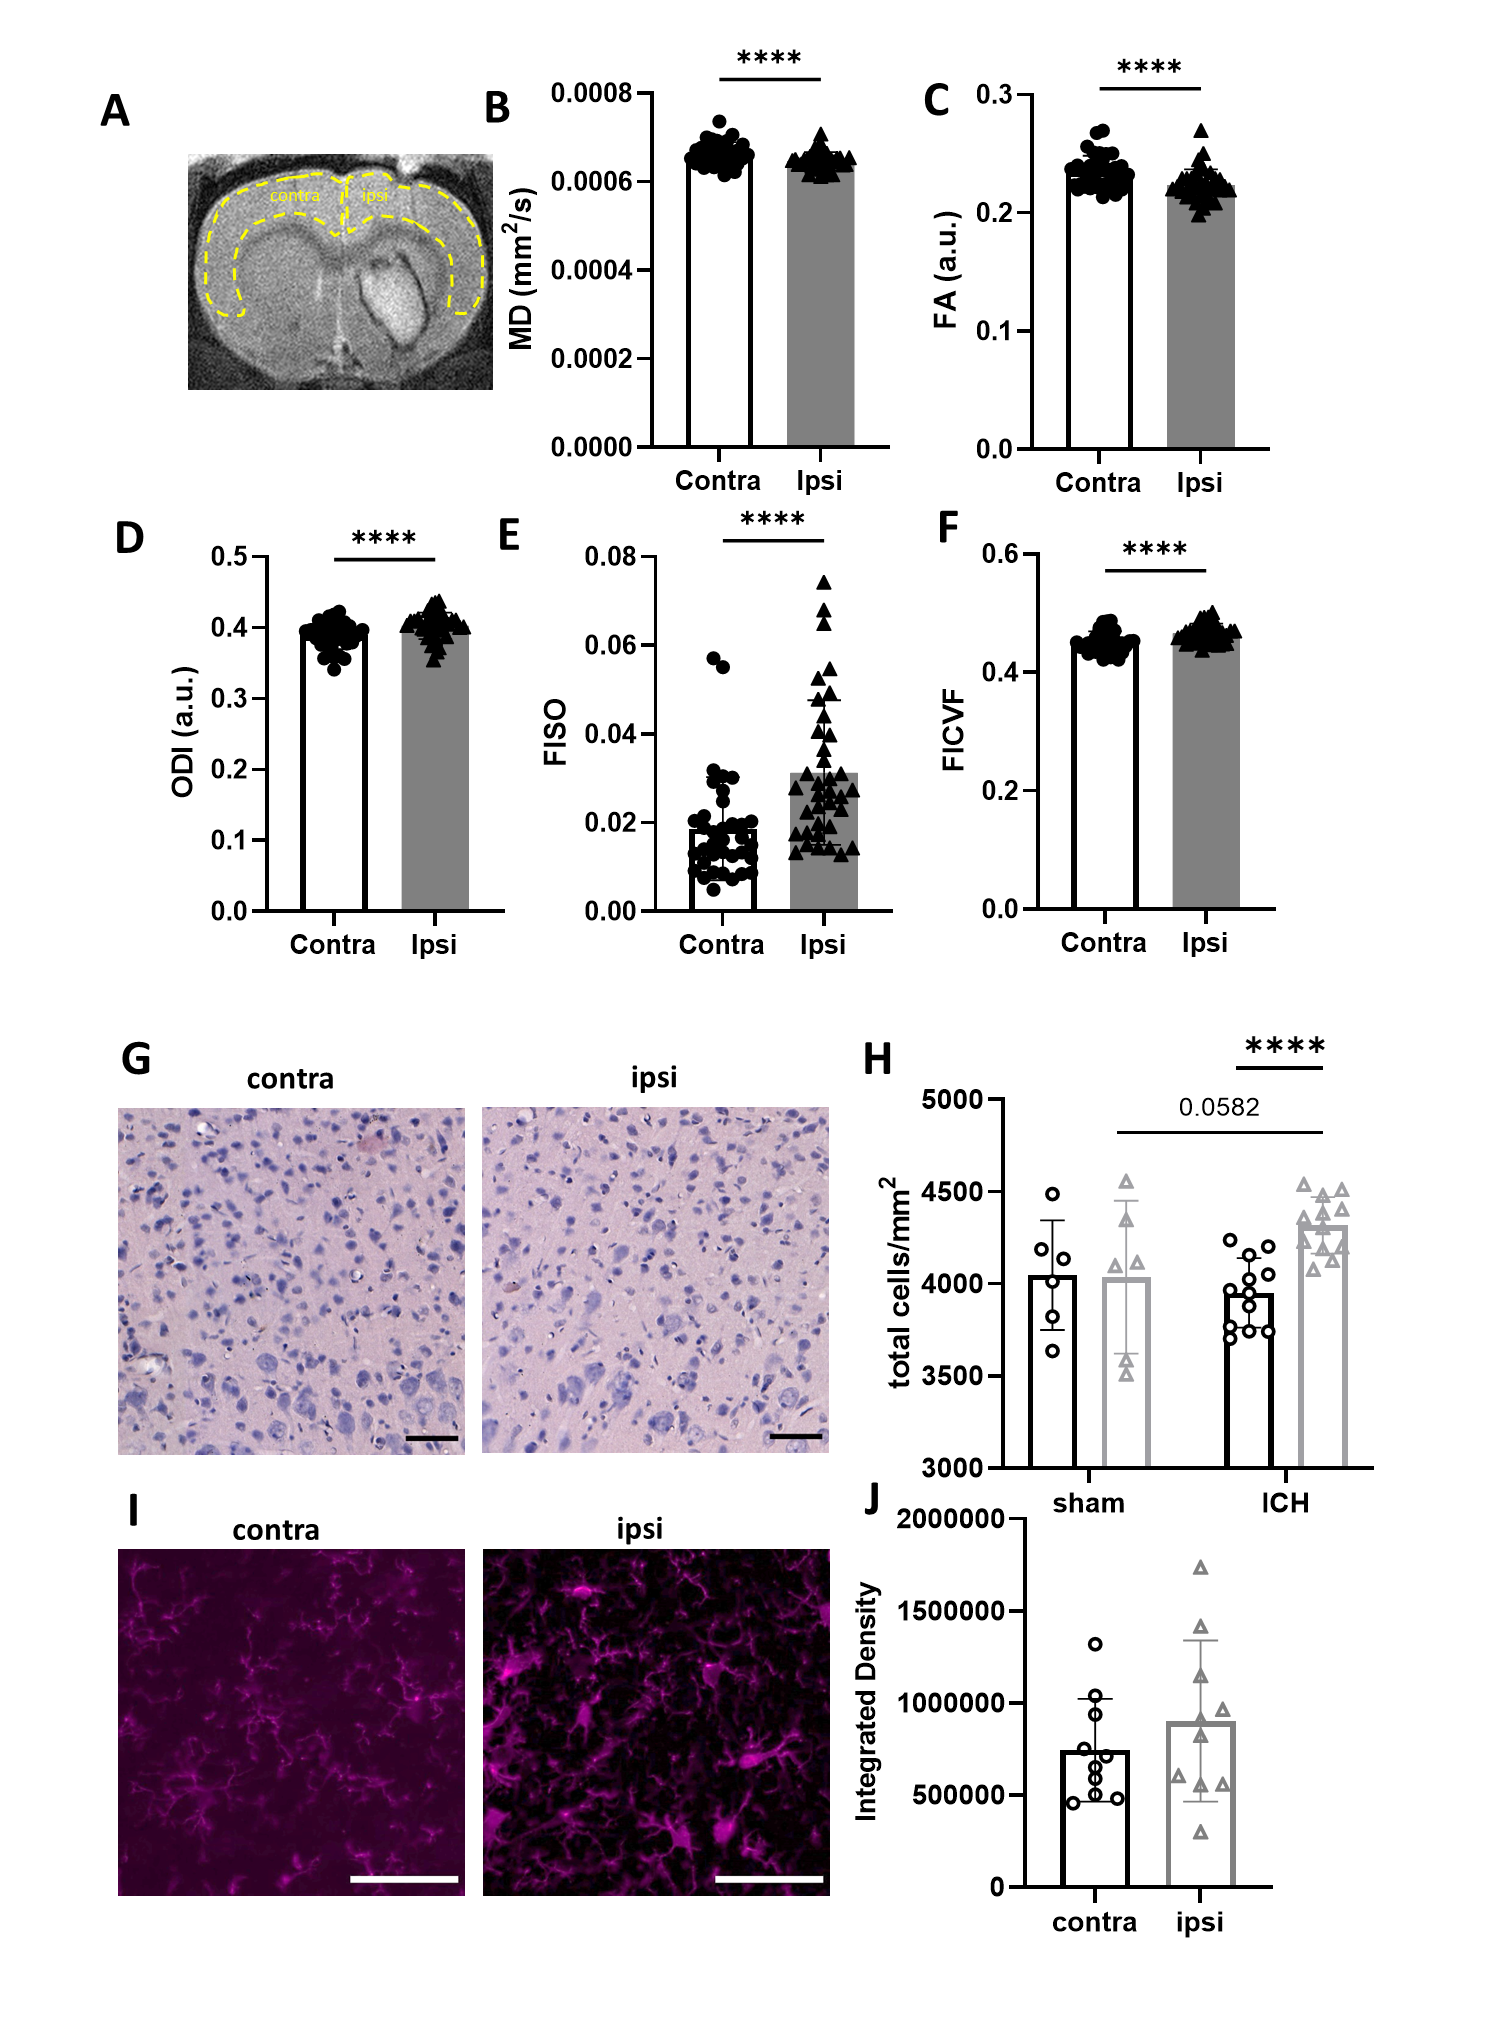
MD and FA were significantly lower in the ipsilateral cortex compared with contralateral cortex (Figure 2, p < 0.0001) while ODI, FISO and FICVF were higher (p < 0.0001). Total cell density was modestly increased in ipsilateral cortex compared with corresponding contralateral regions (p < 0.0001). There was a trend to increased Iba+ staining in ipsilateral cortex (p = 0.09). In cortical tissue, Iba+ cells had ramified morphologies.
Discussion
Diffusion MRI detected increased diffusion dispersion, increased free water, and reductions in "stick-like" processes (reduced FICVF) in the haematoma core, which was associated with lower overall cell density, including immune cells, relative to contralateral striatum. In the border, higher FICVF was observed, reflecting a higher density of "stick-like" processes. Increased Iba1 staining appeared to contradict these findings, showing an increase in activated immune cells, void of stick-like processes. It is possible that another cell type not measured here was present in the border region, such as activated astrocytes, which exhibit a hyper-ramified appearance upon activation [4]. Alternatively, the tight packing of microglia/macrophages may give rise to thin extracellular spaces that mimic diffusion in stick-like processes. In healthy appearing ipsilateral cortex, diffusion was less directional and had increased "stick-like" processes, possibly reflective of an increase in ramified immune cells or reactive astrocytes [4]. In summary we have investigated DTI and NODDI metrics post ICH and evaluated how these metrics associate with neuroinflammatory changes.Acknowledgements
JT is funded through an Engineering and Physical Science Research Council (EPSRC, UK) and Medical Research Council (MRC, UK) Centre for Doctoral Training in Regenerative Medicine Studentship Grant [No. EP/L014904/1].References
[1] Zhang H, Schneider T, Wheeler-Kingshott CA, Alexander DC. NODDI: practical in vivo neurite orientation dispersion and density imaging of the human brain. Neuroimage. 2012 Jul 16;61(4):1000-16.
[2] Yi SY, Barnett BR, Torres-Velázquez M, Zhang Y, Hurley SA, Rowley PA, Hernando D, Yu JP. Detecting microglial density with quantitative multi-compartment diffusion MRI. Frontiers in neuroscience. 2019 Feb 19;13:81.
[3] Garcia-Hernandez R, Cerdán Cerdá A, Trouve Carpena A, Drakesmith M, Koller K, Jones DK, Canals S, De Santis S. Mapping microglia and astrocyte activation in vivo using diffusion MRI. Science Advances. 2022 May 27;8(21):eabq2923.
[4] Pekny M, Pekna M. Astrocyte reactivity and reactive astrogliosis: costs and benefits. Physiological reviews. 2014 Oct;94(4):1077-98.
[5] Neves JD, Mestriner RG, Netto CA. Astrocytes in the cerebral cortex play a role in the spontaneous motor recovery following experimental striatal hemorrhage. Neural Regeneration Research. 2018 Jan;13(1):67.
Figures
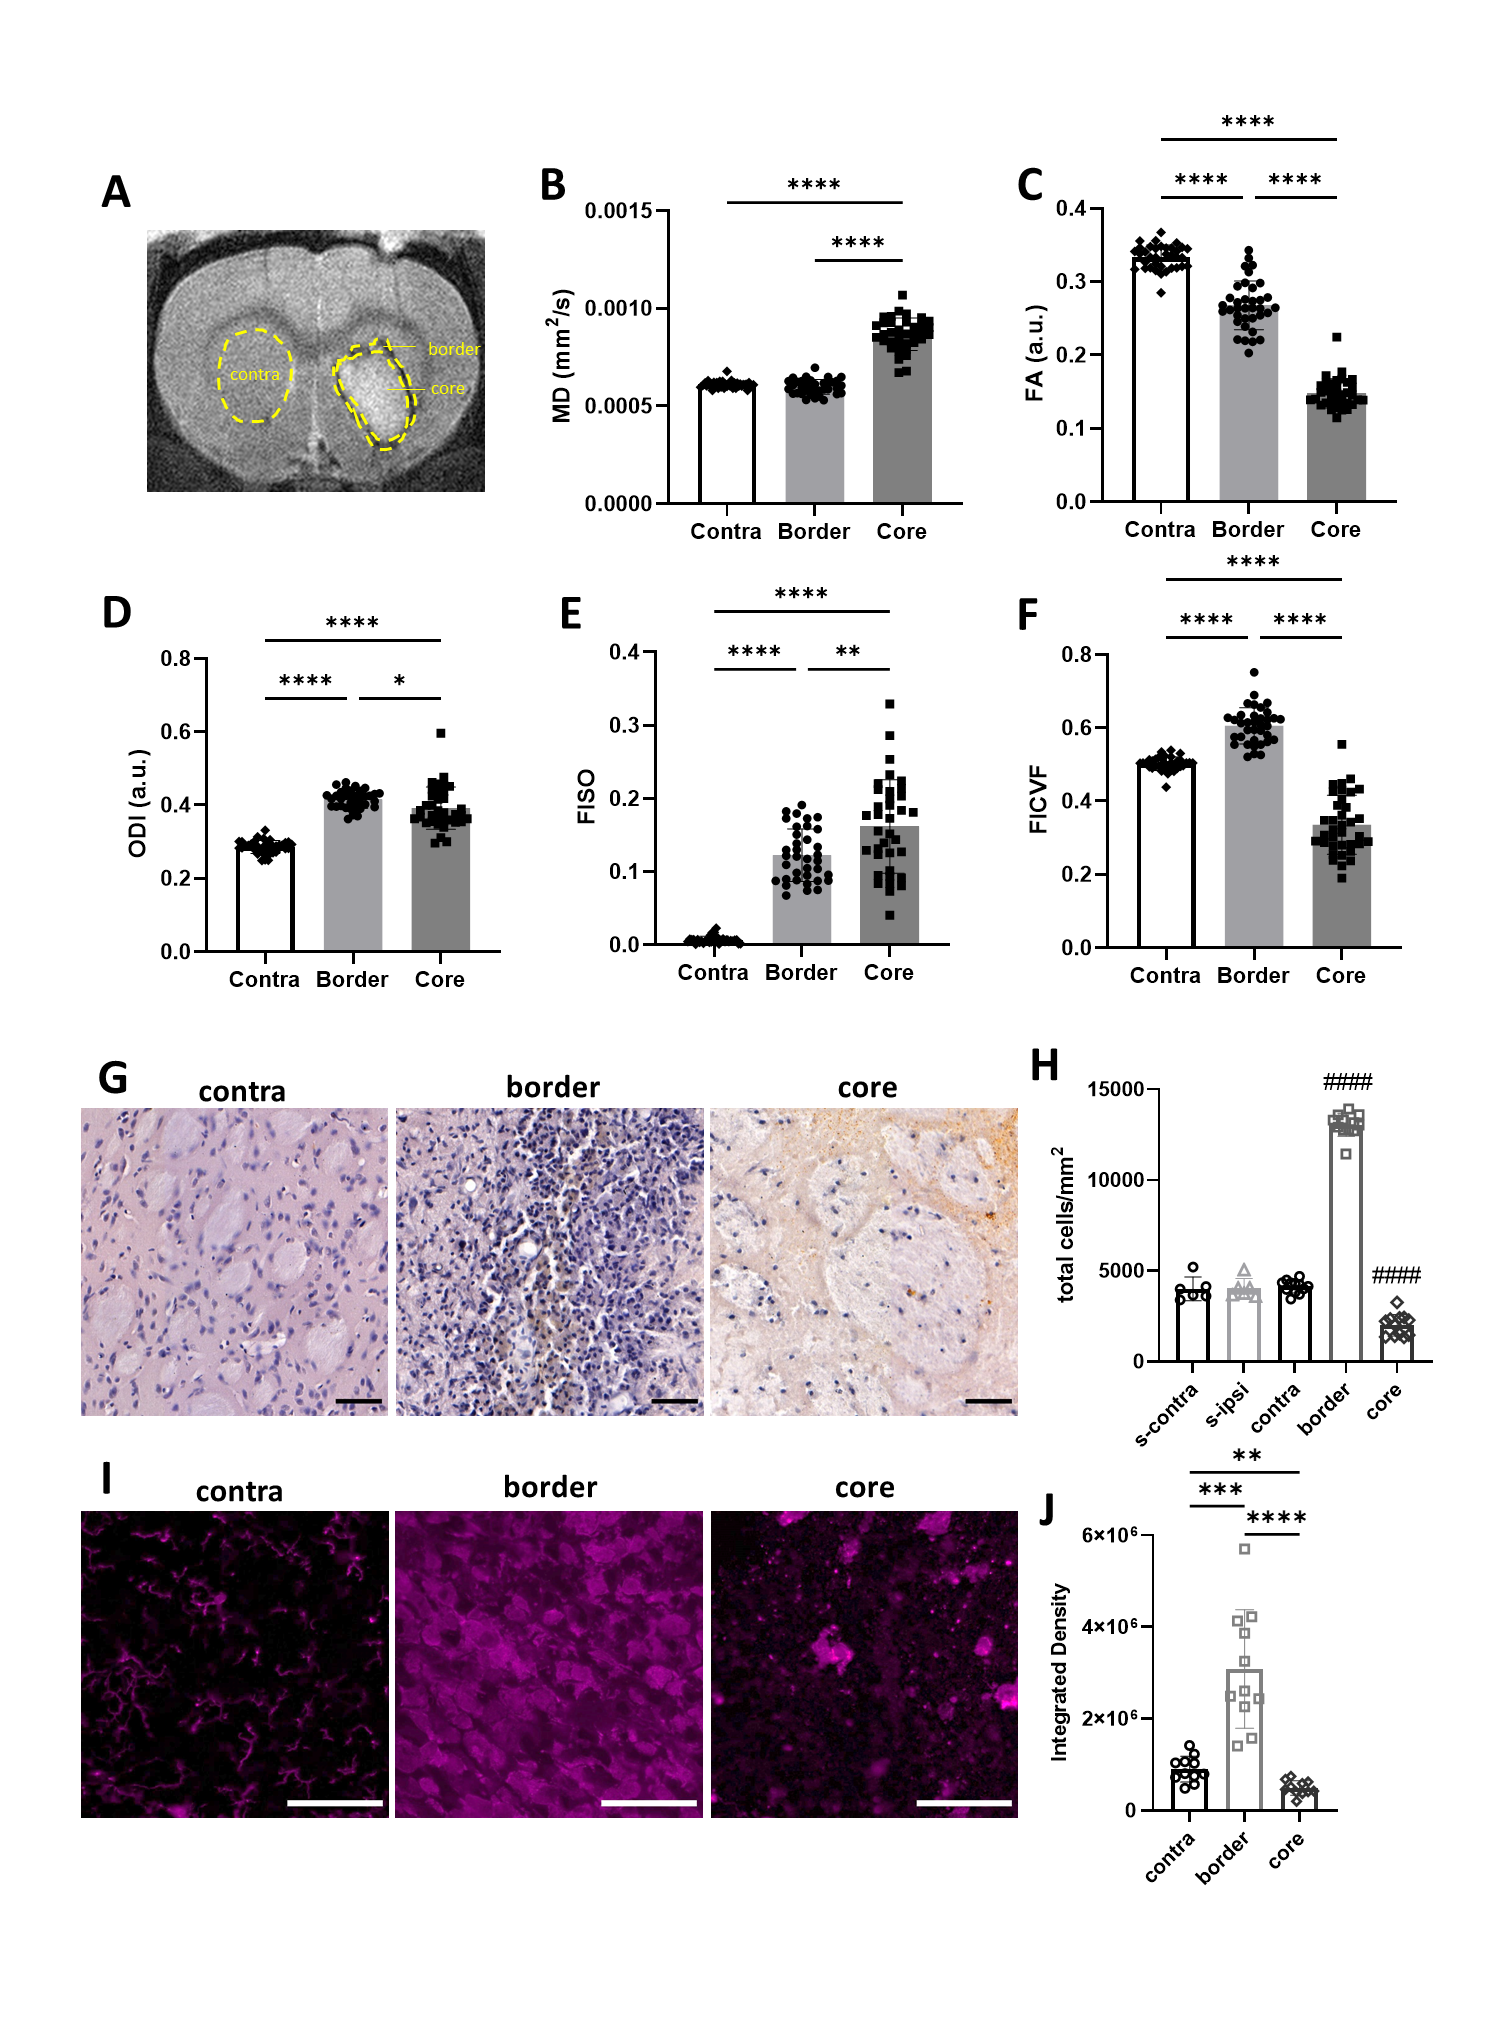
Figure 1. Microstructural changes in striatal tissue. (A) Regions of interest (ROI) were manually masked. (B-F) Values were extracted for MD, FA, ODI, FISO and FICVF. (G-H) Histological staining was used to visualise cell density. Data from sham animals were included for comparison with ICH animals (s-ipsi, s-contra). (I-J) Sections were stained and quantified for Iba+ cells. Data are presented as mean ± standard deviation. * p < 0.05, ** p < 0.01, *** p < 0.001, **** p < 0.0001, #### p < 0.0001 compared with ICH contralateral striatum. Representative images shown, scale bars 50 µm.