0657
DGE MRI detects altered glucose uptake and utilization upon microglia activation in Alzheimer’s disease1Department of Biomedical Engineering, City University of Hong Kong, Hong Kong, China, 2Hong Kong Centre for Cerebro-Cardiovascular Health Engineering (COCHE), Hong Kong, China, 3School of Chinese Medicine, Hong Kong Baptist University, Hong Kong, China, 4Russell H. Morgan Department of Radiology and Radiological Science, The Johns Hopkins University School of Medicine, Baltimore, MD, United States, 5City University of Hong Kong Shenzhen Research Institute, Shenzhen, China, 6Tung Biomedical Science Centre, City University of Hong Kong, Hong Kong, China
Synopsis
Keywords: Alzheimer's Disease, Neuroscience
Immune cell activation is a hallmark of Alzheimer’s disease (AD). Microglia activation impairs with glucose metabolism, which may serve as early biomarker for AD. Here, we employed dynamic glucose-enhanced (DGE)-MRI to assess glucose uptake and clearance in AD, and study its relationship with microglia based on our previous study. We observed an increase in microglia in AD than WT, accompanied with relatively high parenchymal glucose uptake and low CSF clearance. We believe further studies to associate the underlying molecular and cellular pathology of AD with DGE-MRI could benefit the identification of AD in early stages.
Introduction
The activation of immune cells is a hallmark of Alzheimer’s disease (AD), especially the microglia1,2. Microglia, one of the most commonly seen cerebral resident cells, facilitated active immune defence in CNS. Based on the cell activation status, microglia could be either pro-inflammatory or anti-inflammatory3. Recently, enhanced glucose metabolism and uptake were observed in activated microglia in AD animal model4,5. These distinct glucose alterations may serve as biomarker for early diagnosis in AD. We recently showed the feasibility of using dynamic glucose-enhance (DGE)-MRI in detecting glucose changes in vivo6,7. By injecting natural D-glucose, we would observe the uptake and clearance rate in both brain parenchyma and cerebrospinal fluid (CSF) that could reflect the glucose related events and its metabolism. In this study, we employed DGE-MRI to assess the glucose uptake and utilization in AD, and studied its relationship with immune cells based on our previous study6. Microglia and other CNS-invading myeloid cells will be quantified. Activated microglia has a higher expression of CD452. Proportion and activation of CD11b+CD45lo microglia and other CNS-invading myeloid cells will be quantified by flow cytometry in APP/PS1 AD model and their littermates. This preliminary result could further support the DGE-MRI findings and related underlying neuropathology.Methods
All animal experiments were approved by the Animal Ethics Committee and followed the guidelines of Laboratory Animal Research Unit at City University of Hong Kong. APP/PS1 mice (n = 3) and their littermates (n = 3) at 6 months old were used in this study. Mouse was anesthetized by isoflurane during MRI scanning. DGE-MRI was performed as we reported previously at 3 T Bruker BioSpec system (Bruker, Germany)4,5. In general, the signal was measured by the onVDMP sequence. Acquisition parameters are as followings:TR/TE = 2.5 s/4.75 ms, RARE factor = 32, slice thickness = 2 mm, a matrix size of 96 x 96 within a FOV of 18 x 18 mm2. CSF and parenchyma images were acquired alternatively (15s per image). Baseline was obtained for 7 minutes followed by 47 minutes acquisition post 50% D-glucose intravenously injection. The kinetic curve was constructed as:
$$$
\triangle S(t) = \frac{S_{base} - S_{(t)}} {S_{base}}
$$$
For the microglia experiment, mouse were sacrificed with CO2 and transcranial perfused with PBS. Subsequently, mouse brains were dissected and minced, and incubated with collagenase for tissue digestion. Cerebral cells were collected after centrifuge. We used cell viability kit for distinguishing dead cells from live cells, Fc blocker to minimize non-specific antibody binding and mouse antibodies to CD45, CD11b for the flow cytometry analysis by flow cytometer (BD FACSVerseTM Cell Analyzer).
Results
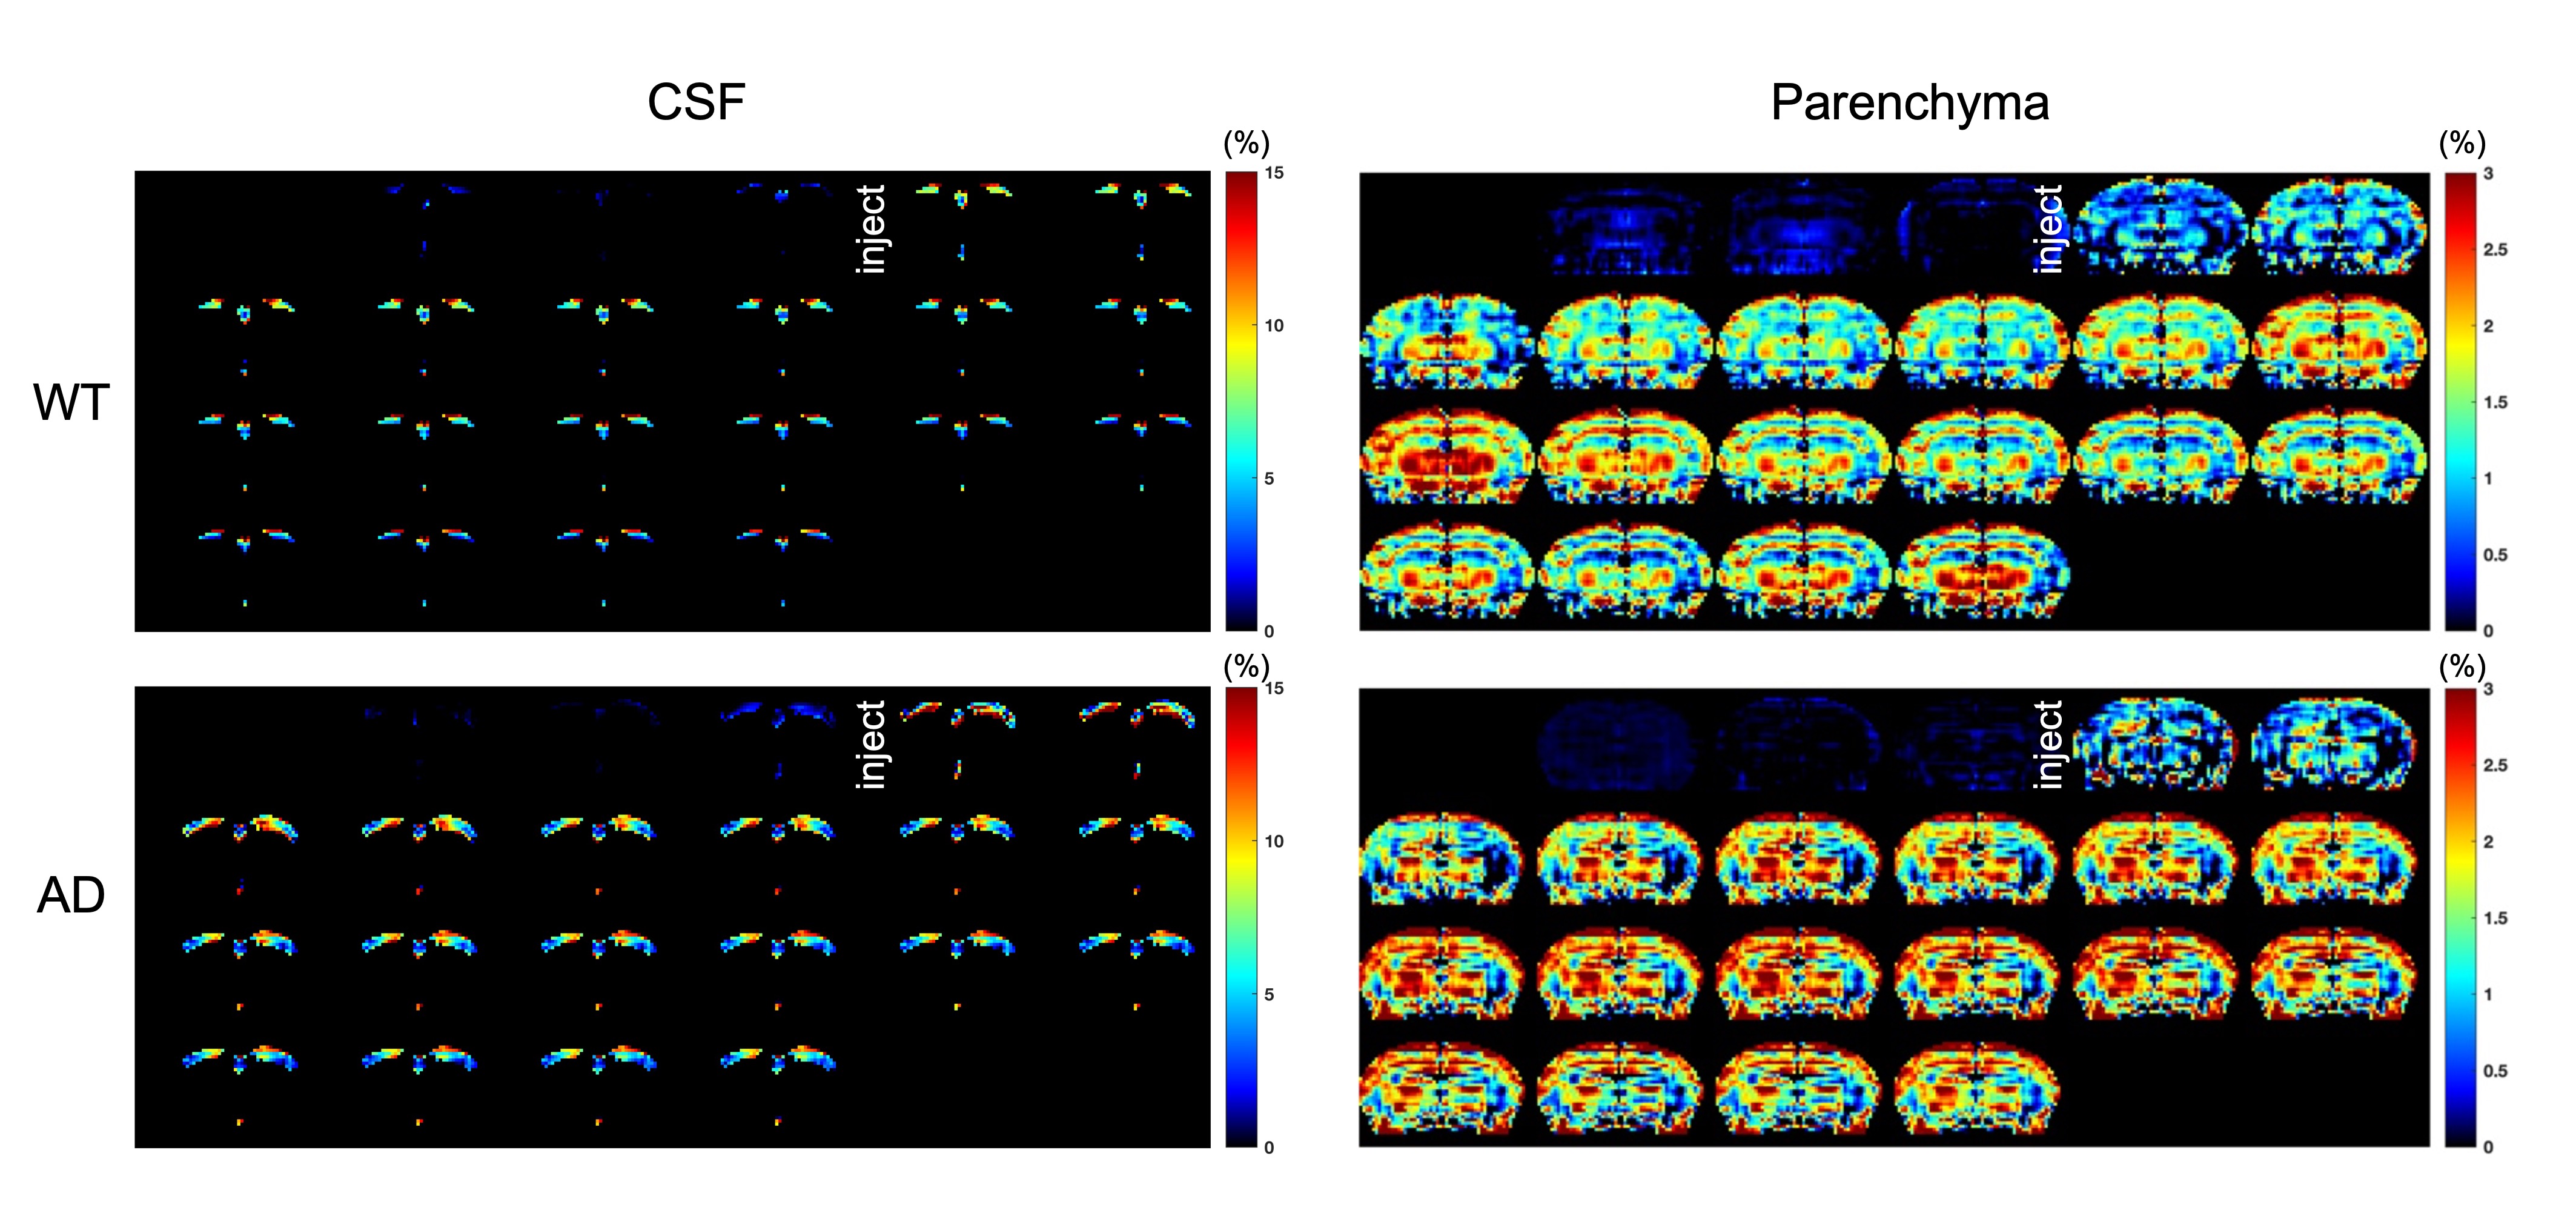
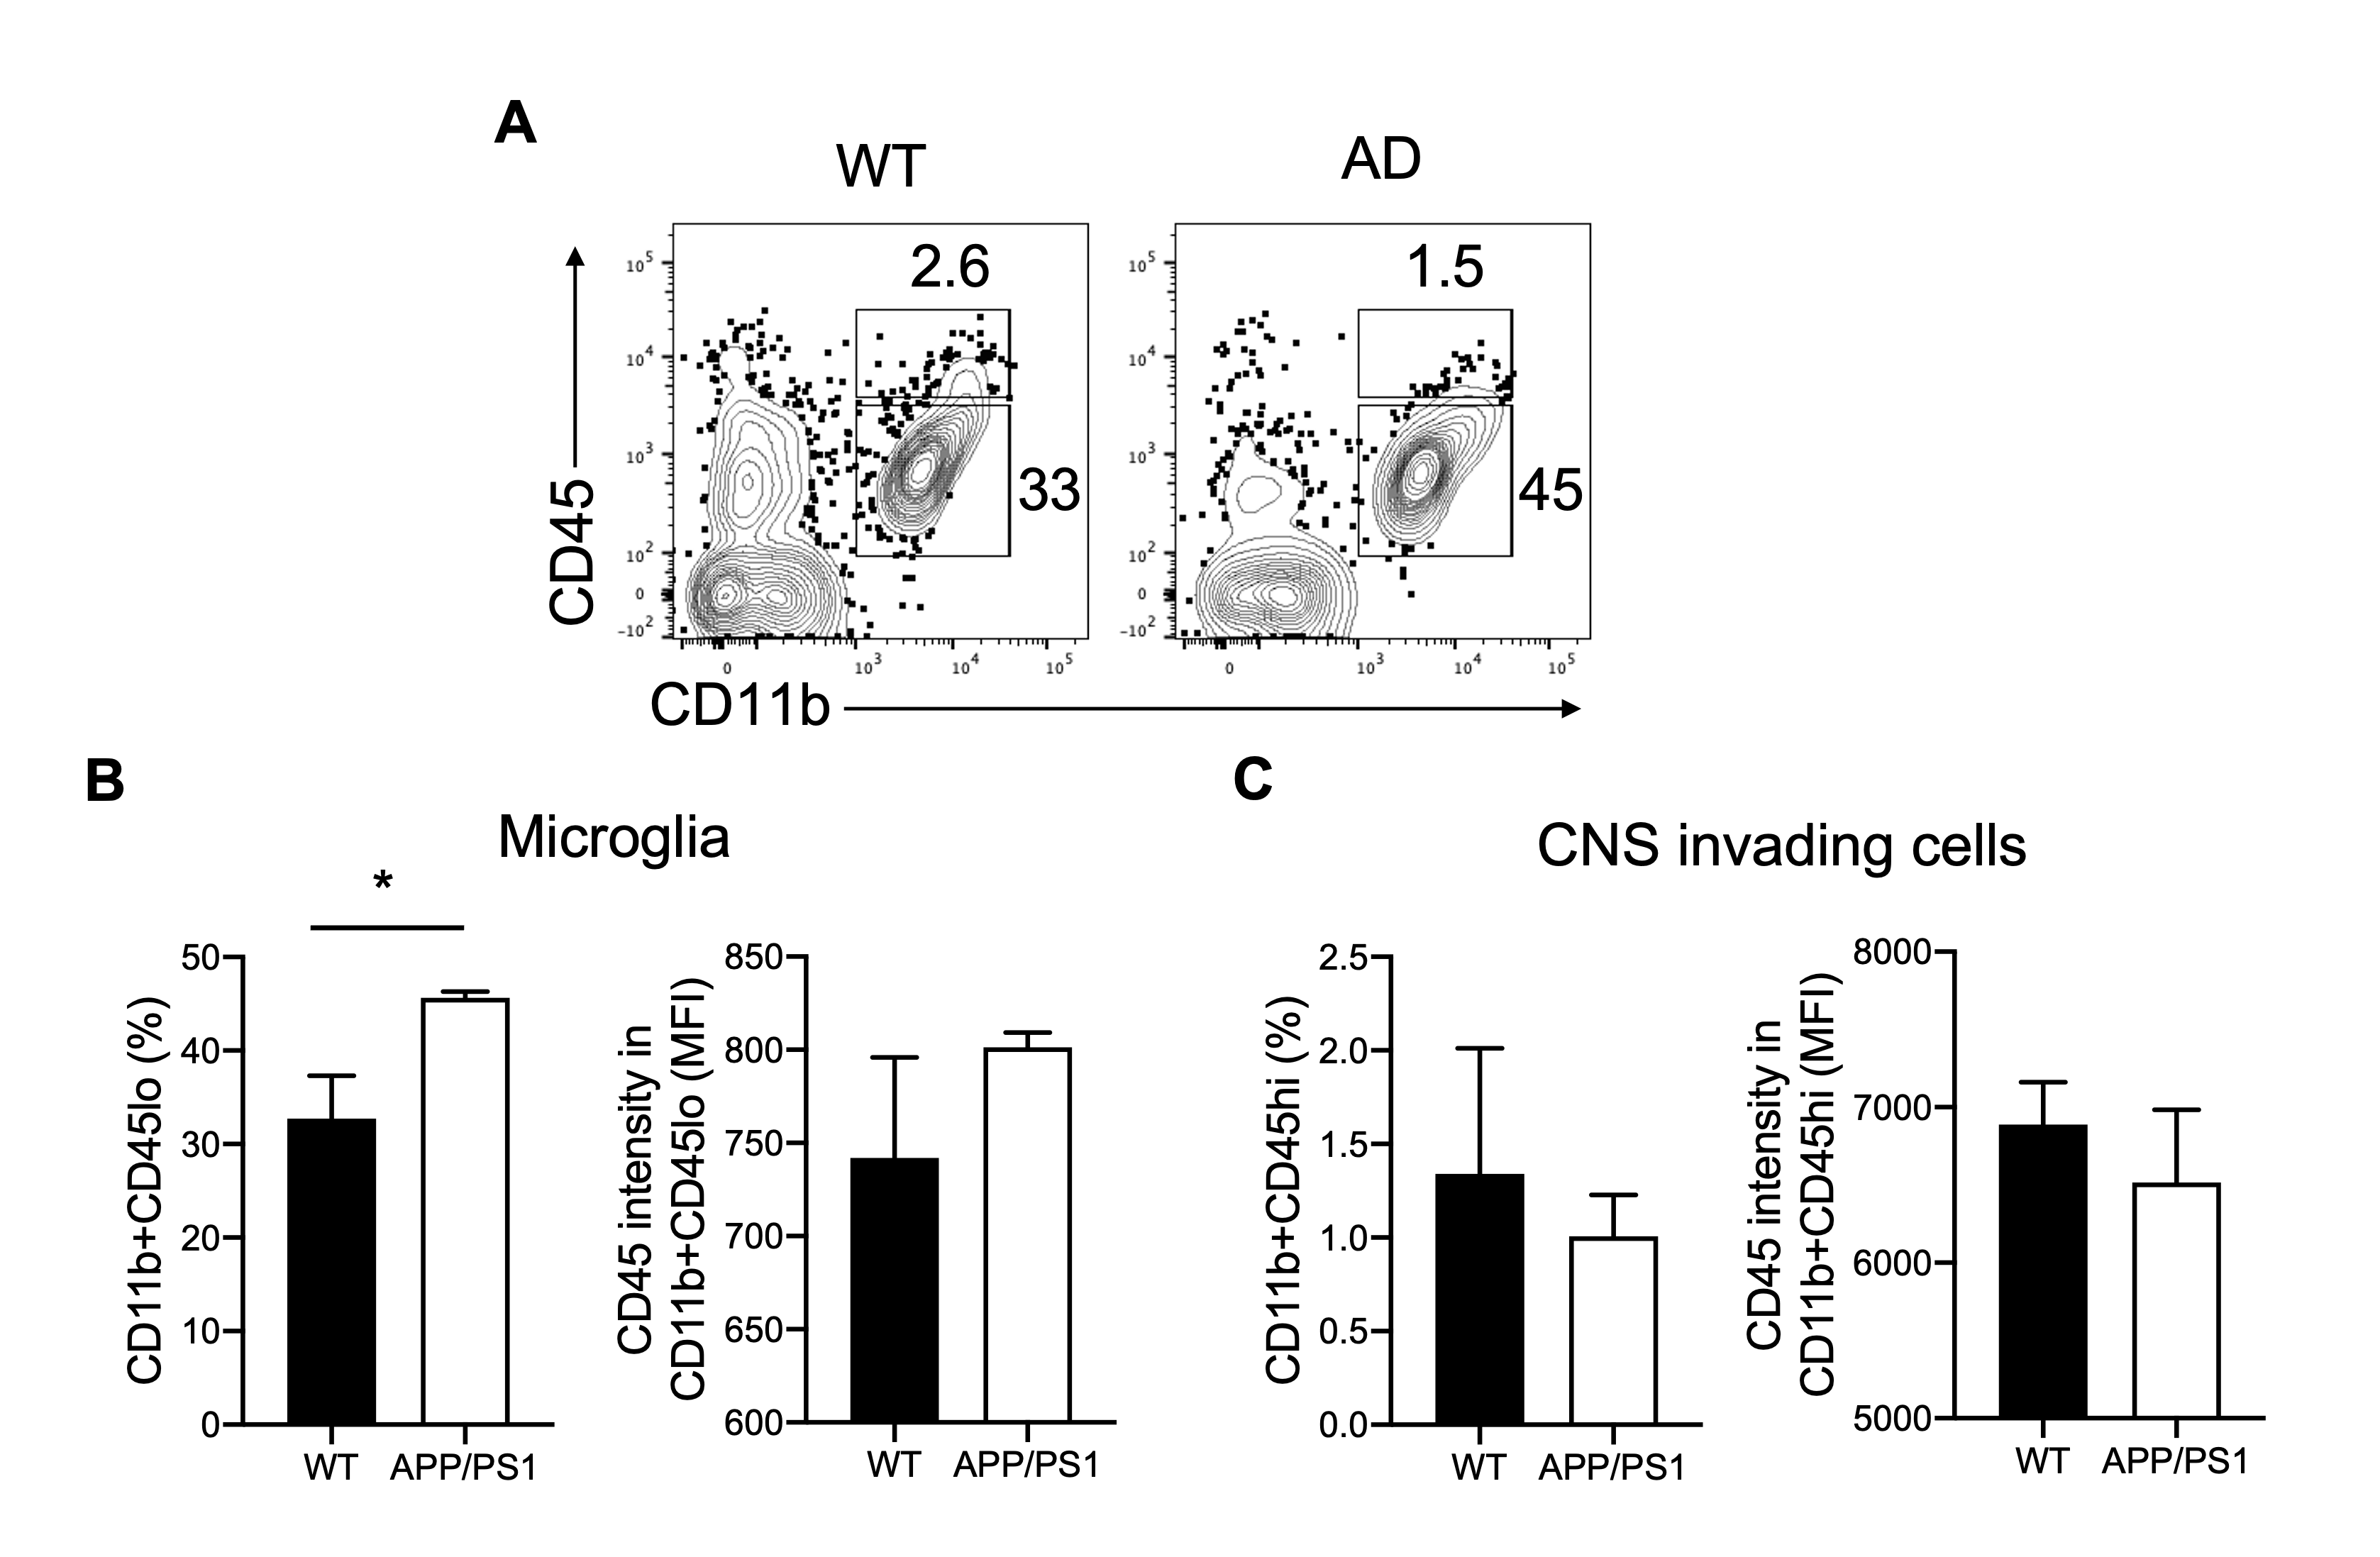
The DGE images of CSF and parenchyma dynamically exhibited the signal change before and after glucose injection, which resembled our previous findings6. The preliminary results showed a high parenchymal uptake and a reduced CSF clearance in AD compared to age-matched wild type (WT) (Figure 1). When we compared the cell findings by flow cytometry and DGE with the immune cell findings, we observed a higher CD45loCD11b+ microglia cell proportion in APP/PS1 than in WT at 6 months (45.63±1.19% vs 32.73±7.95%, p = 0.049, Figure 2A and B). This increase was also observed in microglia activation (shown as CD45 intensity on CD45loCD11b+), which corresponded to a relatively high parenchymal glucose uptake and low CSF clearance. Meanwhile, other CNS myeloid invading cells (CD45hiCD11b+) did not show differences between groups (Figure 2C).Discussion
An increase in the glucose uptake in parenchyma was observed, which was also reported by Huang J, et al. 2020 (1.66 ± 0.59% vs 2.16 ± 0.38%)6. The DGE findings in this study were comparable with our previous study. Moreover, this corresponds to an increase of microglia proportion and CD45 expression in microglia in AD, which could be attributed to microglial activation2. These preliminary results indicated the microglia activation could contribute to the altered glucose uptake and utilization in the brain detected by DGE MRI. We are now investigating the glucose metabolism and its relationship to microglia activation in AD at different stages. We believe the further studies to associate the underlying molecular and cellular pathology of AD with DGE MRI could benefit the identification of AD in early stages.Conclusion
In the brain, we observed an increase of microglia proportion, as well as activated microglia, accompanied with relatively high parenchymal glucose uptake and low CSF clearance in AD when compared with WT. The preliminary result indicated the abnormal glucose metabolism induced by microglia activation in AD could be detected by DGE-MRI. This potential association of microglia activation and DGE-MRI findings could facilitate the identification of AD.Acknowledgements
Authors would like to acknowledge the funding supports from Research Grants Council (11102218, PDFS2122-1S01, 11200422, RFS2223-1S02, C1134-20G); City University of Hong Kong (7005433, 7005626, 9239070, 9609307, 9610560); National Natural Science Foundation China (81871409); Tung Biomedical Sciences Centre; Hong Kong Centre for Cerebro-cardiovascular Health Engineering.References
1. Bettcher BM, Tansey MG, Dorothee G, et al. Peripheral and central immune system crosstalk in Alzheimer disease - a research prospectus. Nat Rev Neurol. 2021;17(11):689-701.
2. Vom Berg J, Prokop S, Miller KR, et al. Inhibition of IL-12/IL-23 signaling reduces Alzheimer's disease-like pathology and cognitive decline. Nat Med. 2012;18(12):1812-9.
3. Wendimu MY, Hooks SB. Microglia Phenotypes in Aging and Neurodegenerative Diseases. Cells. 2022;11(13).
4. Pan RY, He L, Zhang J, et al. Positive feedback regulation of microglial glucose metabolism by histone H4 lysine 12 lactylation in Alzheimer's disease. Cell Metab. 2022;34(4):634-48 e6.
5. Choi H, Choi Y, Lee EJ, et al. Hippocampal glucose uptake as a surrogate of metabolic change of microglia in Alzheimer's disease. J Neuroinflammation. 2021;18(1):190.
6. Huang J, van Zijl PCM, Han X, et al. Altered d-glucose in brain parenchyma and cerebrospinal fluid of early Alzheimer's disease detected by dynamic glucose-enhanced MRI. Sci Adv. 2020;6(20):eaba3884.
7. Xu X, Xu J, Chan KWY, et al. GlucoCEST imaging with on-resonance variable delay multiple pulse (onVDMP) MRI. Magn Reson Med. 2019;81(1):47-56.
Figures