0655
Cerebral Mapping of Glutamate-Weighted MR Imaging (GluCEST) in a Rat Model of Lipopolysaccharide-Induced Sepsis1Department of Radiology, Asan Medical Center, University of Ulsan College of Medicine, Seoul, Korea, Republic of, 2QuBEST Bio Co. ltd., Gyeonggi-do, Korea, Republic of, 3Department of Convergence Medicine, Asan Medical Center, University of Ulsan College of Medicine, Seoul, Korea, Republic of, 4Convergence Medicine Research Center, Asan Institute for Life Sciences, Asan Medical Center, Seoul, Korea, Republic of, 5Biomedical Research Center, Asan Institute for Life Sciences, Asan Medical Center, Seoul, Korea, Republic of, 6Department of Medical Science, Asan Medical Institute of Convergence Science and Technology, Asan Medical Center, University of Ulsan College of Medicine, Seoul, Korea, Republic of
Synopsis
Keywords: Neuroinflammation, Molecular Imaging
Glutamate-weighted chemical exchange saturation transfer (GluCEST) is a useful imaging tool which is used to detect glutamate signal alterations caused by neuroinflammation. The present study quantitatively evaluated glutamate level changes in the hippocampal region of a rat model of sepsis-induced brain injury using GluCEST and proton magnetic resonance spectroscopy (1H-MRS). The GluCEST and 1H-MRS results showed that GluCEST values and glutamate concentrations were significantly higher in the sepsis-induced rats than in the controls. GluCEST imaging could be a helpful technique for defining a biomarker to estimate the glutamate-related metabolism in sepsis-associated diseases.INTRODUCTION
Sepsis-associated brain injury is defined as a diffuse or multifocal cerebral dysfunction caused by the systemic response to infection1,2. Pathological characteristics in sepsis-associated brain injuries include disruption of the blood–brain barrier, neuroinflammation, and activation of microglia3,4. Activation of microglia during infection may secrete large amounts of glutamate (Glu) in the hippocampal region5,6. Thus, detecting and quantifying alterations in glutamate signals are important, as it has the potential to be used as an essential key marker for evaluating cerebral metabolism in sepsis-associated brain injuries. Chemical exchange saturation transfer (GluCEST) for glutamate-weighted imaging is an improved sensitivity enhancement technique that provides indirect detection of glutamate in vivo7,8. This study aimed to visualize and quantitatively evaluate hippocampal glutamate alterations in a rat model of sepsis-induced brain injury using GluCEST and proton magnetic resonance spectroscopy (1H-MRS).METHODS
Animals: Twenty-one Sprague–Dawley rats were divided into three groups (sepsis-induced group [SEP05, n = 7], [SEP10, n = 7], and controls [CTRL, n = 7]). Sepsis was induced by a single intraperitoneal administration of lipopolysaccharide (LPS) at a dose of 5 mg/kg (SEP05) and 10 mg/kg (SEP10). The CTRL rats received intraperitoneal injections of normal saline.MRI Scan: GluCEST imaging and 1H-MRS data were acquired from all rats using a 7T scanner based on a Turbo-RARE sequence with 25 frequency offsets (–6 to +6 ppm with 0.5-ppm increments) and unsaturated image (S0). All images were acquired using a continuous-wave radiofrequency (RF) saturation pulse (power = 3.6-μT, saturation length = 1,000-ms)9. For B0 correction, water saturation shift referencing dataset with 29 frequency offsets was acquired from –0.8 to 0.8 ppm (0.05-ppm increments) using 0.3-μT RF saturation power. For B1 correction, B1 map was obtained using a double flip-angle (30° and 60°)10. The 1H-MRS data were acquired from a single voxel positioned in the hippocampus using a point-resolved spectroscopy sequence (TR/TE = 5,000/16.3-ms, spectral width = 5,000-Hz, data points=2,048, and 256 averages)11.
Data Processing: Using B0 and B1 corrected CEST data, the GluCEST contrast was calculated by subtracting the normalized magnetization signal at 3.0-ppm from the magnetization at the corresponding reference frequency symmetrically at the upfield from water; [Ssat(–3.0ppm)–Ssat(+3.0ppm)]/Ssat(–3.0ppm)9,10. An ROI for the computation of the GluCEST values was set in the hippocampal region. LCModel was used to quantify the 1H-MRS. The Glu concentrations were quantified using the unsuppressed water signals as an internal reference.
Hematoxylin and Eosin (H&E) Staining: Brain tissues were fixed in 4% paraformaldehyde, embedded in paraffin, cut into 4-µm-thick sections. Tissues were then stained with hematoxylin for 10-min and eosin for 5-min at room temperature. The pathological features of hippocampal tissues were observed using automated quantitative pathology imaging system. H&E staining was performed as previously described12.
Immunofluorescence: Immunohistochemical staining was performed as previously described13. To determine the distribution of microglial activation, neurons, and nuclei markers, tissue sections were stained using Iba-1, NeuN, and 4′,6-diamidino-2-phenylindole antibodies, respectively. Immunofluorescence imaging was performed using a laser scanning confocal system.
Statistics: Statistical differences in GluCEST and 1H-MRS data among three groups were analyzed using a one-way analysis of variance test, followed by Tukey’s post-hoc test. Statistical differences were assumed to be significant for p-values below 0.05.
RESULTS AND DISCUSSION
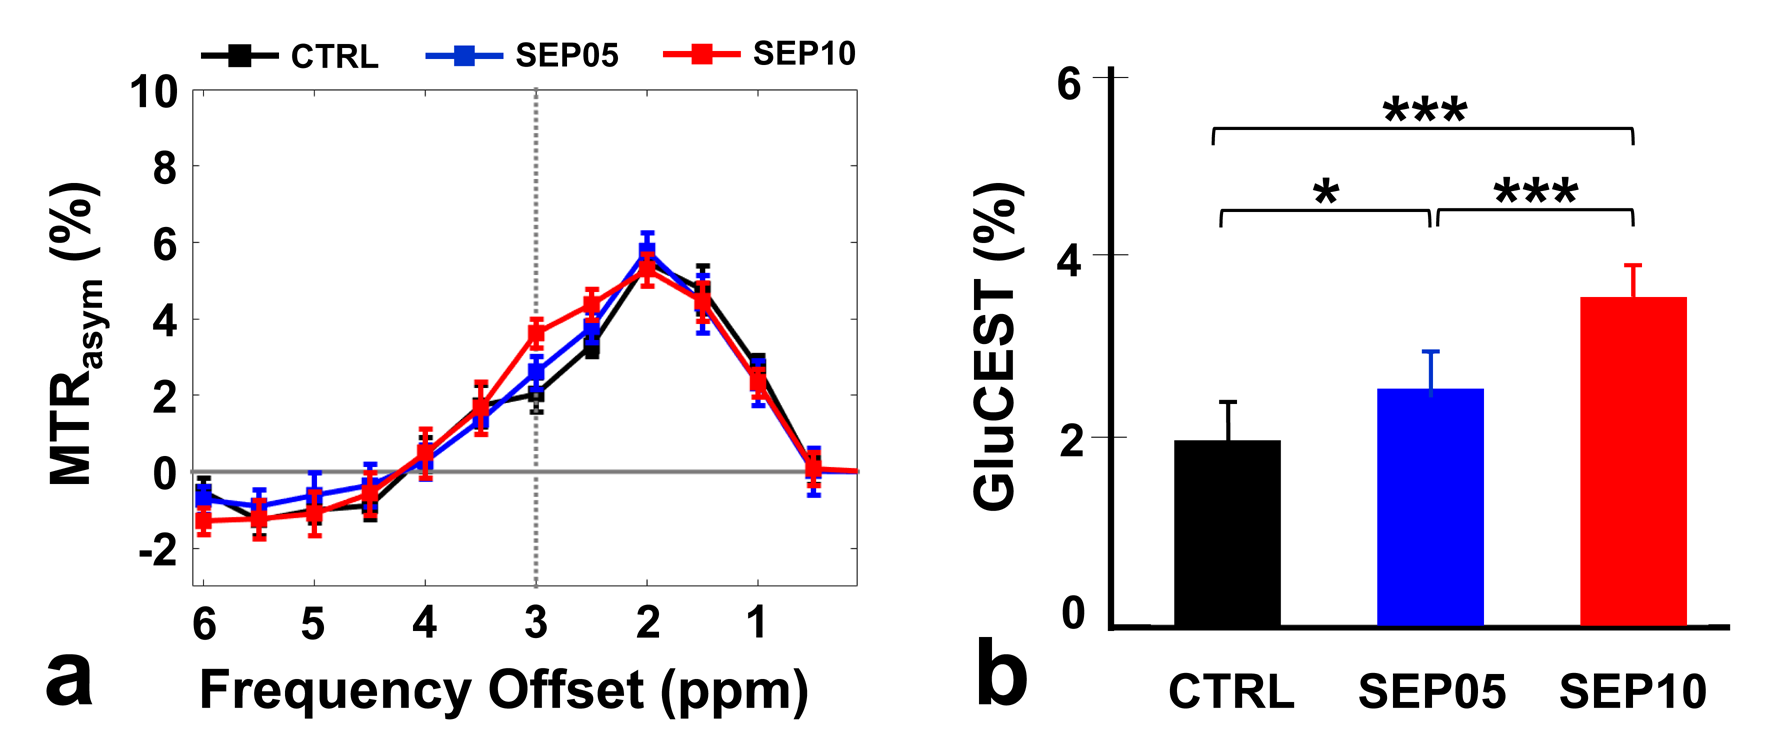
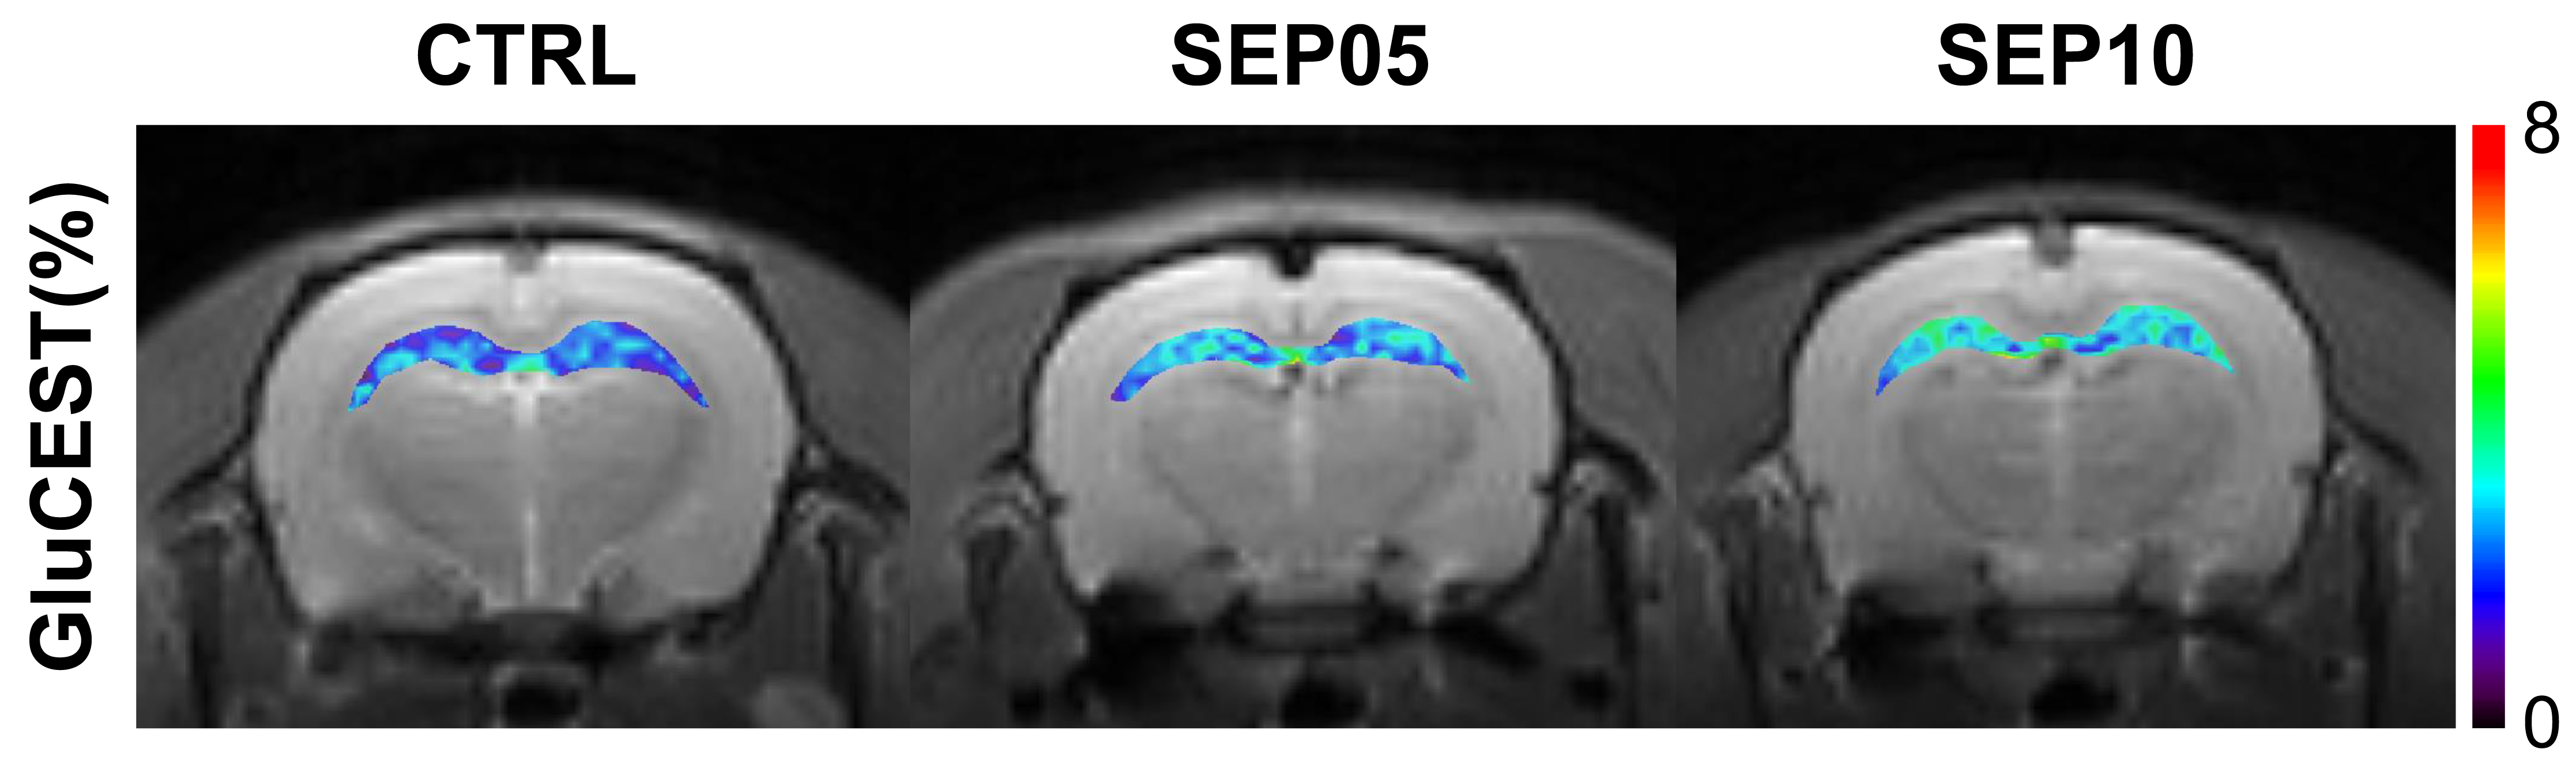
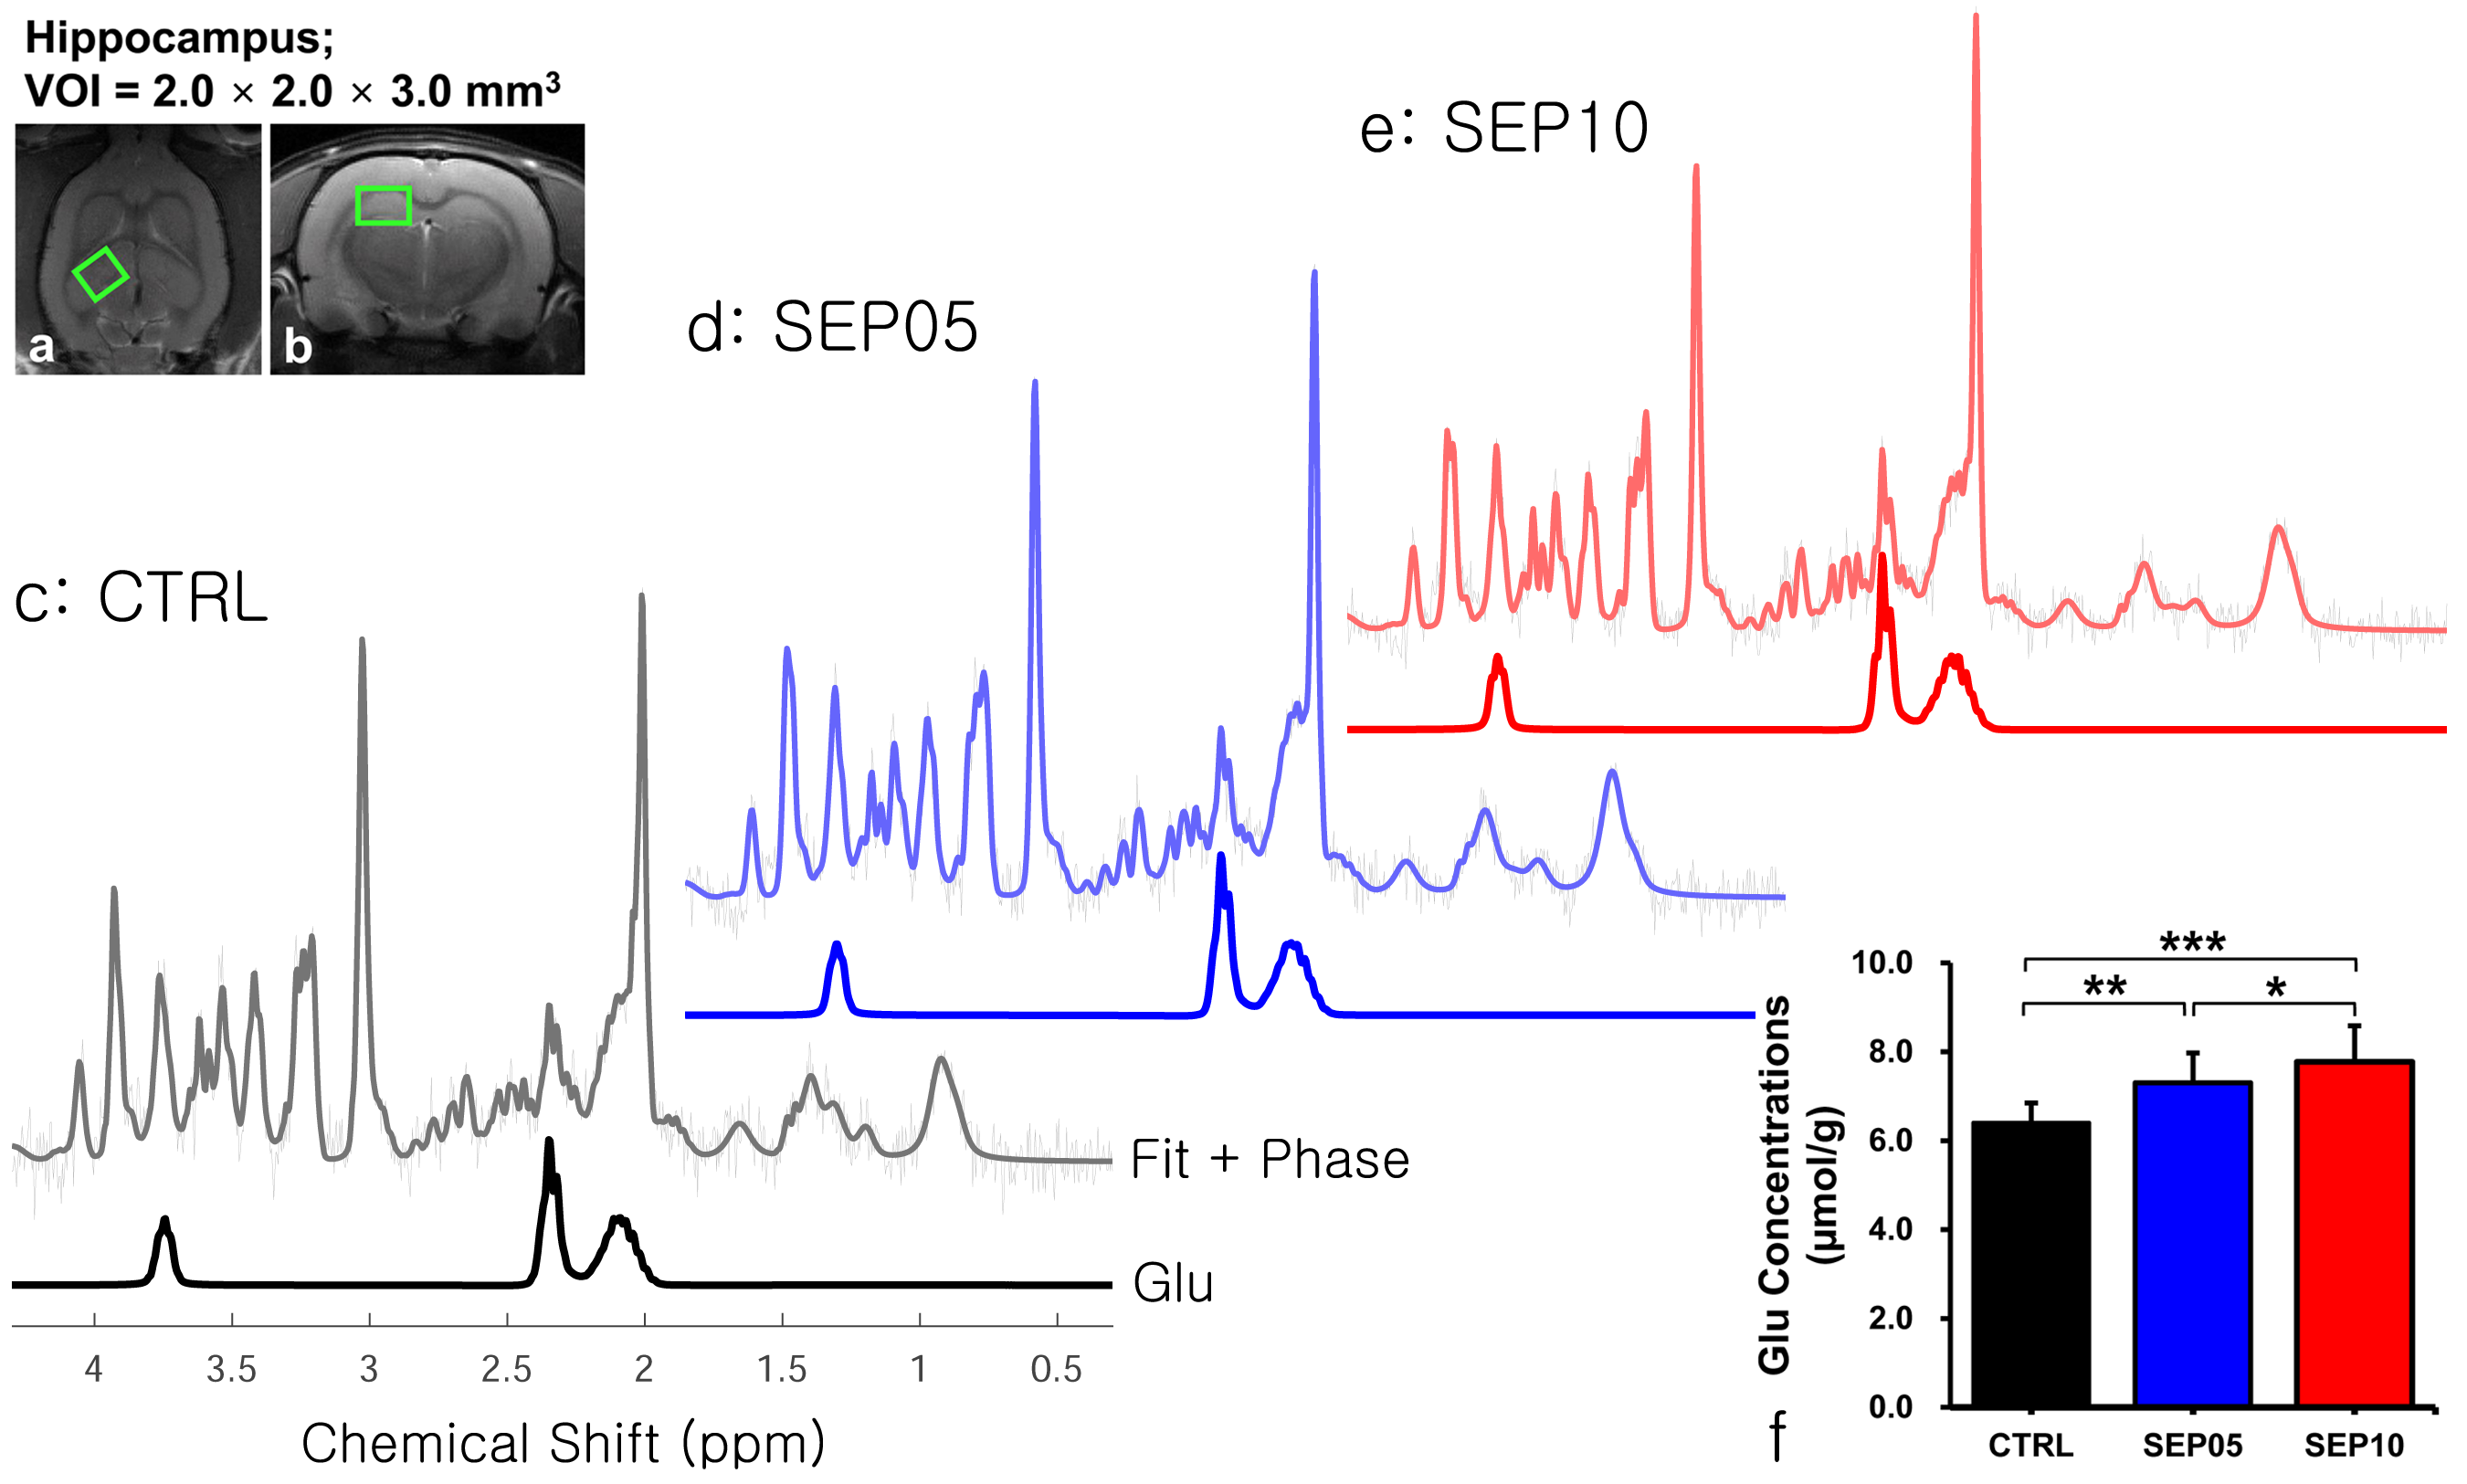
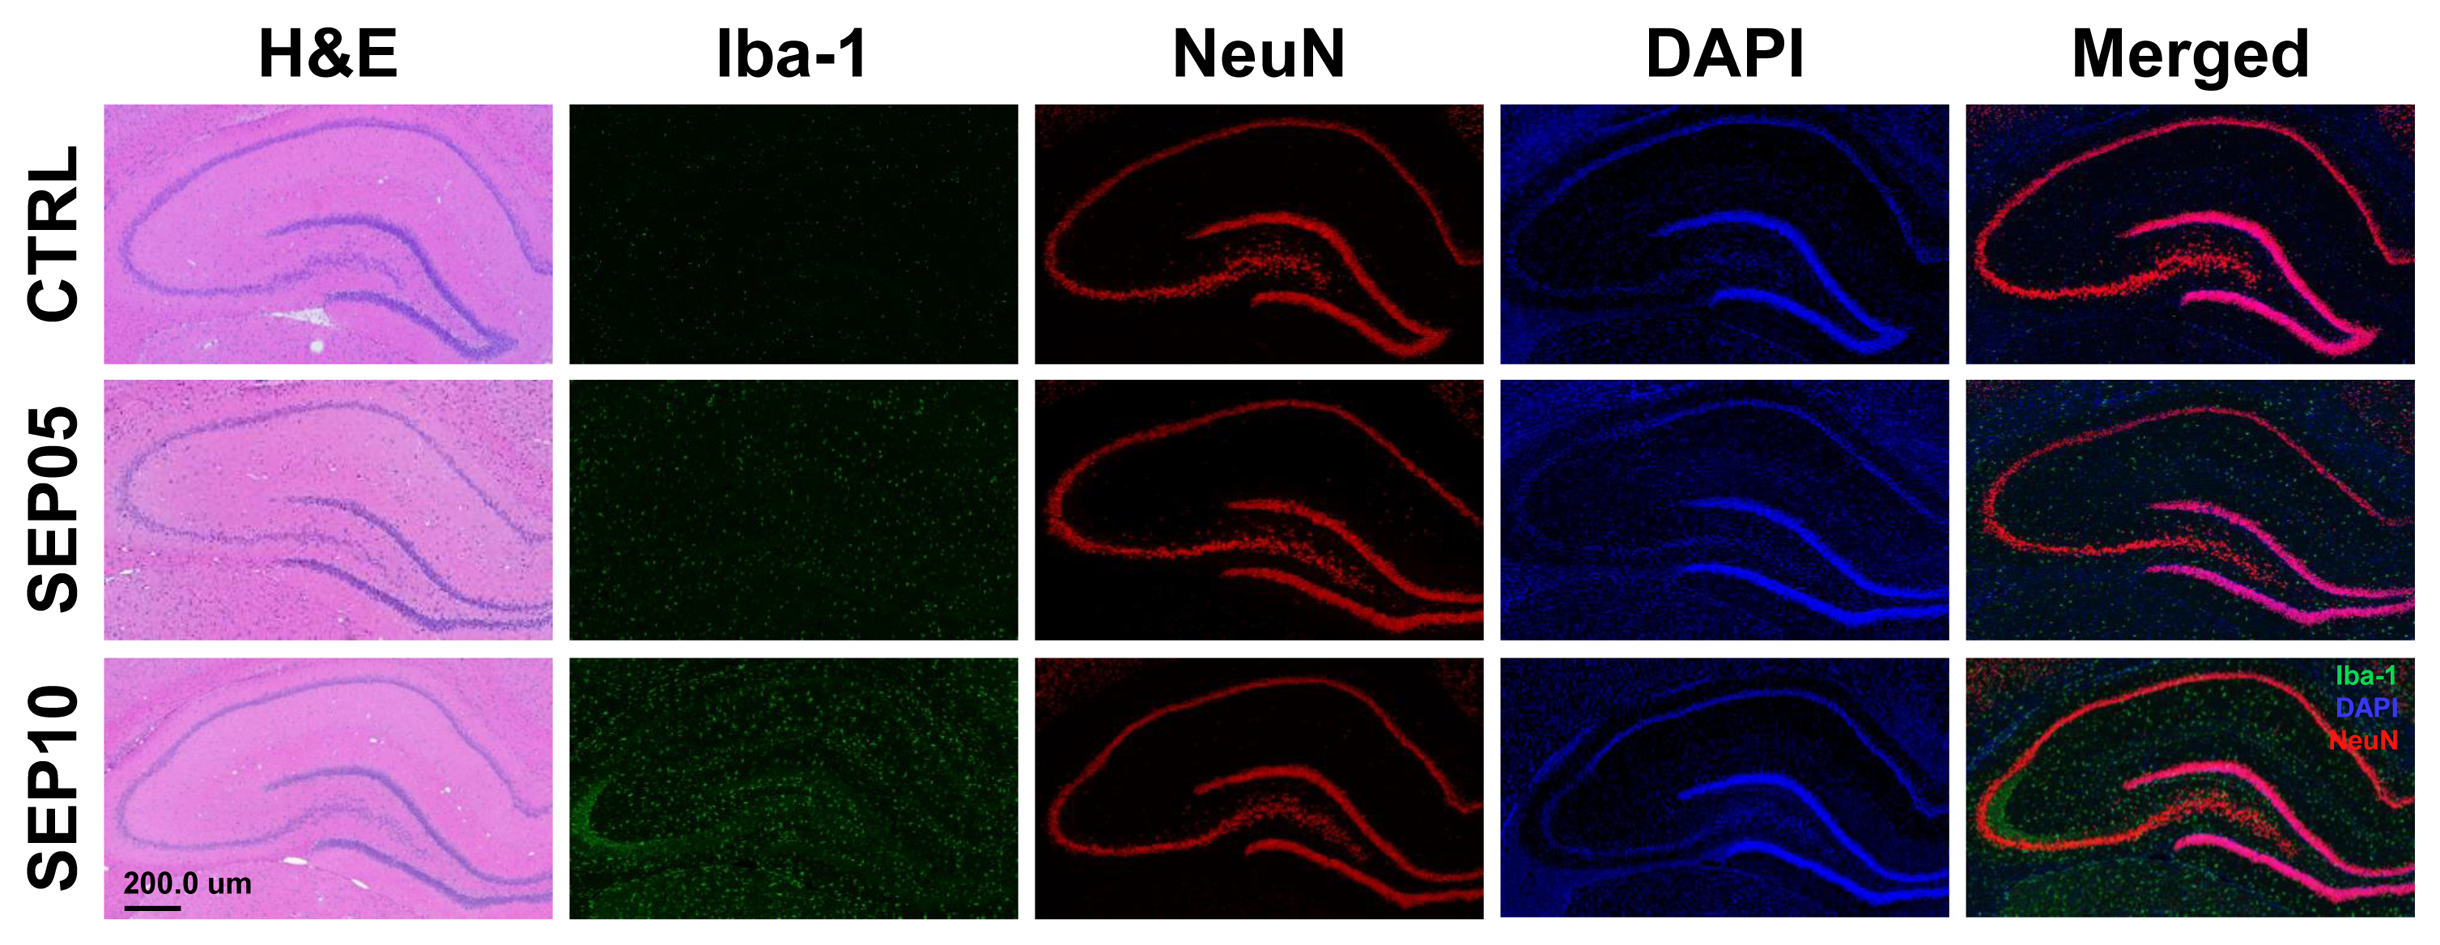
Figure 1 shows the magnetization transfer ration asymmetry (MTRasym) spectra (a) and quantified GluCEST signals at 3.0-ppm (b) in each group. The MTRasym spectra showed distinct differences among three groups. Moreover, as the LPS dose increased, the MTRasym values were observed to be higher than in CTRL. The quantified GluCEST signals differed significantly among three groups, as follows (Fig.1b): CTRL (2.03 ± 0.45%) vs. SEP05 (2.60 ± 0.43%) (p<0.05); SEP05 vs. SEP10 (3.62 ± 0.38%) (p<0.001); and CTRL vs. SEP10 (p<0.001). Figure 2 shows the mapping results of GluCEST signals in representative rats, focusing on the hippocampal region and overlaid on the unsaturated CEST image in each group. The GluCEST signals in the hippocampal region changed hyperintensities with an increasing dose of LPS, compared to controls. Figure 3 shows the voxel placement in the hippocampal region of rats (Fig.3a,b) and presents the spectral fitting results of 1H-MRS data in a representative rat from each group (Fig.3c-e). The quantified Glu concentrations differed significantly among the three groups, as follows (Fig.3f): CTRL (6.401 ± 0.450 µmol/g) vs. SEP05 (7.303 ± 0.671 µmol/g) (p<0.01); SEP05 vs. SEP10 (7.773±0.812 µmol/g) (p<0.05); and CTRL vs. SEP10 (p<0.001). Overall, 1H-MRS data showed a similar trend to the GluCEST data, showing high Glu concentrations as the LPS administration dose increased. Figure 4 shows the histological staining results in the hippocampal region. In sepsis-induced rats, the intensity of the Iba-1 signal was higher than in the CTRL, and the higher the dose of the LPS, the higher the signal intensity. The morphology of microglia can be visualized through staining of Iba-1, which is a specific marker for pan-microglia14. The high Glu quantities may be generated by an activated immune system and microglia reactivity during neuroinflammation15-17.CONCLUSION
The Glu-weighted 7T MRI was adequately sensitive in detecting in vivo changes in the hippocampal region in sepsis-induced cerebral injuries. Significant contrast changes in Glu-weighted metric coupled with histologic characteristics of sepsis-induced cerebral injuries may indicate the potential usefulness of GluCEST imaging in observing the neuroinflammatory processes.Acknowledgements
This work was supported by the National Research Foundation of Korea (NRF) grant funded by the Korea Government (Ministry of Science and ICT, MSIT) (No. 2022R1C1C2008801).References
1. Wen M, Lian Z, Huang L, et al. Magnetic resonance spectroscopy for assessment of brain injury in the rat model of sepsis. Exp Ther Med. 2017;14:4118–4124.
2. Sekino N, Selim M and Shehadah A. Sepsis-associated brain injury: underlying mechanisms and potential therapeutic strategies for acute and long-term cognitive impairments. J Neuroinflammation. 2022;19:101.
3. Bal-Price A, Brown GC. Inflammatory neurodegeneration mediated by nitric oxide from activated glia-inhibiting neuronal respiration, causing glutamate release and excitotoxicity. J Neurosci. 2001;21(17);6480–6491.
4. Deng YY, Fang M, Zhu GF, et al. Role of Microglia in the Pathogenesis of Sepsis-Associated Encephalopathy, CNS Neurol Disord Drug Targets. 2013;12(6):720–725.
5. Moraes CA, Zaverucha-do-Valle C, Fleurance R, et al. Neuroinflammation in Sepsis: Molecular Pathways of Microglia Activation. Pharmaceuticals. 2021;14(5):416.
6. Alexander JJ, Jacob A, Cunningham P, et al. TNF is a key mediator of septic encephalopathy acting through its receptor, TNF receptor-1. Neurochem Int. 2008;52:447–456.
7. Cai K, Haris M, Singh A, et al. Magnetic resonance imaging of glutamate. Nat Med. 2012;18(2):302–306.
8. Bagga P, Pickup S, Crescenzi R, et al. In vivo GluCEST MRI: Reproducibility, background contribution and source of glutamate changes in the MPTP model of Parkinson’s disease. Sci Rep. 2018;8:2883.
9. Lee DH, Woo CW, Kwon JI, et al. Cerebral mapping of glutamate using chemical exchange saturation transfer imaging in a rat model of stress-induced sleep disturbance at 7.0T. J Magn Reson Imaging. 2019;50(6);1866–1872.
10. Cai K, Haris M, Singh A, et al. Magnetic resonance imaging of glutamate. Nat Med. 2012;18(2):302–306.
11. Tkac I, Starcuk Z, Choi IY, et al. In vivo 1H NMR spectroscopy of rat brain at 1 ms echo time. Magn Reson Med. 1999;41:649–656.
12. Song Z, Feng J, Zhang Q, et al. Tanshinone IIA Protects Against Cerebral Ischemia Reperfusion Injury by Regulating Microglial Activation and Polarization via NF-κB Pathway. Front Pharmacol. 2021;12:641848.
13. Lee JK, Park J, Lee YD, et al. Distinct localization of SAPK isoforms in neurons of adult mouse brain implies multiple signaling modes of SAPK pathway. Brain Res Mol Brain Res. 1999;70:116–124.
14. Wei J, Wu F, He A, et al. Microglia activation: one of the checkpoints in the CNS inflammation caused by Angiostrongylus cantonensis infection in rodent model. Parasitol Res. 2015;114:3247–3254.
15. Srinivasan R, Sailasuta N, Hurd R, et al. Evidence of elevated glutamate in multiple sclerosis using magnetic resonance spectroscopy at 3 T. Brain. 2005;128:1016–1025.
16. Piani D, Frei K, Do KQ, et al. Murine brain macrophages induce NMDA receptor mediated neurotoxicity in vitro by secreting glutamate. Neurosci Lett. 1991;133:159–162.
17. Lee DW, Kwon JI, Woo CW, et al. In vivo Measurement of Neurochemical Abnormalities in the Hippocampus in a Rat Model of Cuprizone-Induced Demyelination. Diagnostics. 2021;11:45.
Figures