0651
Normative Modelling of White Matter Microstructure in Early Psychosis and Schizophrenia
Tommaso Pavan1,2, Yasser Alemán-Gómez1,2, Raoul Jenni2,3, Martine Cleusix2,3, Luis Alameda2,4, Kim Quang Do Cuenod2,3, Philippe Conus2,4, Paul Klauser2,5, Patric Hagmann1,2, and Ileana Jelescu1,2
1Department of Radiology, Lausanne University Hospital (CHUV), Lausanne, Switzerland, 2University of Lausanne (UNIL), Lausanne, Switzerland, 3Center for Psychiatric Neuroscience, Department of Psychiatry, Lausanne University Hospital (CHUV), Lausanne, Switzerland, 4General Psychiatry Service, Treatment and Early Intervention in Psychosis Program (TIPP-Lausanne), Lausanne University Hospital (CHUV), Lausanne, Switzerland, 5Center for Psychiatric Neuroscience and Service of Child and Adolescent Psychiatry, Department of Psychiatry, Lausanne University Hospital (CHUV), Lausanne, Switzerland
1Department of Radiology, Lausanne University Hospital (CHUV), Lausanne, Switzerland, 2University of Lausanne (UNIL), Lausanne, Switzerland, 3Center for Psychiatric Neuroscience, Department of Psychiatry, Lausanne University Hospital (CHUV), Lausanne, Switzerland, 4General Psychiatry Service, Treatment and Early Intervention in Psychosis Program (TIPP-Lausanne), Lausanne University Hospital (CHUV), Lausanne, Switzerland, 5Center for Psychiatric Neuroscience and Service of Child and Adolescent Psychiatry, Department of Psychiatry, Lausanne University Hospital (CHUV), Lausanne, Switzerland
Synopsis
Keywords: Psychiatric Disorders, Microstructure, Schizophrenia, Neuroinflammation, Neurodegeneration, Microstructure, Diffusion, White Matter
The great majority of studies in schizophrenia (SCHZ) failed to achieve recognizable spatial patterns of the disease due to its heterogeneity. With this abstract, the authors aim to understand WM microstructure patterns from an individual perspective in early psychosis and SCHZ using advanced diffusion MRI metrics, namely diffusion kurtosis imaging (DKI), the WM microstructure model White Matter Tract Integrity – Watson (WMTI-W) and normative modelling, a statistical method for studying individual differences as extreme deviations from the normality. Overall, deviations in SCHZ subjects were twice as frequent when compared to EP or CTRL while EP displayed more spatial heterogeneity.Introduction
In schizophrenia (SCHZ), there are widely reported white matter (WM) alterations1,2. The great majority of studies reported lower fractional anisotropy (FA) and higher diffusion tensor imaging (DTI) diffusivities3 but failed to achieve recognizable spatial patterns due to the disease heterogeneity3,4. Few previous works harnessed normative modeling (a statistical method for studying individual differences as deviations from the normality) of DTI metrics in SCHZ and reported reductions in FA in the great majority of the studied regions4,5. With this abstract, the authors aim to understand WM microstructure patterns from an individual perspective in early psychosis and schizophrenia using advanced diffusion MRI (dMRI) metrics and normative modelling. The dMRI metrics of interest were estimated via diffusion kurtosis imaging6 (DKI) a clinically feasible extension of DTI, and the WM microstructure model White Matter Tract Integrity – Watson7 (WMTI-W, Fig.1).Methods
The relevant ethics committee approved the study. MRI: Data from 259 subjects (Table 1) were collected on two scanners (Siemens 3T Prisma and Trio), divided as N=119 healthy individuals (CTRL), N=97 early psychosis (EP, <5 years from first exceeding psychosis threshold) and N=43 chronic schizophrenic patients (SCHZ). Whole-brain diffusion-weighted images were acquired using a PGSE-EPI sequence (TE/TR = 0.144/6.1s, 2-mm isotropic resolution, 15 b-values, range 0-8 ms/μm2, Cartesian q-space coverage totaling 129 (Trio, Prisma) or 257 (Trio) images). The preprocessing pipeline included MP-PCA denoising and Gibbs ringing, EPI distortion, eddy currents, and motion corrections. Diffusion, kurtosis and WMTI-W (Fig.1) were estimated voxel-wise from data with b≤2.5 ms/μm2. Individual FA maps were registered to the Johns Hopkins University FA template and WM regions of interest (ROIs) were projected to individual space. Each available diffusion metric was averaged per WM ROI, and all the estimated metrics were harmonized for scanner type via ComBat8. A Bayesian ridge regression model with a B-spline9 base was chosen to model the normative range of the CTRLs. The age in months of each healthy volunteer was used as a regressor and each diffusion metric as the target variable. The training procedure consisted of a random grid search of uniformly distributed hyperparameters followed by six-fold cross-validations. The expected diffusion metrics for each clinically relevant individual were estimated based on age and used to compute the individual deviations from the norm by dividing the difference between empirical and expected value by the standard deviation of the prediction10,11. Individual subjects' ROIs were then classified as supra-normal (positive deviation) or infra-normal (negative deviation) whether their deviation exceeded the threshold z=±2.32 (p-value=0.01).Results
SCHZ: In SCHZ, diffusivity metrics showed the most common supra-normal deviations across the WM and ranged between ~2% (1 subject) to ~11% (5 individuals) of the subjects, with radial (RD) and mean diffusivity (MD) deviations being more common than AD (Fig.2,A; top-block). WMTI-W compartment diffusivities were consistently supra-normal and widespread across the WM. De,∥ proved to be the most commonly increased metric in up to ~11% of individuals, followed by De,⊥ (max.~9%) and Da (max.~4%). The most frequent ROI-specific deviations were found in the bilateral superior fronto-occipital fasciculus (sFOF, RD:~11%, AD:~7,~9%), bilateral superior corona radiata (sCR, RD:~11%, MD:~9,~11%, AD:~7%), posterior thalamic radiation (pTR, RD:~11%) and the cingulum (cingulate gyrus, Cing/CG, RD:~11%). On the other hand, SCHZ infra-normal deviations were mostly concentrated on the DKI metrics (Fig.2, B; top-block) and resulted in less frequent deviations than the supra-normal. From the ROI perspective, infra-normal values were most frequent in the fornix (Fx, MK:~7%, Da:~9%, De,∥:~9%, De,⊥:~7%) followed by the axonal water fraction f of the right sCR and pTR (~9%). EP: The EP group deviations were, in general, less clustered and frequent than SCHZ (Fig.2,A&B; mid-block), displaying spatial heterogeneity, but nevertheless present in a larger proportion of the population than for the CTRLS, on which the normative model was built (Fig.2,A&B; bottom-block). Notably, the midCP metrics were most frequently supra-normal (~5 to ~6%, Fig.2,A&B; mid-block).Discussion and conclusion
Overall, extreme deviations in SCHZ subjects were twice as frequent when compared to EP or CTRL and displayed more marked clusters of positive and negative deviations from "normal" dMRI metrics. Remarkably, EP showed less clustering of supra- or infra-normal individuals, though more so than controls on which the normative model was built. Similar papers that utilized normative modelling found abnormal deviations in 66% of the considered ROIs (n=18) in up to 3.16% of individuals (n=601), reporting the forceps as the ROI with the most frequent deviations while the fornix was abnormal in 1.16% of the subjects5. Another study reported deviations in WM in up to ~15% of the subjects (n=332)4. The most involved areas were the sagittal stratum but also the CR, pTR and the internal capsule, ROIs frequently involved also in the current cohort. Interestingly, 1/6th of the healthy subjects were reported to have at least 5 infra or supra-normal ROIs which reflects the diffused, yet infrequent deviations found also in this study’s CTRL. Indeed, one limitation of our current results is the limited number of CTRL subjects used to train the normative model in which the between-CTRL variability may be overestimated for certain age ranges, making it under representative. Future work will focus on increasing the number of controls, inter-subject quantification of the deviations, longitudinal trajectories and cognitive data.Acknowledgements
This study was supported by the National Center of Competence in Research (NCCR) “SYNAPSY-The Synaptic Bases of Mental Diseases” from the Swiss National Science Foundation (n°51AU40_125759 to KQD&PC, 51NF40_158776 and 51NF40_ 185837). TP and IJ are supported by SNSF Eccellenza grant PCEFP2_194260. PH is supported by SNSF grant 320030_197787.References
[1] Kelly et al., Mol Psychiatry 2018. [2] Kubicki et al., Curr. Opin. Psychiatry 2014. [3] Tamnes & Agartz, J. Am. Acad. Child Adolesc. Psychiatry 2016. [4] Lv et al. Mol Psychiatry. 2021. [5] Elad et al. Human Brain Mapping 2021. [6] Jensen & Helpern, NMR In Biomedicine 2010. [7] Jespersen, et al., Neuroimage 2018. [8] Fortin et al., Neuroimage 2017. [9] Pedregosa et al., JMLR 12 2011. [10] Marquand et al. Molecular Psychiatry 2019. [11] Rutherford et al. Nature Protocols 2022.Figures
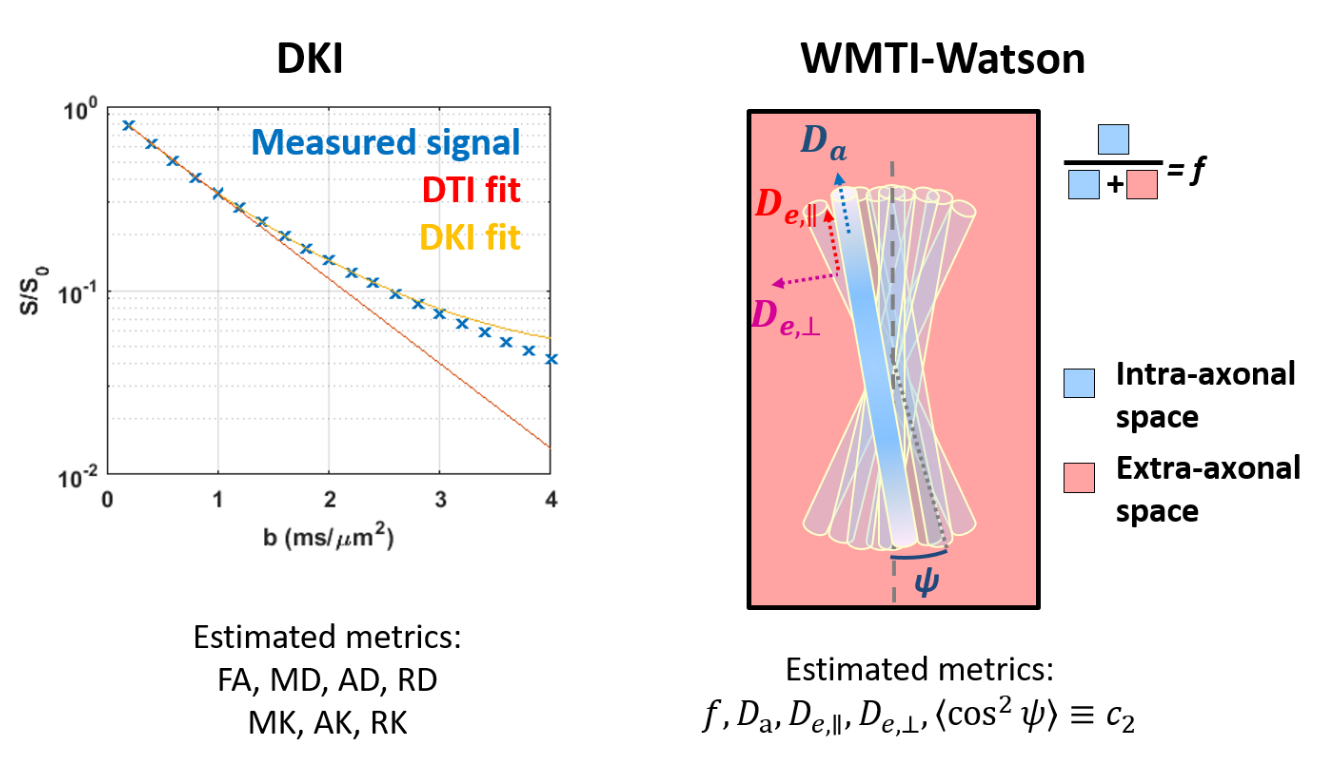
Figure 1. DKI is an extension of DTI that estimates also the non-Gaussian diffusion in tissue, bringing complementary information about complexity. Estimated metrics are FA (fractional anisotropy), MD/AD/RD and MK/AK/RK (mean/axial/radial diffusivity and kurtosis). The WMTI-W model parameters can be estimated in the WM. The model disentangles axonal water fraction f, intra-axonal diffusivity Da, extra-axonal axial and radial diffusivities De,∥ and De,⊥, and axon orientation alignment c2 (between limits: c2=1: perfectly parallel and c2=1/3: isotropically oriented axons).
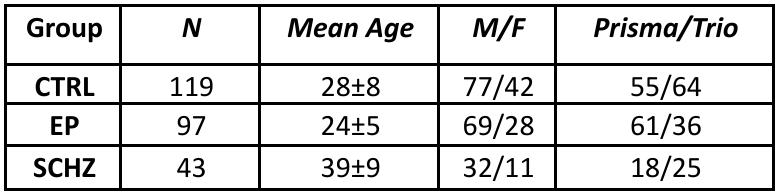
Table1: Groups descriptive statistics. CTRL: controls, EP: early psychosis, SCHZ: schizophrenia.
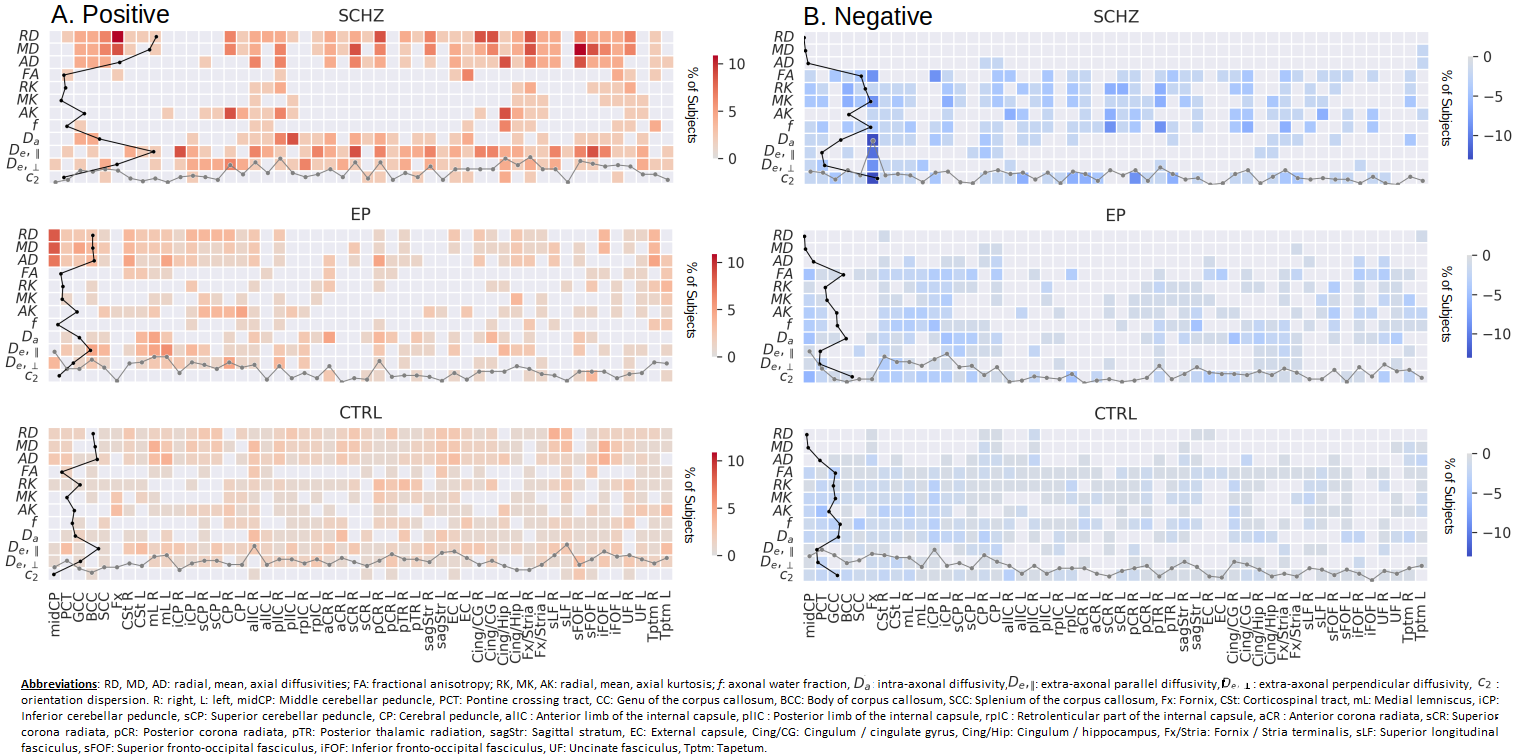
Figure 2: Percentage of subjects expressing an extreme deviation. A.Positive deviations (Z-score>2.32, supra-normal). B. Negative deviations (Z-score< 2.32, infra-normal). Intensities indicate the percentage of subjects, the darker the higher. The dotted lines on each of the axes represent the absolute number of deviations along the respective axis: the line on the Y-axis represents the count of extreme value for each dMRI metric scaled by the number of subjects (black line), while the line on the X-axis represents the count of deviations for each specific ROI (grey line).
DOI: https://doi.org/10.58530/2023/0651