0650
Identification of Quantitative Susceptibility Biomarkers for First Episode Psychosis using XGBoost1Biomedical Imaging Center, Pontificia Universidad Catolica de Chile, Santiago, Chile, 2Millennium Institute for Intelligent Healthcare Engineering - iHEALTH, Pontificia Universidad Catolica de Chile, Santiago, Chile, 3Radiology Department, School of Medicine, Pontificia Universidad Catolica de Chile, Santiago, Chile, 4Electrical Engineering Department, School of Engineering, Pontificia Universidad Catolica de Chile, Santiago, Chile, 5Department of Psychiatry, School of Medicine, Pontificia Universidad Catolica de Chile, Santiago, Chile, 6School of Medicine, Universidad Finis Terrae, Santiago, Chile, 7Pharmacovigilance, Instituto Psiquiátrico Dr J. Horwitz Barak, Santiago, Chile
Synopsis
Keywords: Psychiatric Disorders, Quantitative Susceptibility mapping
Several studies have demonstrated altered neurochemicals in deep-brain nuclei of psychosis patients. These alterations suggest a dopamine dysfunction in subcortical areas. QSM images quantify magnetic susceptibility changes in the brain. These changes are usually associated with iron concentrations and co-factor in dopamine pathways of the neurons. We propose a method based on machine learning to discriminate between psychosis patients and healthy controls by looking at the magnetic susceptibility of 9 deep gray matter nuclei, obtaining a precision of 91.6%.Introduction
Recent publications highlighted the changes in brain iron concentrations with a co-factor in dopamine pathways in psychosis patients1-4. Insights about the quantification of iron concentrations in the brain are available now by effective transverse relaxation rate (R2*) and quantitative susceptibility mapping (QSM), calculated from multi-echo gradient-echo (GRE) sequences5. As iron is the cofactor in neurotransmitter biosynthesis, the functions of the Grey Matter (GM) nuclei are susceptible to changes in iron concentration. Considering the limited number of dopamine pathways (nigrostriatal and tuberoinfundibular pathways) retrieved from the QSM image, it is possible to refine disease monitoring and improve patient risk stratification6,7. The present study aims to identify a clinically meaningful subset of quantitative susceptibility brain areas that can be related to first-episode psychosis patients, building classifiers using machine learning (ML) techniques.Methods
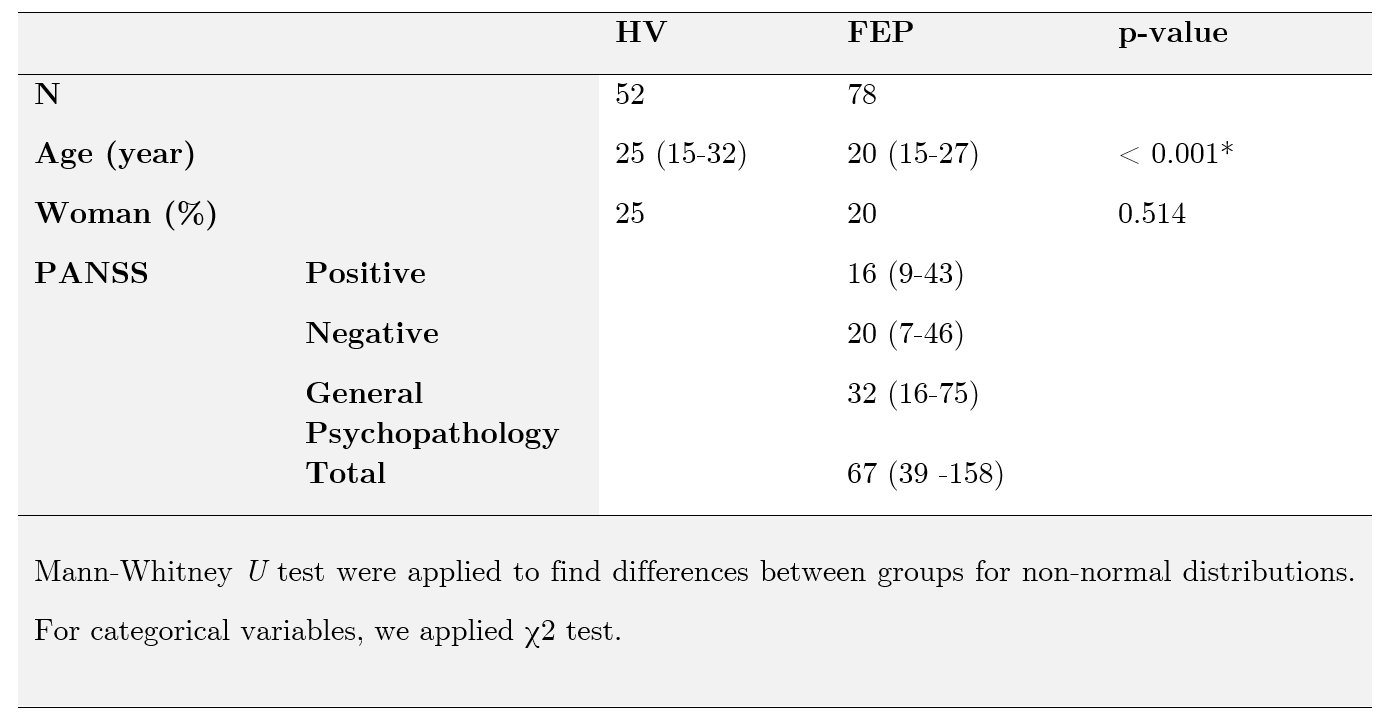
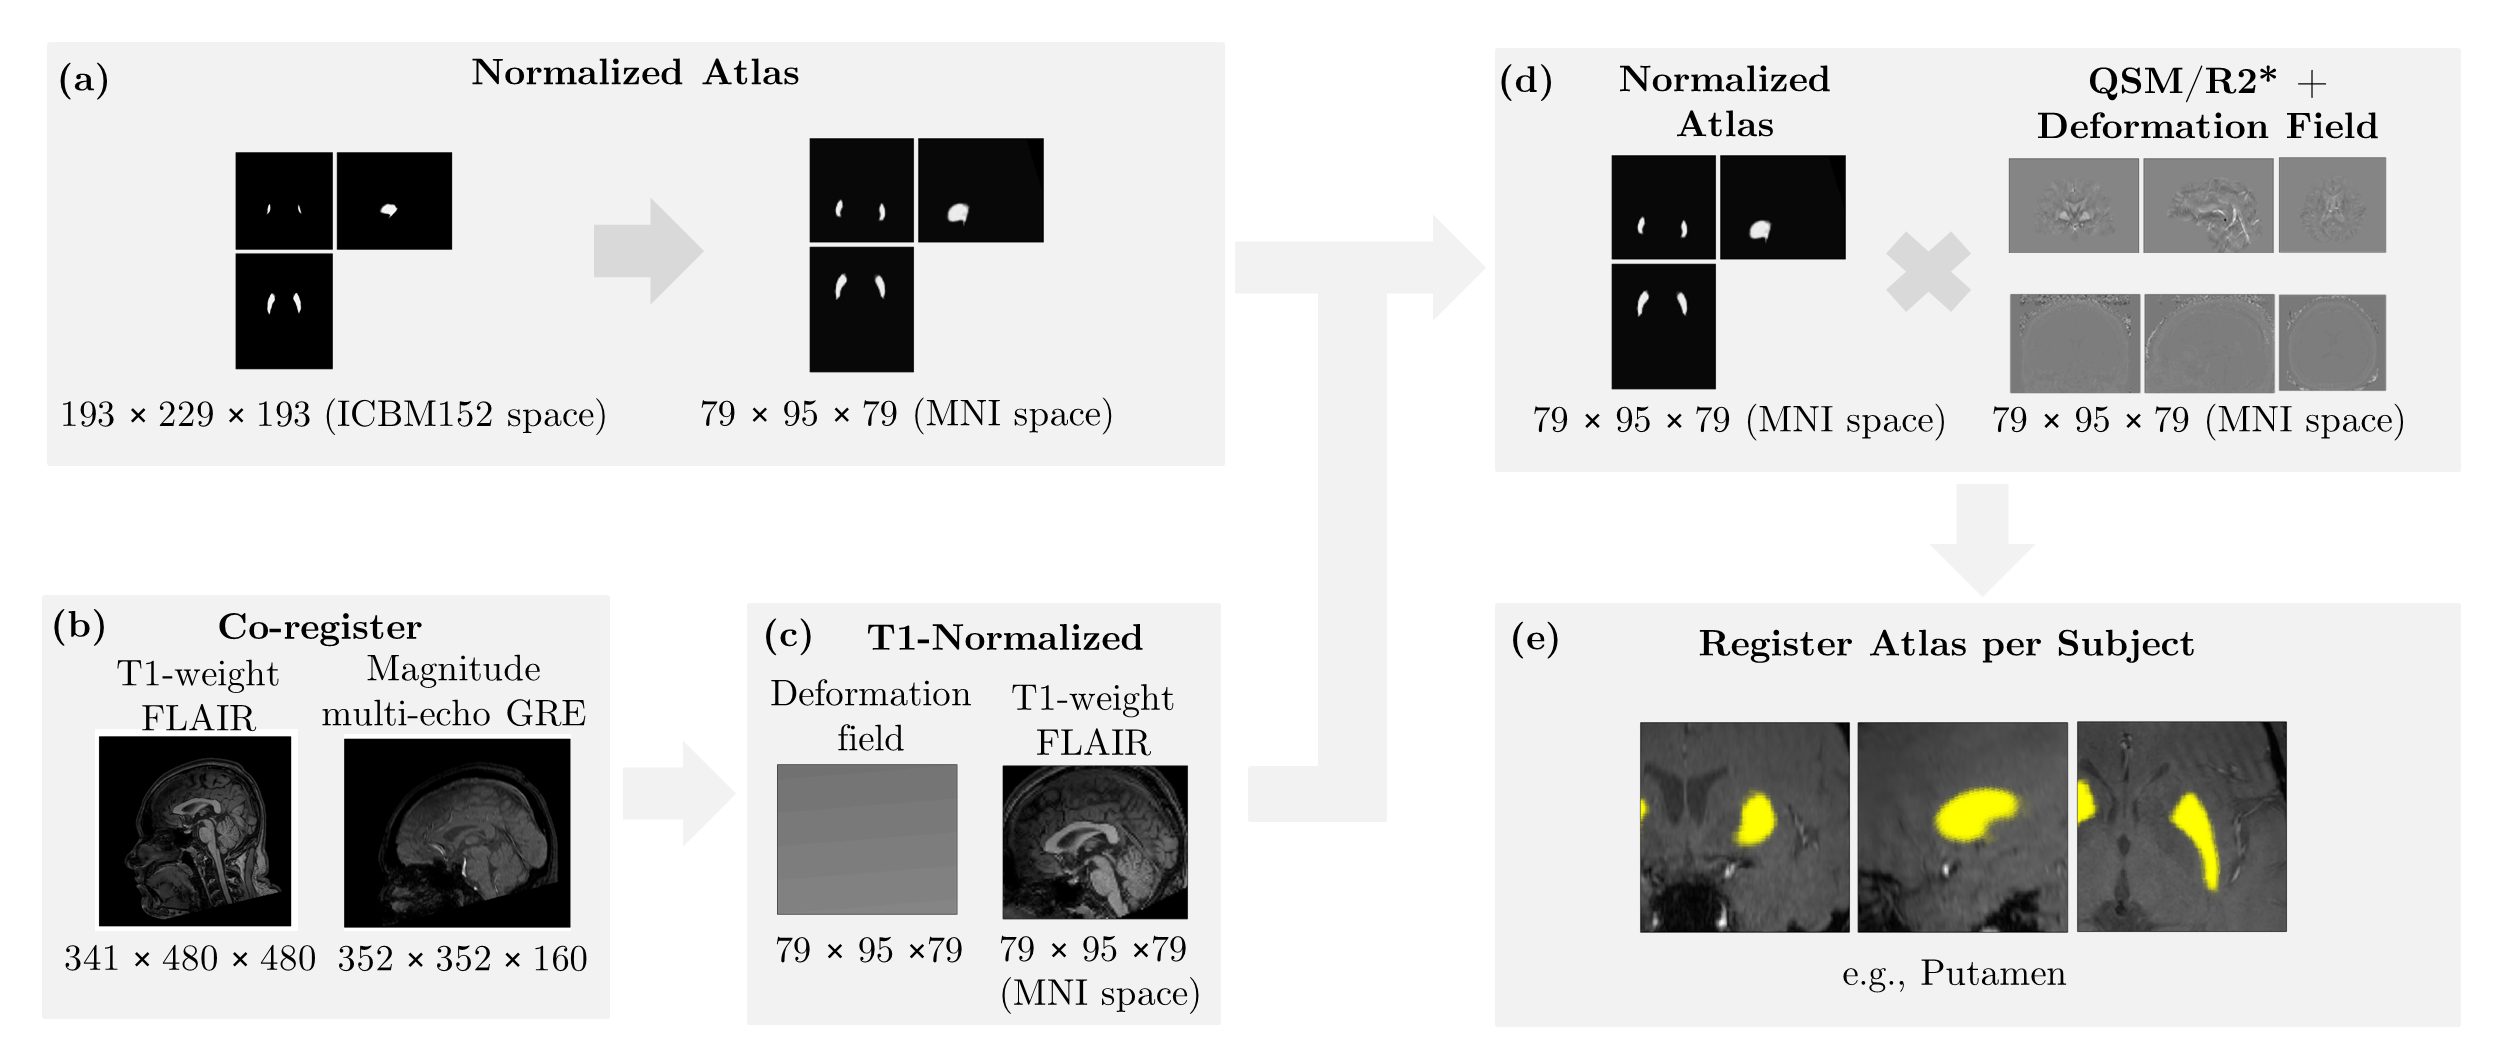
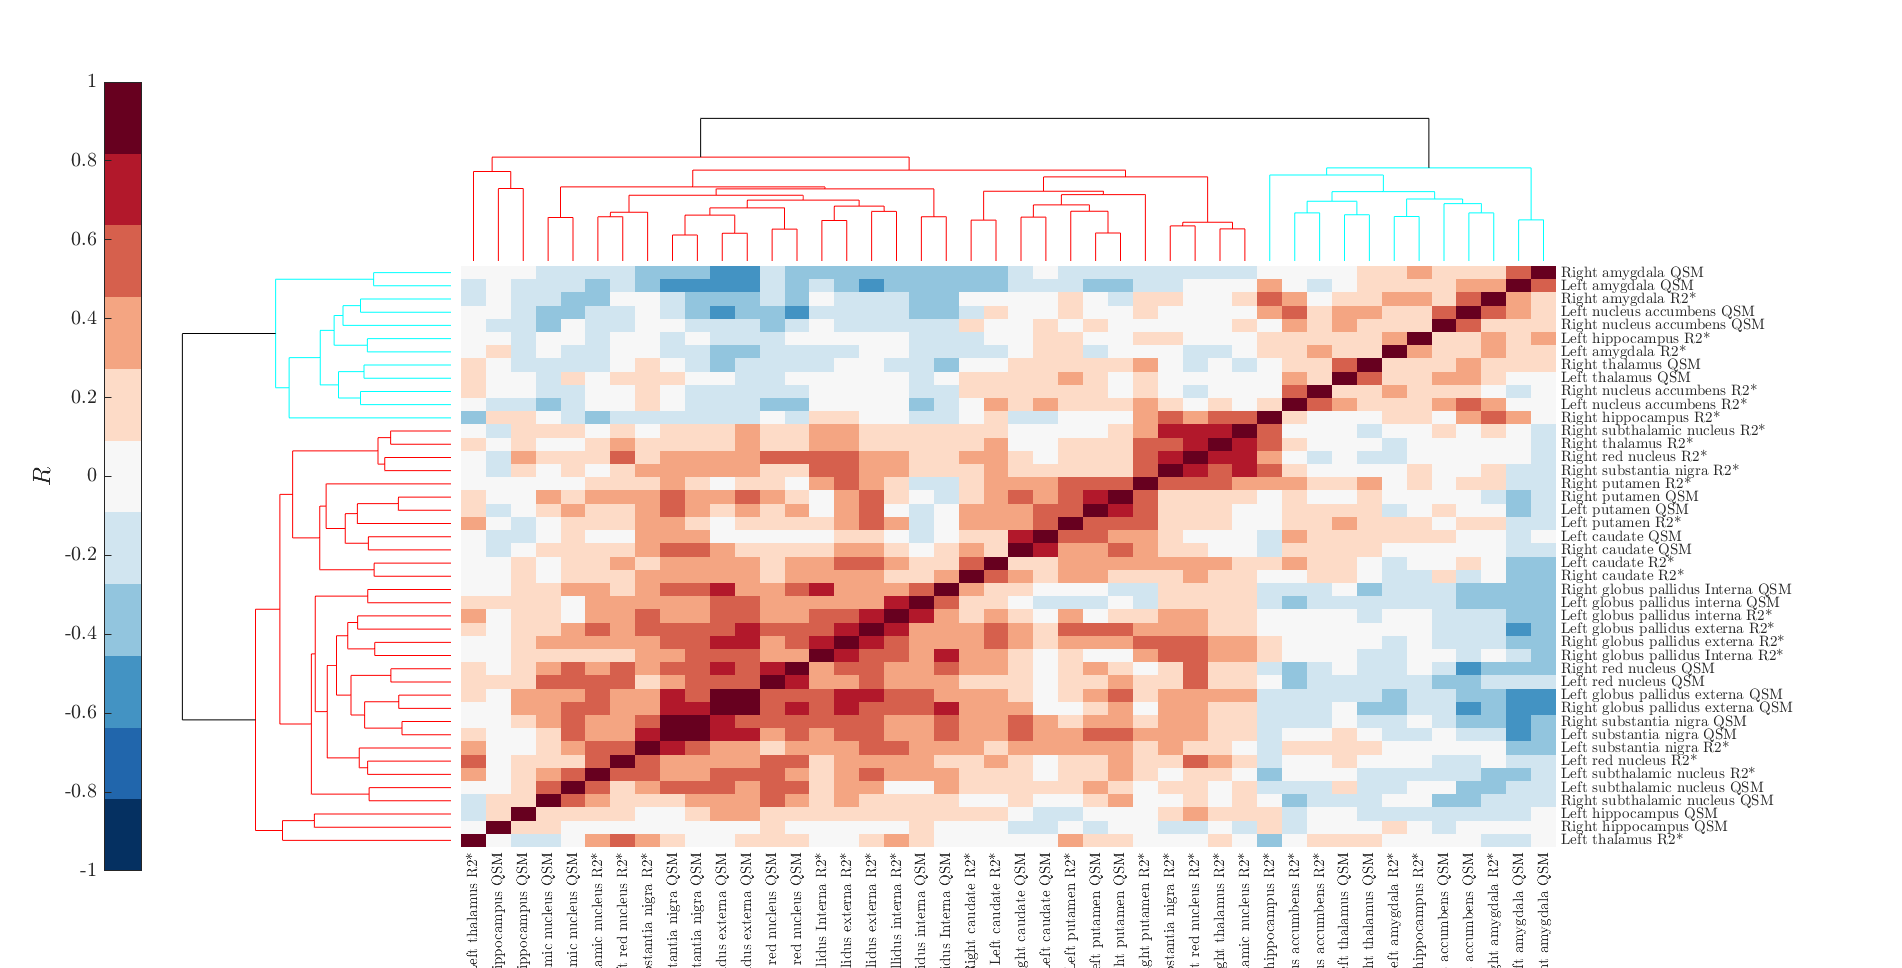
3D multi-echo GRE and T1-weight FLAIR of 52 healthy volunteers and 78 first-episode psychosis patients were acquired in a 3T Philips Ingenia MRI scanner. Table 1 shows the clinical data. QSM and R2* were reconstructed from a 3D multi-echo GRE sequence. QSM reconstruction was performed as in8 using Variable Sophisticated Harmonic Artifact Reduction for Phase data (vSHARP)9 and FAst nonlinear Susceptibility Inversion (FANSI) toolbox10-12. Images were registered and normalized to an NMI space, Figure 1. Twenty-two regions of interest (ROI) of deep GM and subcortical brain nuclei were segmented using the Multicontrast PD25 version 201913-15. We calculated the mean QSM and R2* values for each ROI. An ML model was designed to select those regions which their quantitative susceptibility values adequately discriminate between healthy volunteers (HV) and first-episode psychosis (FEP) patients. We used SHapley Additive exPlanations (SHAP) values to find the importance of each feature on the prediction of the model16 and XGBoost as a classifier17,18. The performance of the classification was evaluated using stratified 10-fold cross-validation. A confusion matrix was constructed based on prediction results in each training and validation sample. Additionally, the Pearson correlation method was used to calculate the correlation matrix between all the quantitative susceptibility mappings. Hierarchical clustering was then applied to classify its rows/columns into groups19-20.Results
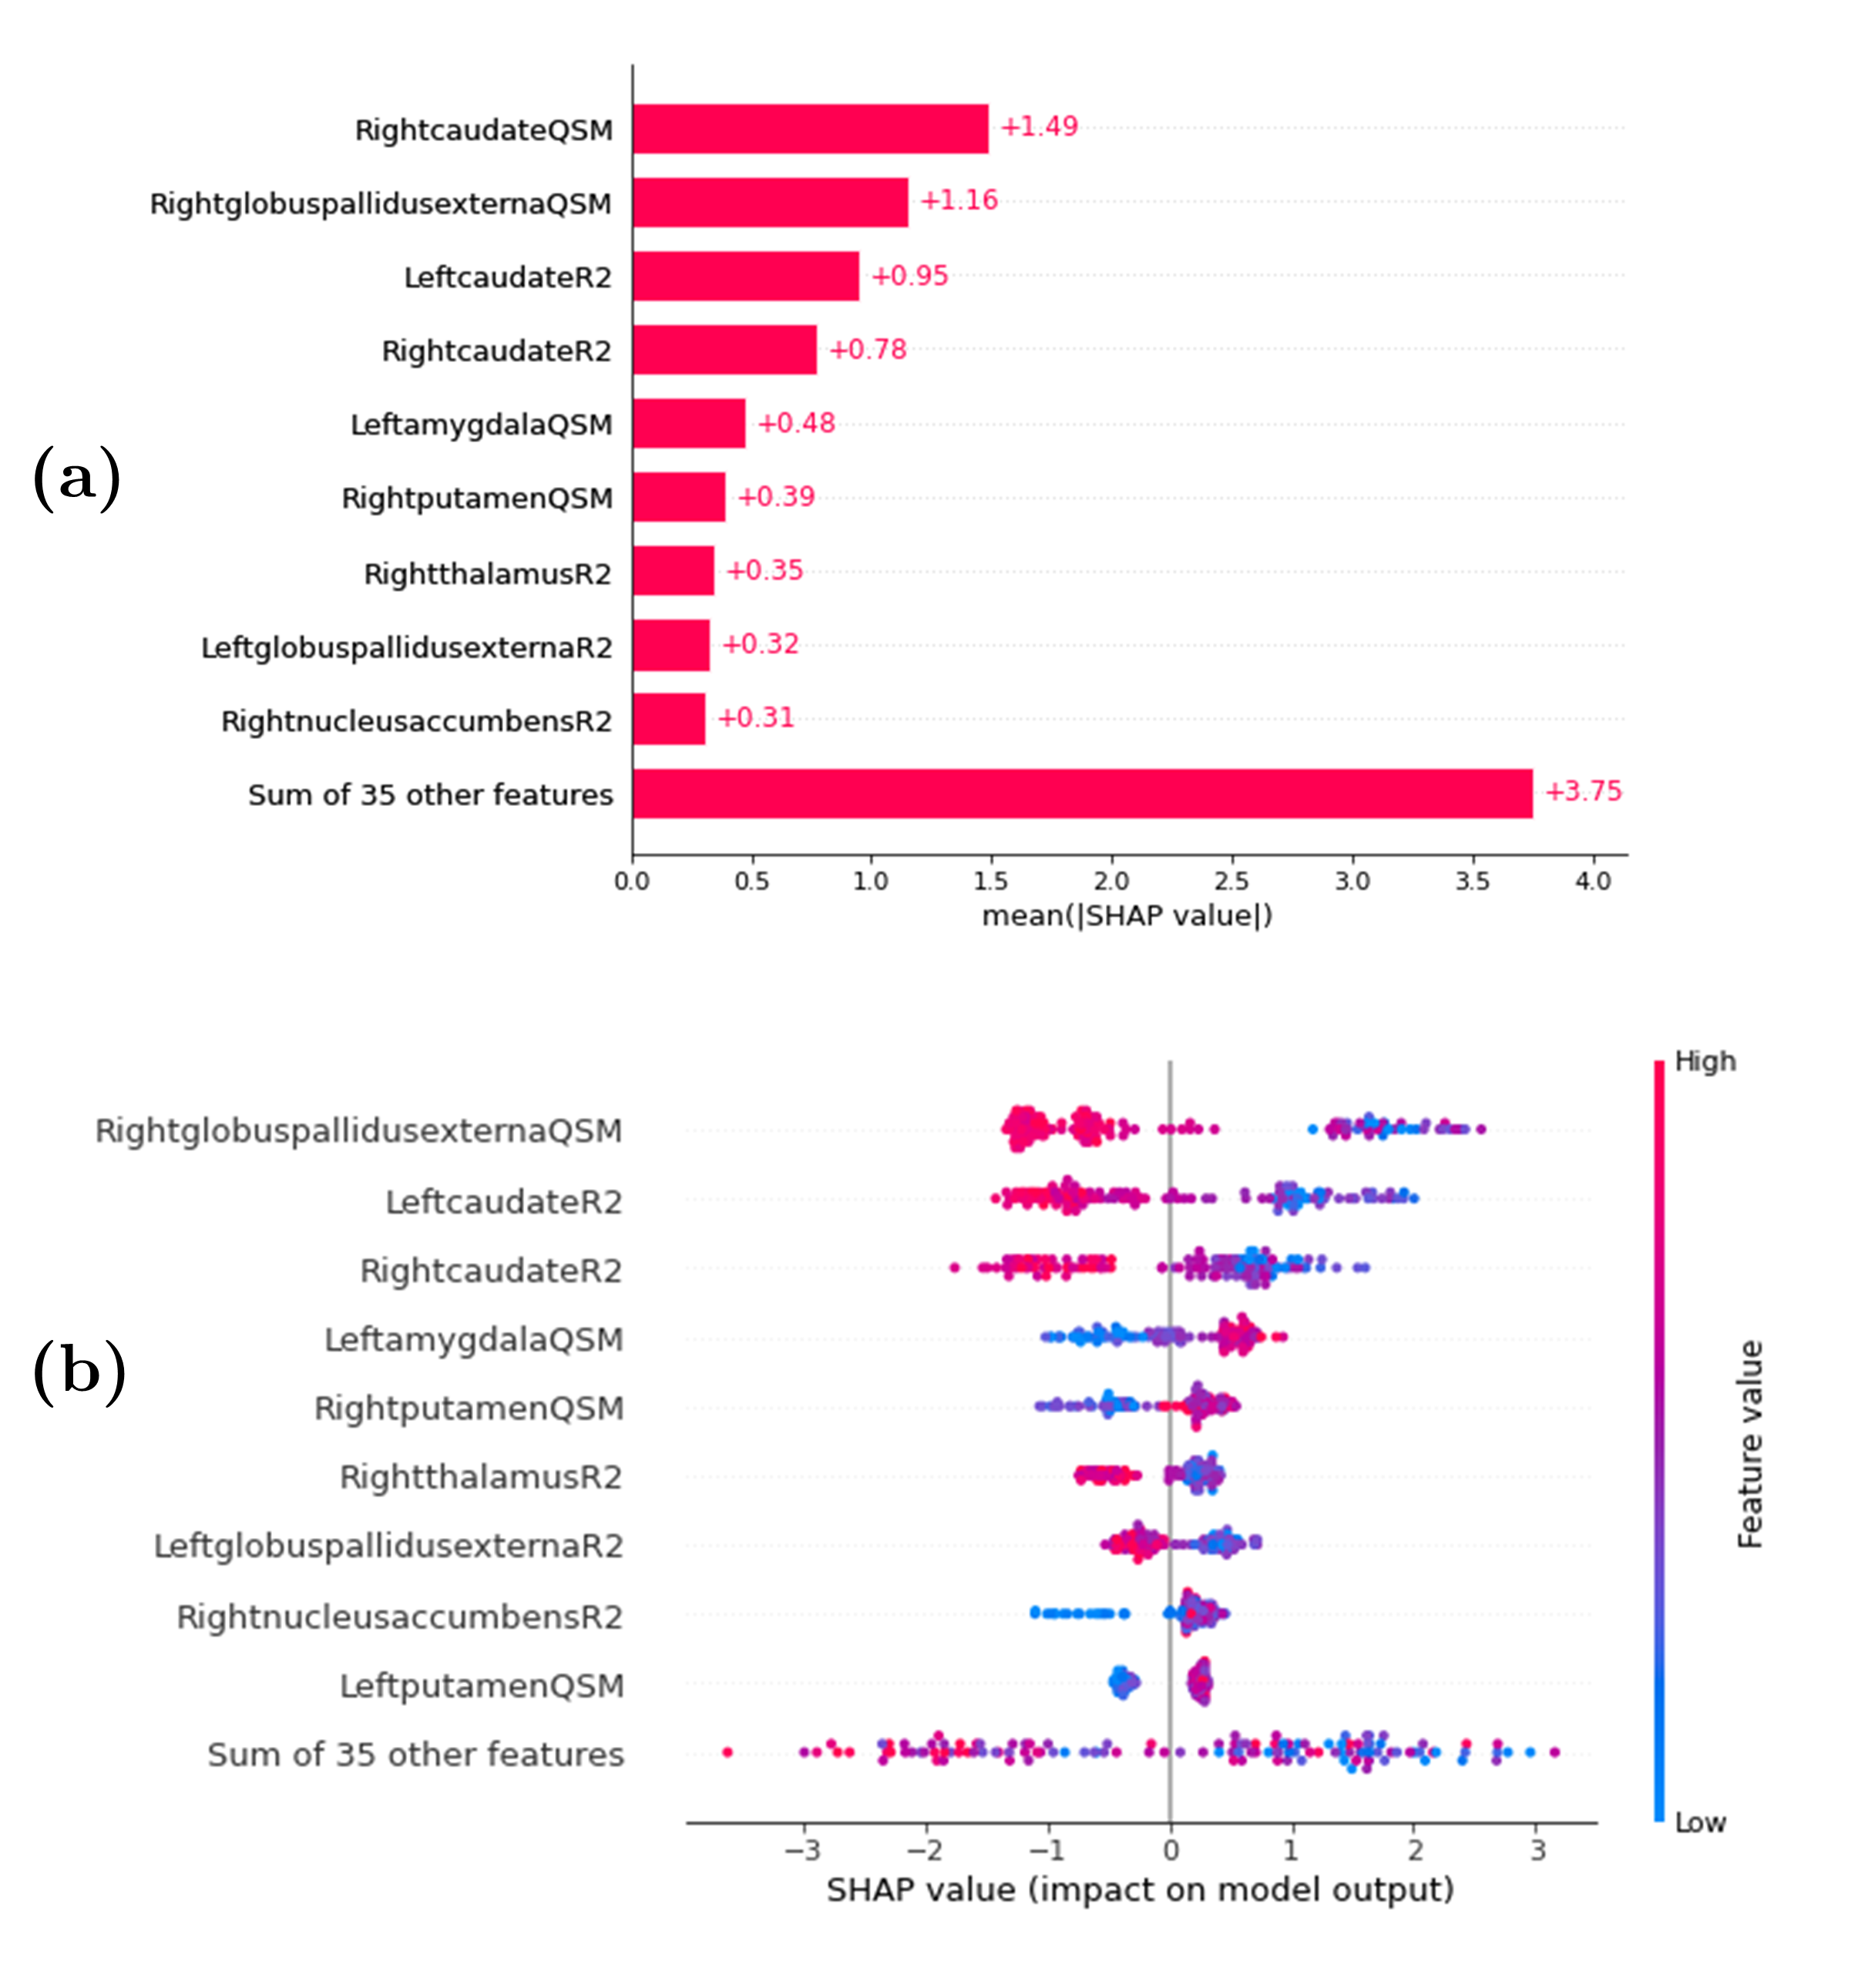
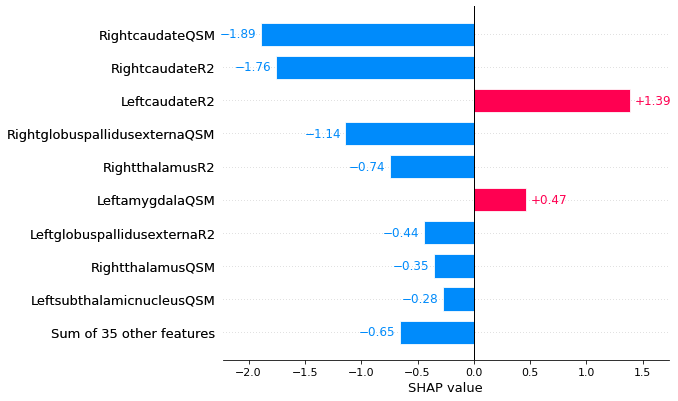
After removing variables using the feature selection, a procedure performed with BorutaShap, nine features were used during the modelling procedure. The model showed a predictive accuracy of 91.6 ± 3.1. (precision: 88.9%, recall: 90.1%, f1-score: 89.5%). The most important predictors of the model are presented in Figure 2. The nine top-performing features were QSM mapping of right caudate, right globus pallidus externa, left amygdala, right putamen, R2* mapping of left caudate, right caudate, right thalamus, left globus pallidus externa, and right nucleus accumbens. The waterfall graph, Figure 3, represents the cumulative sum. Two positive values contribute to the FEP class, R2* mapping of the left caudate and QSM mapping of the left amygdala. While the rest of the nine selected features (QSM mapping of right caudate, right globus pallidus externa, right thalamus, left subthalamic nucleus and R2* mapping of right caudate, right thalamus, and left globus pallidus externa) contributed to distinguish the HV class from the FEP patients. Finally, an analysis of the hierarchical clustering, Figure 4, shows that the parameters selected by SHAP values corresponded to two clusters.Conclusions
Our model can identify FEP patients with an accuracy of 91.6% and find nine quantitative susceptibility maps that characterize FEP patients. Also, we validate how relevant these features are in the classification problem using SHAP values. One of the strengths of our study is that it provides a comprehensive overview of the relative performance of the dopamine pathways for disease prediction. Specifically, in FEP patients, we found that the left caudate and amygdala contribute to identifying this class that it is according to Weinstein et al.21 Since both areas present a dysregulation of dopamine, they generate changes in susceptibility that are measured with QSM images. This important information on relative performance can be used to aid researchers in selecting appropriate susceptibility maps for their studies.Acknowledgements
This work has been funded by projects PIA-ACT192064 and ICN2021_004 of the Millennium Science Initiative Program of the National Agency for Research and Development, ANID. The authors also thank the Fondecyt projects 1181057, 1191710 and 1231535 by ANID and PUENTE grant 2022-14 VRI, PUC. RC-C was funded by ANID Fondecyt Postdoctorado 2021 (Nº 3210305).
References
1.- McCutcheon BA, Abi-Dargham A, Howes OD. Schizophrenia, Dopamine, and the Striatum: From Biology to Symptoms. Trends in Neurosciences. 2019; 42(3):205-220.
2.- Jauhar S, Veronese M, Nour MM, et al., The Effects of Antipsychotic Treatment on Presynaptic Dopamine Synthesis Capacity in First-Episode Psychosis: A Positron Emission Tomography Study. Biological Psychiatry. 2019; 85(1):79-87.
3.- Jing S, Qingbao Y, Pearlson GD, et al., A selective review of multimodal fusion methods in Schizophrenia. Front Hum Neurosci. 2012; 24; 6:27.
4.- Howes O, McCutcheon R, Agid O, et al., Treatment-Resistant Schizophrenia: Treatment Response and Resistance in Psychosis (TRRIP) Working Group Consensus Guidelines on Diagnosis and Terminology, Am J Psychiatry. 2017; 1;174(3):216-229.
5.- Wang Y, Liu T, Quantitative susceptibility mapping (QSM): Decoding MRI data for a tissue magnetic biomarker, Magn Reson Med. 2015; 73(1):82-101.
6.- Xu M, Guo Y, Cheng J, et al., Brain iron assessment in patients with first-episode schizophrenia using quantitative susceptibility mapping, Neuroimage Clin. 2021; 31:102736.
7.- Li D, Hui E, Chan Q, et al., Quantitative susceptibility mapping as an indicator of subcortical and limbic iron abnormality in Parkinson’s disease with dementia, Neuroimage Clin. 2018 27; 20:365-373.
8.- García M, Muñoz N, et al., Quantitative Susceptibility Mapping MRI shows changes in dorsal striatum in patients with a first Episode of Psychosis compared to controls. ISMRM 27th Annual Meeting & Exhibition. 2019.
9.- Kan, H., Arai, N., Takizawa, M., Omori, K., Kasai, H., Kunitomo, H., Hirose, Y., & Shibamoto, Y. (2018). Background field removal technique based on non-regularized variable kernels sophisticated harmonic artifact reduction for phase data for quantitative susceptibility mapping. Magnetic Resonance Imaging, 52, 94–101. https://doi.org/10.1016/j.mri.2018.06.006
10.- Milovic C, Bilgic B, Zhao B, et al., Fast nonlinear susceptibility inversion with variational regularization. Magn Reson Med. 2018; 80(2):814-821.
11.- Milovic C, Bilgic B, Zhao B, et al., Weak-harmonic regularization for quantitative susceptibility mapping. Magn Reson Med. 2019;81(2):1399-1411.
12.- Milovic C, Prieto C, Bilgic B, et al., Comparison of parameter optimization methods for quantitative susceptibility mapping. Magn Reson Med. 2021;85(1):480-494.
13.- Xiao Y, Fonov V, Bériault S, et al., Multi-contrast unbiased MRI atlas of a Parkinson’s disease population. Int J Comput Assist Radiol Surg. 2015; 10(3):329-41.
14.- Xiao Y, Bériault S, Pike GB, et al. Multicontrast multi-echo FLASH MRI for targeting the subthalamic nucleus. Magn Reson Med. 2012;30(5):627-640.
15.- Xiao Y, Fonov V, Chakravarty, et al. A dataset of multi-contrast population-averaged brain MRI atlases of a Parkinson’s disease cohort. Data in Brief. 2017; 12:370-379.
16.- Lundberg S, Lee SI. A unified approach to interpreting model predictions. Proceedings of the 31st International Conference on Neural Information Processing Systems. 2017: 4768-4777.
17.- Yuan KC Tsai LW, Lee KH, et al. The development of an artificial intelligence algorithm for early sepsis diagnosis in the intensive care unit. Int J Med Inform. 2020; 141:104176.18.- Chen T, Guestrin C. XGBoost: a scalable tree boosting system. In: Proceedings of the 22nd ACM SIGKDD international conference on knowledge discovery and data mining-KDD 2016, San Francisco, CA, USA; 2016. P.785-94.
18.- Gu Y, Wang C. A Study of Hierarchical Correlation Clustering for Scientific Volume Data, Advances in Visual Computing, 2010, Volume 6455. ISBN: 978-3-642-17276-2
19.- Gu Y, Wang C. A Study of Hierarchical Correlation Clustering for Scientific Volume Data, Advances in Visual Computing, 2010, Volume 6455. ISBN: 978-3-642-17276-2
20.- Ciaburro G. MATLAB for Machine Learning: Practical examples of regression, clustering and neural networks, Publisher: Packt Publishing, 2017, ISBN: 978-1788398435
21.- Weinstein J, Chohan M, Slifstein M, et al., Pathway-specific dopamine abnormalities in schizophrenia. Biol Psychiatry. 2017; 81(1):31-42.
Figures