0649
Quantitative MRI biomarkers of pathology in a Poly I:C rat lactational model of schizophrenia and depression1Sagol School of Neuroscience, Tel Aviv University, Tel Aviv, Israel, 2Department of Biomedical Engineering, Tel Aviv University, Tel Aviv, Israel, 3School of Psychological Sciences, Tel Aviv University, Tel Aviv, Israel, 4Center of AI and Data Science (TAD), Tel Aviv University, Tel Aviv, Israel, 5Center for Advanced Imaging Innovation and Research (CAI2R), New-York University Langone Medical Center, New York, NY, United States
Synopsis
Keywords: Psychiatric Disorders, Quantitative Imaging, Psychiatric disorders, Neuroscience, Multi-Contrast
Many psychiatric conditions lack radiologic markers of disease. In this study, we investigated the utility of quantitative MRI (qMRI) for detecting pathology in the lactational immune activation rat model of schizophrenia and depression. Results show that a logistic regression model can identify the disease with an accuracy of 81% based on a combination of T1 and T2, mean diffusivity, and fractional anisotropy values. This finding suggests that multiparametric qMRI is useful for monitoring pathology with an objective quantitative tool that goes beyond structural deformations and improves the sensitivity to microstructural and neurochemical pathology in the lactational immune activation rat model.Introduction
Mental illnesses are gaining increased attention and recognition as organic, brain-related phenomena that should be investigated and understood1. Schizophrenia and depression are two specific illnesses that significantly impact the quality of life2,3.Lactational immune activation using the viral mimic poly-I:C is an established rat model of depression (in females) and schizophrenia (in males)4. This model exhibits limited and non-specific radiologic changes like expanded lateral ventricles and general brain atrophy5,6.
Quantitative MRI (qMRI) can be used to map various MR properties linked to the tissues’ microstructure and biochemistry and was shown to improve MRI’s accuracy and sensitivity to patholgies7. qMRI values are, moreover, reproducible across scanners and scan settings, providing an objective radiological marker of diseases8.
This study investigated the utility of a multi-parametric, multi-region, qMRI logistic regression classifier to differentiate between healthy and poly I:C rat lactational model.
Methods
Animal. Forty Wistar rats were divided into a 2 x 2 array: males vs. females and Poly I:C vs. control (10 rats per group). On the fourth postnatal day (PND), Poly I:C or saline was injected into the lactating dams, with no more than one rat per litter in an experimental group. All experimental protocols conformed to the local Institutional Animal Care and Use Committee and NIH guidelines.MRI scans and Generation of quantitative maps. MRI scans were done at adulthood (PND 130) on a 7T Bruker Biospec scanner using a 2-channel transceiver coil. Scans included T1 mapping using multi flip-angle FLASH protocol9 processed using the method in [10] [TR/TE=25/2.8 ms, slice thickness = 0.8 mm, voxel size = 0.15x0.15 mm2, Nslices=26, flip-angles = 3°,6°,10°,15°, and 30°]; T2 mapping using a multi-echo spin-echo (MESE) protocol processed using the EMC algorithm11 and including diffusion correction12 [TR/TE=3200/5.9 ms, slice thickness=0.8 mm, resolution: 0.15x0.15 mm2, Nslices=24, Naverages=2, partial Fourier = 6/8]; Mean diffusivity (MD) and fractional anisotropy (FA) were calculated from DTI-EPI data using the ExploreDTI software package13 [TR/TE=4000/19.2 ms, slice thickness=0.8 mm, resolution: 0.267x0.267 mm2, Nslices=24, Naverages = 2, Ndirections = 32, b-values: 0, 1000 mm2/sec].
Image segmentation: Regions of interest (ROIs) in the brain were manually segmented using MATLAB image processing tools. Quantitative values (features) were extracted for each ROI, including mean, standard deviation (SD), standard error of the mean (SE), and 5, 10, 25, 50 (median), 75, 90, and 95 percentile values.
Statistical analysis. Spearman correlation was performed between each quantitative feature in each ROI and the rat's pathological state (i.e., healthy control or poly I:C) in order to assess this feature’s ability to predict the animal state. A pairwise correlation was subsequently computed between all features to identify linearly dependent features and exclude highly correlated features (R ≥ 0.65). This reduced the overall number of parameters to a set of pseudo-orthogonal features. A logistic regression model was trained to discriminate between the control and poly I:C rats using the remaining subset of features. Data were separated to train and validation (N=28 rats) and test (N=12 rats) to estimate the model’s accuracy. Train and validation were done by 5-fold cross-validation. This means that the data from N=28 rats were split into five sets, and the model was trained five times, each time on 4 out of the five sets, while the fifth was used for validation. The overall model’s accuracy was calculated as the average across a thousand random permutation accuracies.
Results
Representative qMRI maps are shown in Figure 1, including T1, T2, FA, and MD maps. Figure 2 illustrates the seven segmented ROIs overlaid on T1-weighted images.Spearman correlations (R values) between each quantitative feature and the rat’s state (control rat vs. poly I:C rat) are presented in Table 1. R-values marked with a mild green background indicate correlations above the 90th percentile of all R-values. Values with the dark-green background and bold font in Table 1 correspond to features that were kept after removing highly dependent features according to the pairwise correlation shown in Figure 3 (i.e., after removing features that exhibited linear correlation > 0.65).
The ensuing subset of pseudo-orthogonal features (dark green) was used in the logistic regression mode shown in Figure 4. This demonstrates the ability of a machine learning classifier to separate rats between the two groups with an average accuracy of 81 %, based solely on radiological markers.
Discussion
This work investigated the utility of qMRI for identifying pathology in the Poly I:C lactational rat model showing schizophrenia-like symptoms in males and depression-like symptoms in females. The added value of this radiomic approach lies in identifying pathology beyond standard morphologic changes through a comprehensive set of quantitative values covering multiple brain regions. The quantitative values allowed the construction of a multidimensional machine-learning classifier exhibiting improved sensitivity to disease states14.qMRI-based radiomic profiling of Poly I:C offspring offers a new and objective tool for probing and evaluating animal states. This provides a twofold advantage: first, the higher sensitivity of qMRI for detecting early and subtle tissue changes that cannot be visually observed; second, it offers reproducible values across scanners and scan settings, thereby facilitating the use of longitudinal studies15.
Acknowledgements
No acknowledgement found.References
1. Soria, V. et al. Psychoneuroimmunology of mental disorders ଝ. Rev. Psiquiatr. y salud Ment. (English Ed. 11, 115–124 (2018).
2. Fatani, B. Z. et al. Schizophrenia : Etiology, Pathophysiology and Management : A Review. Egypt. J. Hosp. Med. 31, 1–7 (2017).
3. Sandmire, H. F., Austin, S. D. & Bechtel, R. C. Depression and Other Common Mental Disorders. Obstet. Gynecol. 48, 56–60 (2007).
4. Arad, M., Piontkewitz, Y., Albelda, N., Shaashua, L. & Weiner, I. Immune activation in lactating dams alters sucklings’ brain cytokines and produces non-overlapping behavioral deficits in adult female and male offspring: A novel neurodevelopmental model of sex-specific psychopathology. Brain. Behav. Immun. 63, 35–49 (2017).
5. Ibi, D. et al. Combined effect of neonatal immune activation and mutant DISC1 on phenotypic changes in adulthood. NIH Public Access 206, 32–37 (2011).
6. Abazyan, B. et al. Prenatal interaction of mutant DISC1 and immune activation produces adult psychopathology. Biol. Psychiatry 68, 1172–1181 (2010).
7. Tofts, P. S. Concepts: Measurement in MRI. Princ. Phys. Meas. 1–12 (2018).
8. Alexander, A. L. et al. Characterization of Cerebral White Matter Properties Using Quantitative Magnetic Resonance Imaging Stains. Brain Connect. 1, 423–446 (2011).
9. Haase, A., Frahm, J., Matthaei, D., Hanicke, W. & Merboldt, K. D. FLASH imaging. Rapid NMR imaging using low flip-angle pulses. J. Magn. Reson. 67, 258–266 (1986).
10. Fram, E. K. et al. Rapid calculation of T1 using variable flip angle gradient refocused imaging. Magn. Reson. Imaging 5, 201–208 (1987).
11. Ben-Eliezer, N., Sodickson, D. K. & Block, K. T. Rapid and accurate T2 mapping from multi–spin-echo data using Bloch-simulation-based reconstruction. 809–817 (2015).
12. Bnaiahu, N. et al. Correcting for imaging gradients–related bias of T2 relaxation times at high-resolution MRI. Magn. Reson. Med. 88, 1806–1817 (2022).
13. Leemans, A., Jeurissen, B., Sijbers, J. & Jones, D. K. ExploreDTI: a graphical toolbox for processing, analyzing, and visualizing diffusion MR data. Proc. Int. Soc. Magn. Reson. Med. 17, 3537 (2009).
14. Vabalas, A., Gowen, E., Poliakoff, E. & Casson, A. J. Machine learning algorithm validation with a limited sample size. PLoS One 14, 1–20 (2019).
15. Deoni, S. C. L. et al. Standardized structural magnetic resonance imaging in multicentre studies using quantitative T1 and T2 imaging at 1.5 T. Neuroimage 40, 662–671 (2008).
Figures
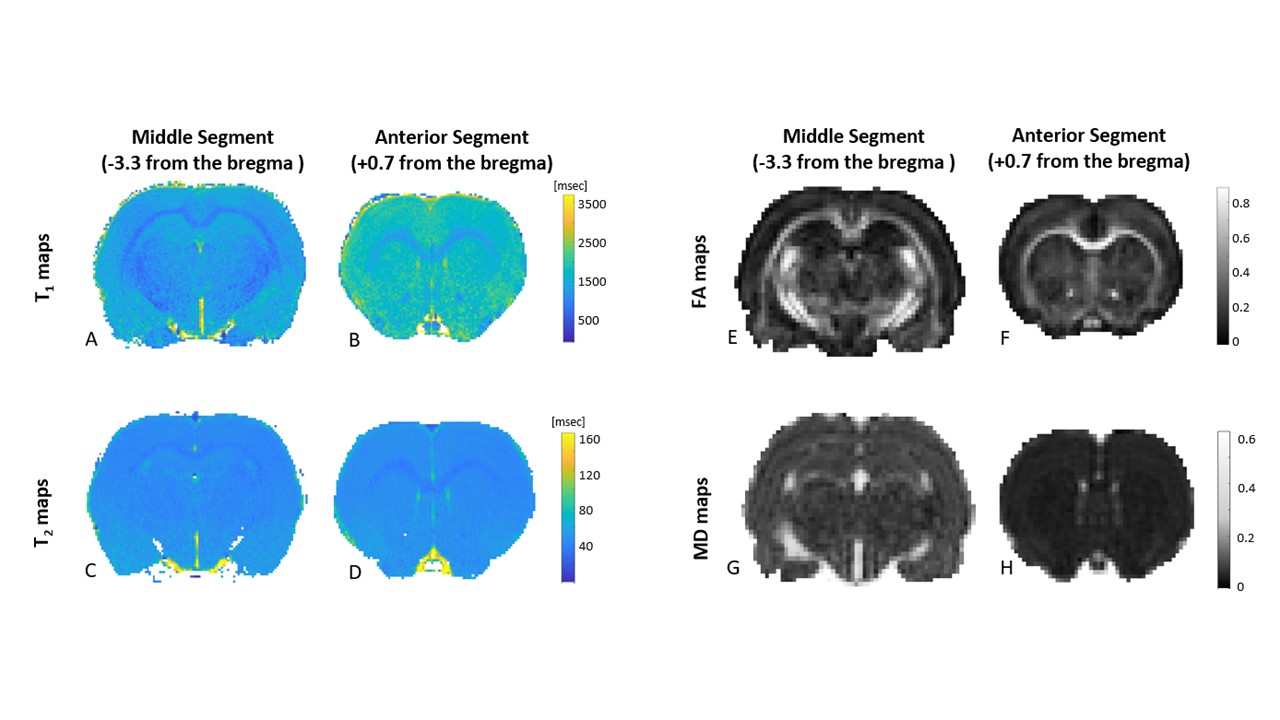
Figure 1: Representative quantitative MRI maps. Two slices located middle (-3.3) and anterior segment (+0.7) mm from the bregma correspond to the left and right columns.
A,B. Colored T1 map originating from FLASH protocol and calculated with T1 flip angle equation.
C,D. Colored T2 map originating from MESE protocol and EMC algorithm.
E,F. Fractional Anisotropy map originating from EPI-DTI protocol and calculated with ExploreDTI.
G,H. Mean Diffusivity map originating from EPI-DTI protocol and calculated with ExploreDTI.
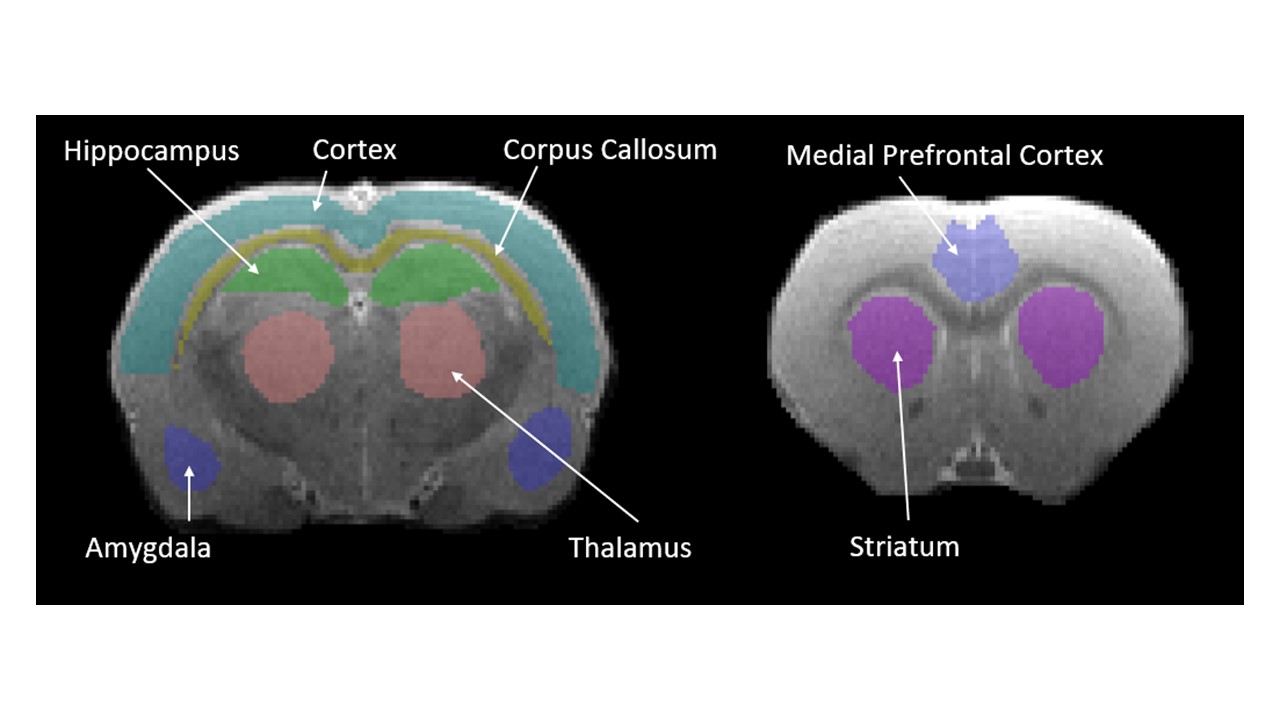
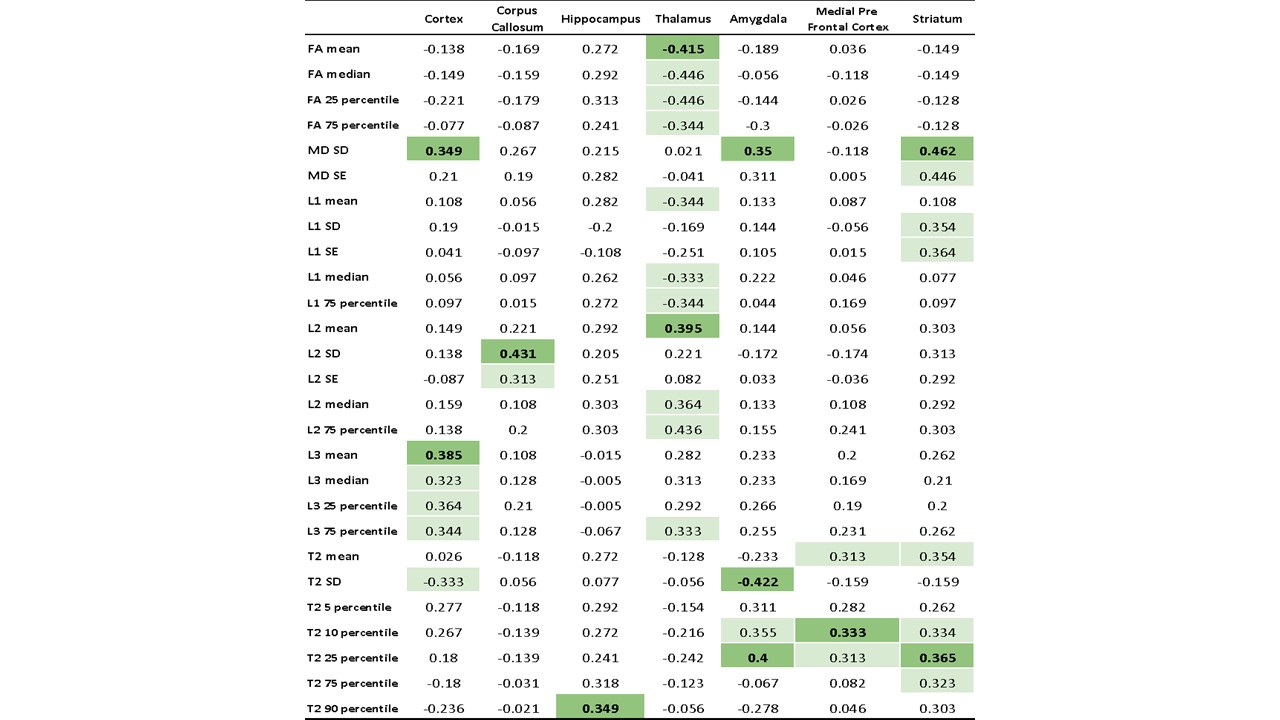
Table 1: Spearman correlation between qMRI parameters’ values in each ROI and rat disease state (i.e., healthy control vs. Poly I:C).
Values marked in the mild green background indicate above the 90 percentiles of all the correlations. The bold font and solid green background denote the final features chosen for the logistic regression model after the cross-correlation check in figure 3.
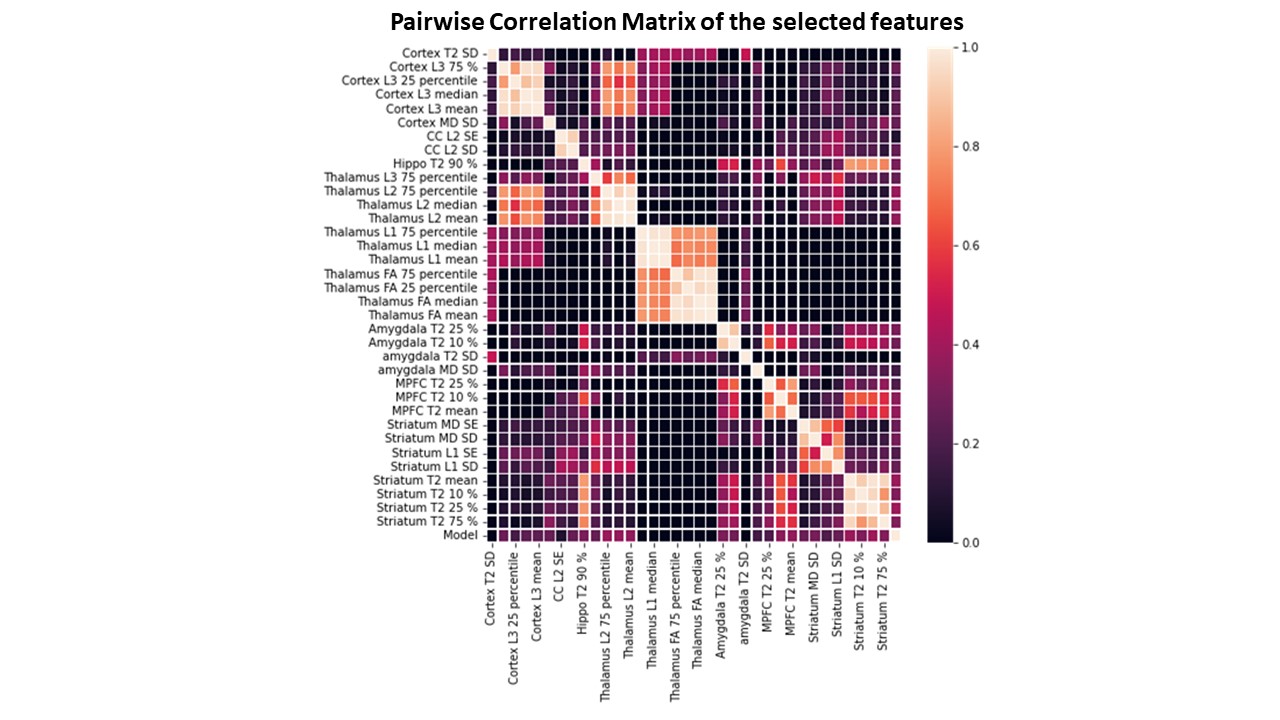
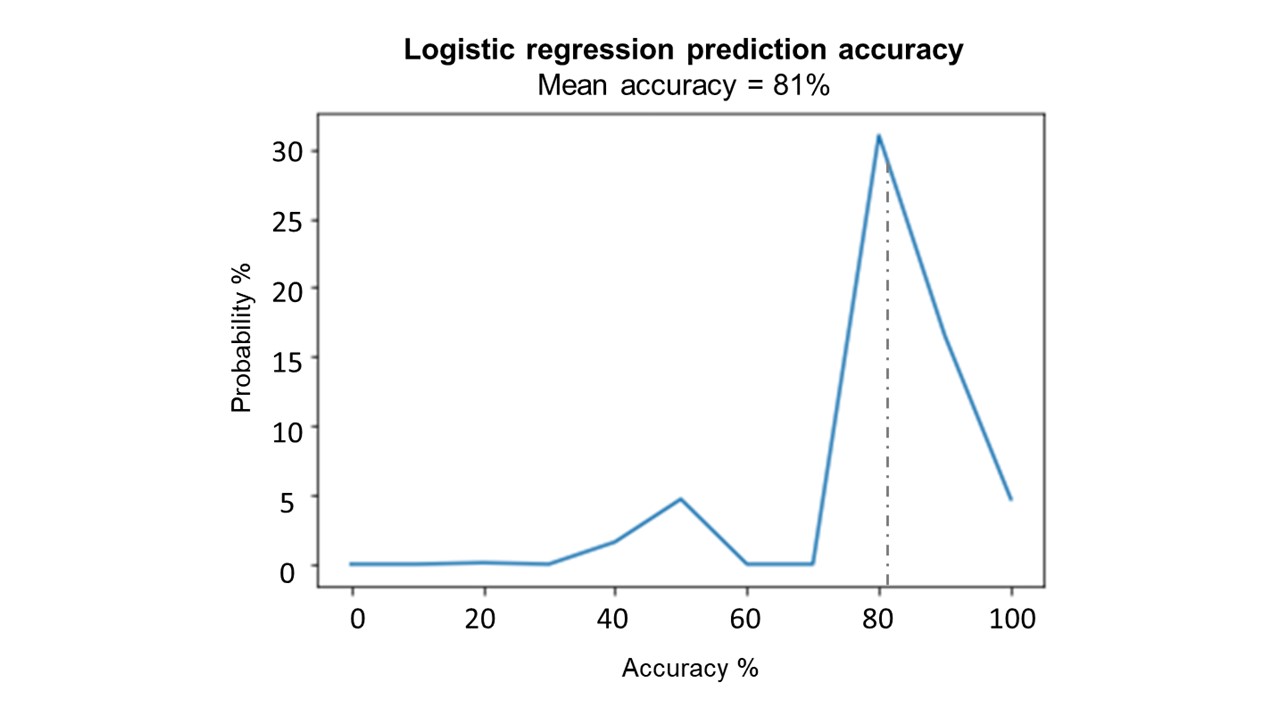
Figure 4: Accuracy distribution and the average predictive accuracy for a logistic regression machine learning classifier.
Discriminate with an average accuracy of 81% was achieved between the healthy control group and the poly I:C group. The figure contains 1,000 iterations of the model, which was trained on random separation of the acquired data into training, validation, and testing.