0646
7T MRI and PET in Tourette Syndrome: Correlations between subcortical dopamine receptor availability and susceptibility1NMR Group, Max Planck Institute for Human Cognitive and Brain Sciences, Leipzig, Germany, 2Department of Nuclear Medicine, University of Leipzig, Leipzig, Germany, 3Clinic of Psychiatry, Social Psychiatry and Psychotherapy, Hannover Medical School, Hannover, Germany, 4Max Planck Institute for Human Cognitive and Brain Sciences, Leipzig, Germany
Synopsis
Keywords: Psychiatric Disorders, PET/MR, QSM, 7T, Tourette Syndrome, PET, Dopamine, Receptors, D1
We present interim results of the first combined 7T MRI and [11C]-SCH23390 PET study in Gilles de la Tourette syndrome (GTS). Dopamine D1-receptor availability is assessed in combination with Quantitative Susceptibility Mapping (QSM). Our results indicate reduced iron concentrations in subcortical grey matter of GTS patients compared to age- and sex-matched controls, accompanied by reduced D1-receptor binding potential in several regions. Correlations between local iron distribution and D1-receptor binding potential in basal ganglia support the hypothesis that iron homeostasis might play a significant role in dysregulations of the dopaminergic system that eventually lead to the characteristic symptomatology of GTS.Introduction
Dopaminergic system dysregulation is the major hypothesis for the occurrence of the motor and vocal tics in Gilles de la Tourette syndrome (GTS), although the question of whether these abnormalities are of primary or secondary nature remains1,2,3. MRI and PET studies have shown abnormalities in D-2/3 receptors and other neurotransmitter systems4,5. As a result of this consensus, until now drugs were based on D2-receptor antagonists, with Ecopipam being an exception, as a D1-receptor antagonist6.Additional to Ecopipam’s promising results in the reduction of clinical manifestations, post-mortem studies indicate alterations also in D1-receptors in GTS7. Despite this, D1-receptor connections to GTS symptomatology and potential abnormalities in their distribution are yet to be assessed. Brain iron―especially in subcortical areas―has a significant role in neurotransmitter production and metabolism, including dopamine, and is thus seen as a substance of major importance in multiple psychopathologies8.
In our study, we used [11C]-SCH23390 PET for assessing the distribution and availability of D1-receptors as well as 7T MRI for quantitative susceptibility mapping (QSM) as proxy of brain iron.
Methods
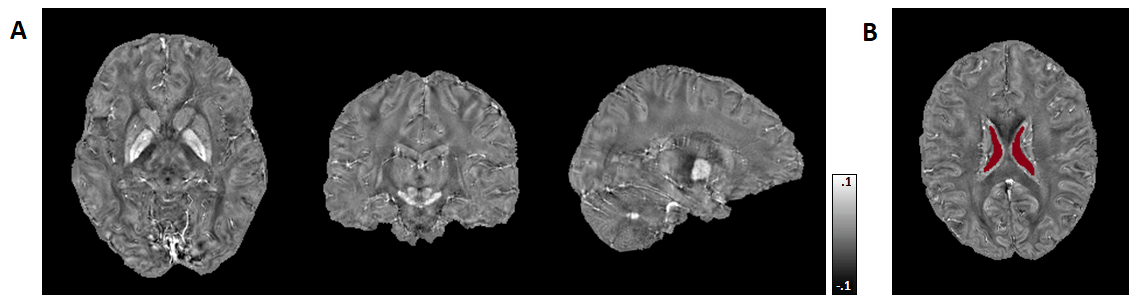
Till present, 14 GTS patients (Ages: 30±9.4 years, 2 females, 2 dropouts due to strong head tics) and 15 controls (Ages: 32±4.4 years, 4 females) have been recruited, while 7 GTS patients and 6 controls participated also in the 3T MR/PET acquisition. 7T MRI acquisitions were obtained on a MAGNETOM Terra (Siemens Healthineers) including MP2RAGE structural scans (1mm isotropic nominal resolution) and ME-GRE (0.8mm isotropic; 9 echoes, TEmin 5ms, echo spacing 4.1ms; and TR= 48ms). 3T PET-MR data were acquired on a Biograph mMR (Siemens Healthineers) using the radionuclide [11C]-SCH233909 with a regular clinical protocol: After 90s bolus injection of 483 ± 30 MBq, participants underwent a 90min dynamic PET scan.FSL10 was used for skull striping and background masking of both GRE and T1w MP2RAGE volumes. QSM processing was based on the acquisition with TE=13.2ms, including Laplacian phase unwrapping11,12 and V-SHARP12,13 background field removal as well as Q-star for field-to-source inversion12. The QSM values were referenced to the mean in a well-defined ventricular region14 (Figure 1). The dynamic PET data were motion-corrected and co-registered to individual 3T MP2RAGE data. Kinetic modeling was performed for generation of binding potential (BPND) and relative delivery (R1) parametric maps, using MRTM2 with cerebellar cortex as reference region9.
The 7T and 3T MP2RAGE volumes were corrected and co-registered using ANTs registration to the GRE space. Volumetric segmentation was performed with FreeSurfer 5.315 on MP2RAGE data, followed by further processing that allowed for better differentiation of basal ganglia structures. Brainstem nuclei of interest were delineated manually using MRIcron. The segmentation maps and 3T MP2RAGE volumes were also co-registered to MNI space16 for obtaining the BPND and R1 maps of specific subcortical ROIs. Further statistical evaluation and visualization was done using Python.
Results
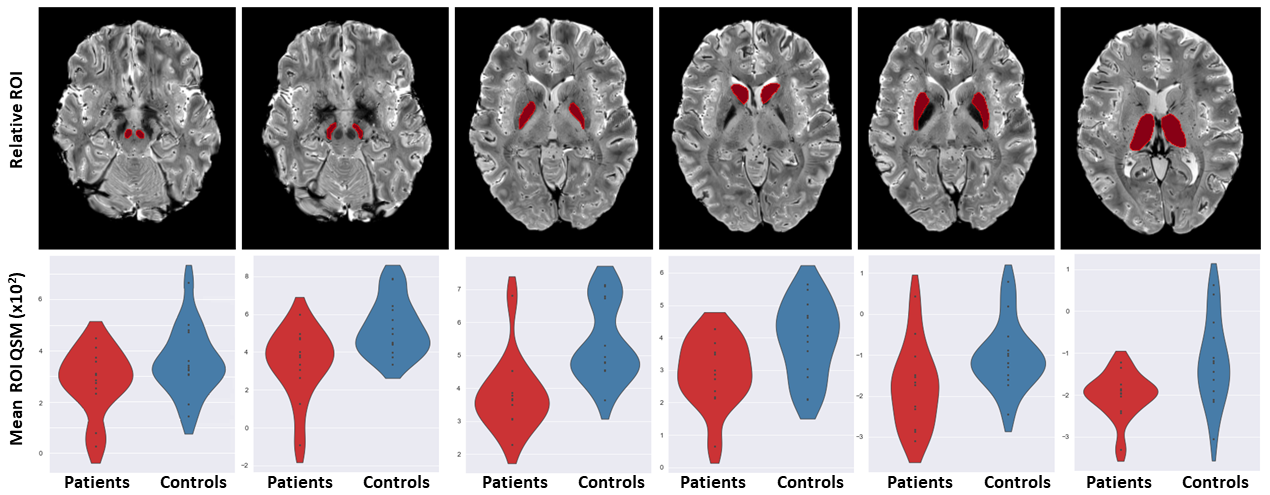
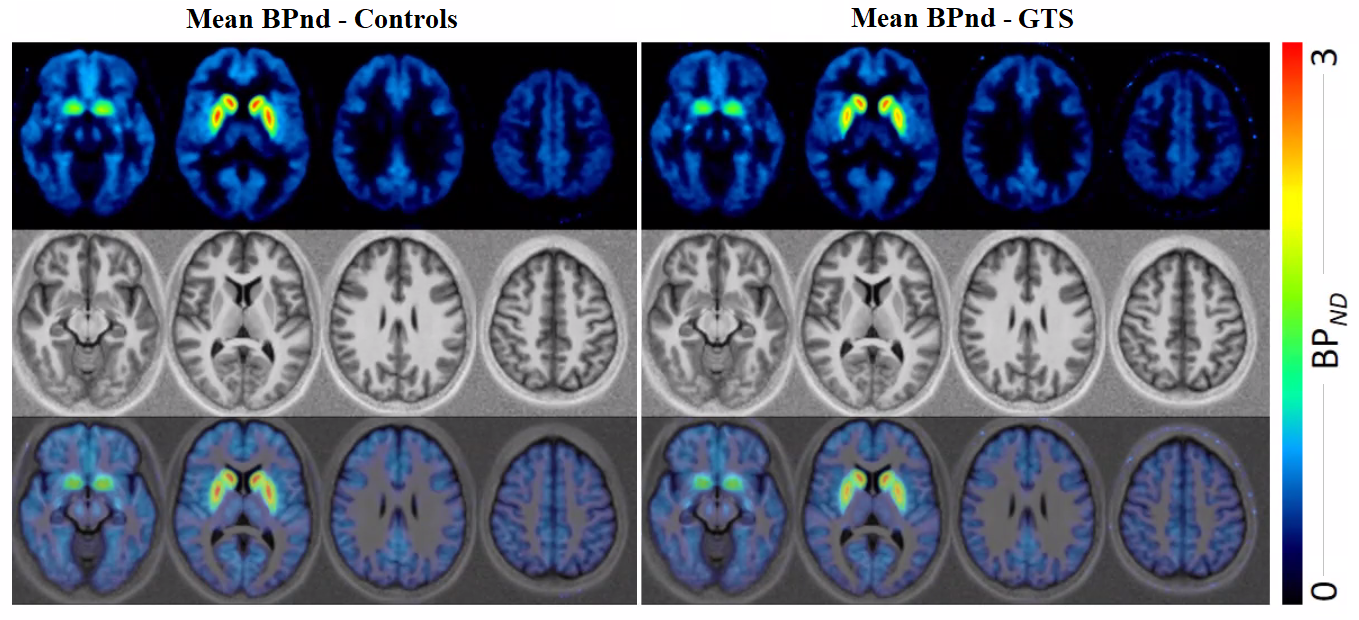
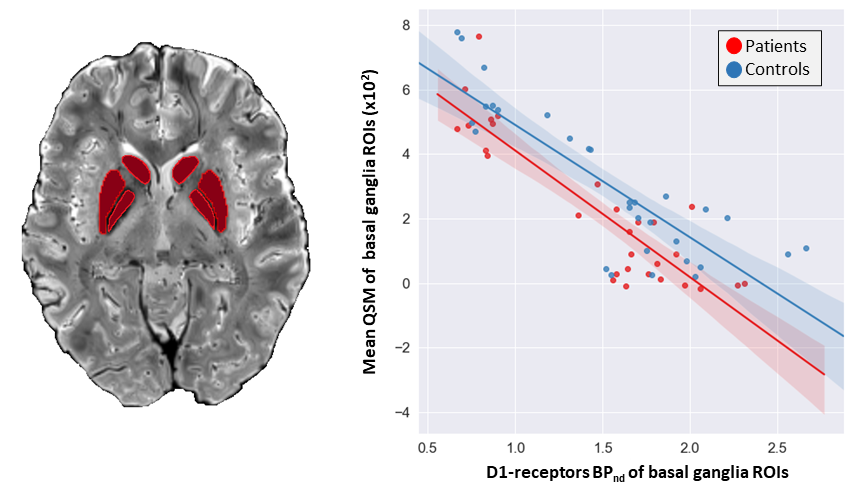
Statistical differences of the 7T QSM results between GTS patients and controls in basal ganglia and brainstem regions are reported as violin plots in Figure 2. The p-values (Mann-Whitney test) indicated statistical significance in thalamus (p=0.02), substantia nigra (p=0.01), caudate (p=0.02), putamen (p=0.02) and pallidum (p=0.007).Figure 3 shows mean D1 BPND obtained with PET in patients and controls, indicating reduced mean activity in subcortical regions. Correlations (p<10–4) between D1 BPND and mean susceptibility values in basal ganglia ROIs are shown in Figure 4. The cumulative graph includes all sub-regions and participants. Similar correlations are observed in patients and controls, however, the regression line is downshifted for the patients, reflecting the reduced susceptibilities in subcortical areas shown in Figure 2.
Discussion
Our preliminary results provide the first assessment of D1-receptor activity in patients with GTS indicating reduced BPND and R1 levels in multiple brain regions, including frontal, thalamic and striatal areas. In parallel, 7T QSM revealed reduced susceptibility in multiple subcortical and brainstem nuclei, presumably reflecting reductions in iron content. Equally importantly, the combined information from PET and MR suggests a correlation of striatal D1 availability and QSM-derived brain iron. This observation bears similarities to recent longitudinal PET/MR results in a normal cohort, demonstrating associations of dopamine receptor D2/D3 availability and vesicular dopamine storage with the reversible transverse relaxation rate, R2’—another surrogate of iron obtained with MRI17.The link between susceptibility reductions obtained with QSM and PET-derived abnormalities in dopaminergic transmission suggests that disruptions in iron regulatory mechanisms may be involved in GTS pathophysiology, and that neurotransmitter abnormalities may be related to mechanisms regulated by iron-containing enzymes. While susceptibility measures lack the unique specificity of PET to target individual aspects of dopaminergic signaling (i.e., dopamine vesicles, individual receptors, and transporters), the non-invasiveness of QSM opens new routes to indirect investigations of the dopaminergic system in GTS, including maturational effects during adolescence, where PET scanning is not an option.
Acknowledgements
This work was funded by the EU through the ITN “INSPiRE-MED” (H2020-MSCA-ITN-2018, #813120).
Thanks to Caroline Fremer, Caroline Klages and Lisa Hartung from MHH for their help in the patients recruiting, to the UKL NUK Nuclear Medicine Technologists Torsten Böhm and Martin Wehner, MPI CBS radiographers Domenica Klank, Sylvie Neubert, Anke Kummer, Simone Wipper, Mandy Jochemko, Manuela Hofmann and Nicole Pampus for their help in acquisitions and preparations of participants and to Amira-Philine Büttner for her valuable help in acquisitions and data organization.
References
1.American Psychiatric Association. Diagnostic and Statistical Manual of Mental Disorders, 4th Edition, 2000
2.D. Albin and J.W. Mink, Recent advances in Tourette syndrome research. Trends Neurosci. 2006; 29: 175-182.
3.J.W. Mink. Basal ganglia dysfunction in Tourette’s syndrome: A new hypothesis. Pediatr. Neurol. 2001; 25: 190-198.
4.H.S. Singer. Treatment of tics and Tourette syndrome. Curr. Treat. Opinions Neurol. 2010; 12: 539-561.
5.E. Jakubovski, K.R. Müller-Vahl. Gilles de la Tourette Syndrome: Symptoms, Causes and Therapy, Psychotherapie, Psychosomatik, Medizinische Psychologie. 2017
6.D.L. Gilbert et al. Ecopipam, a D1 receptor antagonist, for treatment of Tourette syndrome: A randomized, placebo-controlled cross over study. Mov. Disord. 2018; 33: 1272-1280.
7.Y. Okubo et al. Decreased prefrontal dopamine D1 receptors in schizophrenia revealed by PET. Nature, 1997; 385: 634-636.
8.H.E. Möller, L. Bossoni, J.R. Connor, et al. Iron, myelin, and the brain: Neuroimaging meets neurobiology. Trends Neurosci. 2019; 42: 384-401.
9.S. Kaller et al. “Test–retest measurements of dopamine D1-type receptors using simultaneous PET/MRI imaging. Eur. J. Nucl. Med. Mol. Imaging 2017; 44: 1025-1032. 10. M. Jenkinson, C.F. Beckmann, T.E. Behrens, et al. FSL. NeuroImage. 2012; 62: 782-790.
11.Deistung A, Schweser F, Reichenbach JR. Overview of quantitative susceptibility mapping. NMR Biomed. 2017; 30: e3569.
12.Özbay PS, Deistung A, Feng X, et al. A comprehensive numerical analysis of background phase correction with V-SHARP. NMR Biomed. 2017; 30: e3550.
13.W. Li et al. “5223 STI Suite: a Software Package for Quantitative Susceptibility Imaging.” (2013). 14.J. Acosta-Cabronero et al., In vivo quantitative susceptibility mapping (QSM) in Alzheimer's disease. PLoS One. 2013; 8: e81093.
15.Freesurfer 5.3, https://surfer.nmr.mgh.harvard.edu/, Laboratory for Computational Neuroimaging, Athinoula A. Martinos Center for Biomedical Imaging
16.C. Rorden, M. Brett. Stereotaxic display of brain lesions. Behav Neurol. 2000; 12: 191-200.
17.B. Larsen et al. Maturation of the human striatal dopamine system revealed by PET and quantitative MRI. Nat. Commun. 2020; 11: 846.
Figures