0643
Uncoupling of Anaerobic Glucose Metabolism and Oxidative Phosphorylation following Acute Electroconvulsive Shock in Mice Brain1Department of NMR Microimaging and Spectroscopy, CSIR - Center for Cellular and Molecular Biology, Hyderabd, India, 2Academy of Scientific & Innovative Research (AcSIR), Ghaziabad, India
Synopsis
Keywords: Psychiatric Disorders, Spectroscopy, Metabolism, Glutamate, GABA, 13C NMR
Electroconvulsive therapy (ECT) is an established treatment for drug-resistant depression. However, the impact of ECT on neurotransmitter pathways is not clear. The cerebral metabolic rates were measured post ECS in mice using 1H-[13C]-NMR spectroscopy in conjunction with intravenous [1,6-13C2]glucose infusion. The concentrations of lactate, alanine, GABA, and choline were increased in the prefrontal cortex post 3.5 min of ECS. The concentrations of alanine-C3 and lactate-C3 increased after 3.5 min of ECS. In contrast, glutamatergic and GABAergic neurometabolic activity was reduced 3.5 min post ECT, and restored in an hour. These data indicate the dominance of glycolysis in the post-ictal period.Introduction
Electroconvulsive therapy (ECT) is a rapid and the most effective treatment for drug-resistant depressive disorder1. Although ECT has been used for the treatment of depression for a long time, the mechanism involved in its antidepressant action is not very clear. Several mechanisms have been proposed for the therapeutic role of ECT. These include changes in neurotransmitter levels, neurotrophic factors, inflammatory factors, functional connectivity, and neuroplasticity2,3. The positron emission tomography (PET) measurements of glucose metabolism, and 1H MRS studies of neurometabolites homeostasis following ECT are not in consensus4-6. Most importantly, the impact of ECT on excitatory and inhibitory neuronal activity is not studied so far. Hence, the major aim of the study was to assess the impact of ECT on neurometabolites homeostasis and neurometabolic activity at different times post-ECT.Methods
All animal experiments were approved by the Animal Ethics Committee of CCMB, Hyderabad. Two months old C57BL6 mice were divided into two groups: A. ECS Group, and B. Sham Group. Mice were anesthetized with isoflurane (3.5%) for 1.5 min. The mice in the ECS group received a single electroconvulsive shock (frequency 100 Hz; pulse width 0.5 ms; shock duration 0.5 s; current 50 mA) via corneal electrodes, while those in the control (sham) group were anesthetized using isoflurane but no shock7. For neurometabolic analysis, mice were infused with [1,6-13C2]glucose (0.225 M) via tail vein for 2 min using a pre-programmed infusion protocol after 3.5, 15 and 60 min of the shock8. The brain metabolism was arrested by the focused beam microwave system (3KW, 1.2s) after 7 min of the infusion9. Additionally, mice were infused with sodium [2-13C]acetate after 3.5 min for 2 min, and brain metabolism was arrested after 10 min to assess the astroglial metabolic activity8. The brain metabolites were extracted from different brain regions. The concentration and 13C enrichment of metabolites were measured in 1H-[13C]-NMR spectra of brain tissue extracts acquired at 600 MHz NMR (Fig. 1)10,11. The rates of glucose and acetate oxidation were calculated based on the 13C labeled trapped into different amino acids11,12. The statistical significance of the difference of various measures was assessed from the 2-tailed student’s T-test with the correction for multiple comparisons using the Holm-Sidak method in GraphPad Prism software.Results
There was an increase in the concentrations of g-aminobutyric acid (GABA) (+32%), alanine (+73%), lactate (+125%), and choline (+21%) in the PFC in 3.5 min ECS group of mice when compared with sham (Table 1) (Fig. 1). The concentrations of lactate and choline were restored to normal levels after 15 min of ECS. However, the level of GABA (+24%) and alanine (+62%) remained higher, and returned to the control level at 60 min post-ECS (Table 1). There was an increase in the 13C labeling of AlaC3 (+30%) and LacC3 (+139%) from [1,6-13C2]glucose in 3.5 min ECS group of mice when compared with the controls (Table 2). In contrast, labeling of GluC4 (-41%), GABAC2 (-47%), GlnC4 (-50%), AspC3 (-43%), and GluC3 (-53%) was reduced significantly (p<0.0001) in ECS mice (Table 2). These changes were lower in 15 min ECS group, and normalized to the control values post 60 min ECS (Table 2). Moreover, 13C labeling of GluC4 (-38%), GABAC2 (-38%), GlnC4 (-42%), AspC3 (-37%), GluC3 (-39%), GABAC4 (-39%) from [2-13C]acetate was reduced in 3.5 min ECS group. The reduction in 13C labeling of amino acids led to a decrease in cerebral metabolic rate of glucose oxidation (CMRGlc(ox)) in glutamatergic (-44% in 3.5 min, -28% in 15 min, and -10% in 60 min of ECS group of mice) and GABAergic (-39% in 3.5 min, -28% in 15 min, -12% in 60 min ECS) (Fig. 2). Moreover, the cerebral metabolic rate of acetate oxidation (CMRAce(OX)) was reduced (-39%, ECS: 0.052±0.002; Sham: 0.085±0.006; p<0.00002) in PFC suggesting astroglial metabolic activity is decreased in 3.5 min ECS group of mice.Discussion
As per our knowledge, this is the first quantitative study to understand the impact of acute ECS on brain energy metabolism immediately after the shock. 13C NMR measurements have shown stoichiometric coupling between the rates of neurotransmitter cycling and neuronal glucose oxidation13. Hence, it was hypothesized that ECS induced seizure will lead to an increase in neuronal glucose oxidation. The results of the current study suggested an uncoupling of anaerobic glucose metabolism (+111%, 13C-lactate + 13C-alanine) and oxidative phosphorylation (-43%, decrease) at the early time period in ECS mice. The correlation analysis exhibited a strong linear relationship (R2=0.93) between GABAergic and glutamatergic neurometabolic activity (Fig. 3) (CMRGlc(GABA)) = 0.21 x (CMRGlc(Glu)), further validates the hypothesis that inhibitory and excitatory neuronal activity increased together with the brain activity. Additionally, the reduction in 13C labeling of amino acids from [2-13C[acetate in ECS mice suggested astroglial activity is reduced in ECS mice. These data provide an evidence for the functional nature of astrocytes, and the coupling between neuronal and astroglial metabolic activity.Conclusion
These results show the transient effects of electroconvulsive shock on brain metabolism. Understanding these changes will be helpful to deduce the mechanism of ECT, and can surely be helpful to minimize the immediate side effects of seizures in the future.Acknowledgements
This work was supported by the Council for Scientific and Industrial Research (CSIR), Government of India (Health Care Theme FBR/MLP0150). AS thanks the Department of Biotechnology for the award of Junior Research Fellowship (DBT/2019/CCMB/1230).References
1. Group UER (2003) Efficacy and safety of electroconvulsive therapy in depressive disorders: a systematic review and meta-analysis. Lancet 361:799-808
2. Li M, Yao X, Sun L, et al. Effects of Electroconvulsive Therapy on Depression and Its Potential Mechanism. Front Psychol. 2020;11:80. Published 2020 Feb 20.
3. Maffioletti E, Carvalho Silva R, Bortolomasi M, Baune BT, Gennarelli M, Minelli A. Molecular Biomarkers of Electroconvulsive Therapy Effects and Clinical Response: Understanding the Present to Shape the Future. Brain Sci. 2021;11(9):1120.
4. Schmidt EZ, Reininghaus B, Enzinger C, Ebner C, Hofmann P, Kapfhammer HP. Changes in brain metabolism after ECT-positron emission tomography in the assessment of changes in glucose metabolism subsequent to electroconvulsive therapy--lessons, limitations and future applications. J Affect Disord. 2008;106(1-2):203-208.
5. Erchinger VJ, Ersland L, Aukland SM, Abbott CC, Oltedal L. Magnetic Resonance Spectroscopy in Depressed Subjects Treated With Electroconvulsive Therapy-A Systematic Review of Literature. Front Psychiatry. 2021;12:608857.
6. Stippl A, Kirkgöze FN, Bajbouj M, Grimm S. Differential Effects of Electroconvulsive Therapy in the Treatment of Major Depressive Disorder. Neuropsychobiology. 2020;79(6):408-416.
7. Jonckheere J, Deloulme JC, Dall'Igna G, et al (2018) Short- and long-term efficacy of electroconvulsive stimulation in animal models of depression: The essential role of neuronal survival. Brain Stimul 11:1336-1347.
8. Soni ND, Ramesh A, Roy D, Patel AB. Brain energy metabolism in intracerebroventricularly administered streptozotocin mouse model of Alzheimer's disease: A 1H-[13C]-NMR study. J Cereb Blood Flow Metab. 2021;41(9):2344-2355.
9. Epstein AA, Narayanasamy P, Dash PK, High R, Bathena SP, Gorantla S, Poluektova LY, Alnouti Y, Gendelman HE, Boska MD (2013) Combinatorial assessments of brain tissue metabolomics and histopathology in rodent models of human immunodeficiency virus infection. J Neuroimmune Pharmacol 8:1224-1238.
10. de Graaf RA, Brown PB, Mason GF, Rothman DL, Behar KL (2003) Detection of [1,6-13C2]-glucose metabolism in rat brain by in vivo 1H-[13C]-NMR spectroscopy. Magn Reson Med 49:37-46
11. Bagga P, Chugani AN, Varadarajan KS, Patel AB (2013) In vivo NMR studies of regional cerebral energetics in MPTP model of Parkinson's disease: recovery of cerebral metabolism with acute levodopa treatment. J Neurochem 127:365-377.
12. Tiwari V, Ambadipudi S, Patel AB (2013) Glutamatergic and GABAergic TCA cycle and neurotransmitter cycling fluxes in different regions of mouse brain. J Cereb Blood Flow Metab 33:1523-1531.
13. Hyder F, Patel AB, Gjedde A, Rothman DL, Behar KL, Shulman RG. Neuronal-glial glucose oxidation and glutamatergic-GABAergic function. J Cereb Blood Flow Metab. 2006;26(7):865-877.
Figures
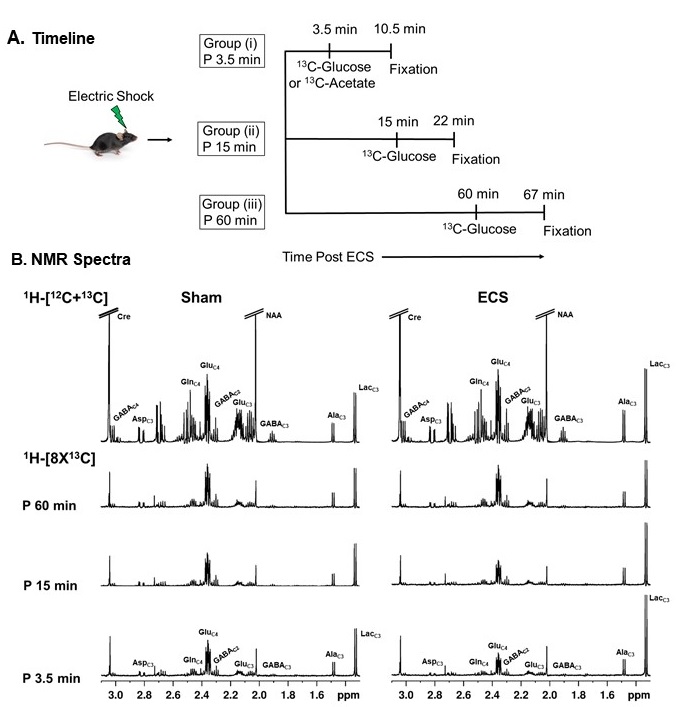
Fig 1. A. Schematic representation of the timeline of different treatments in mice. Group (i), Group (ii) and Group (iii) mice were infused with [1,6-13C2]glucose for 2 min after 3.5, 15 and 60 min of ECS, respectively. Brain Metabolism was arrested 7 min post infusion by focused beam microwave irradiation. B. Representative 1H-[13C]-NMR spectra from PFC brain tissue extract. The spectrum in the upper panel shows the total concentration of neurometabolites, whereas the spectra in the lower panel depict 13C labeled neurometabolites in 3.5, 15 and 60 min groups of ECS mice.
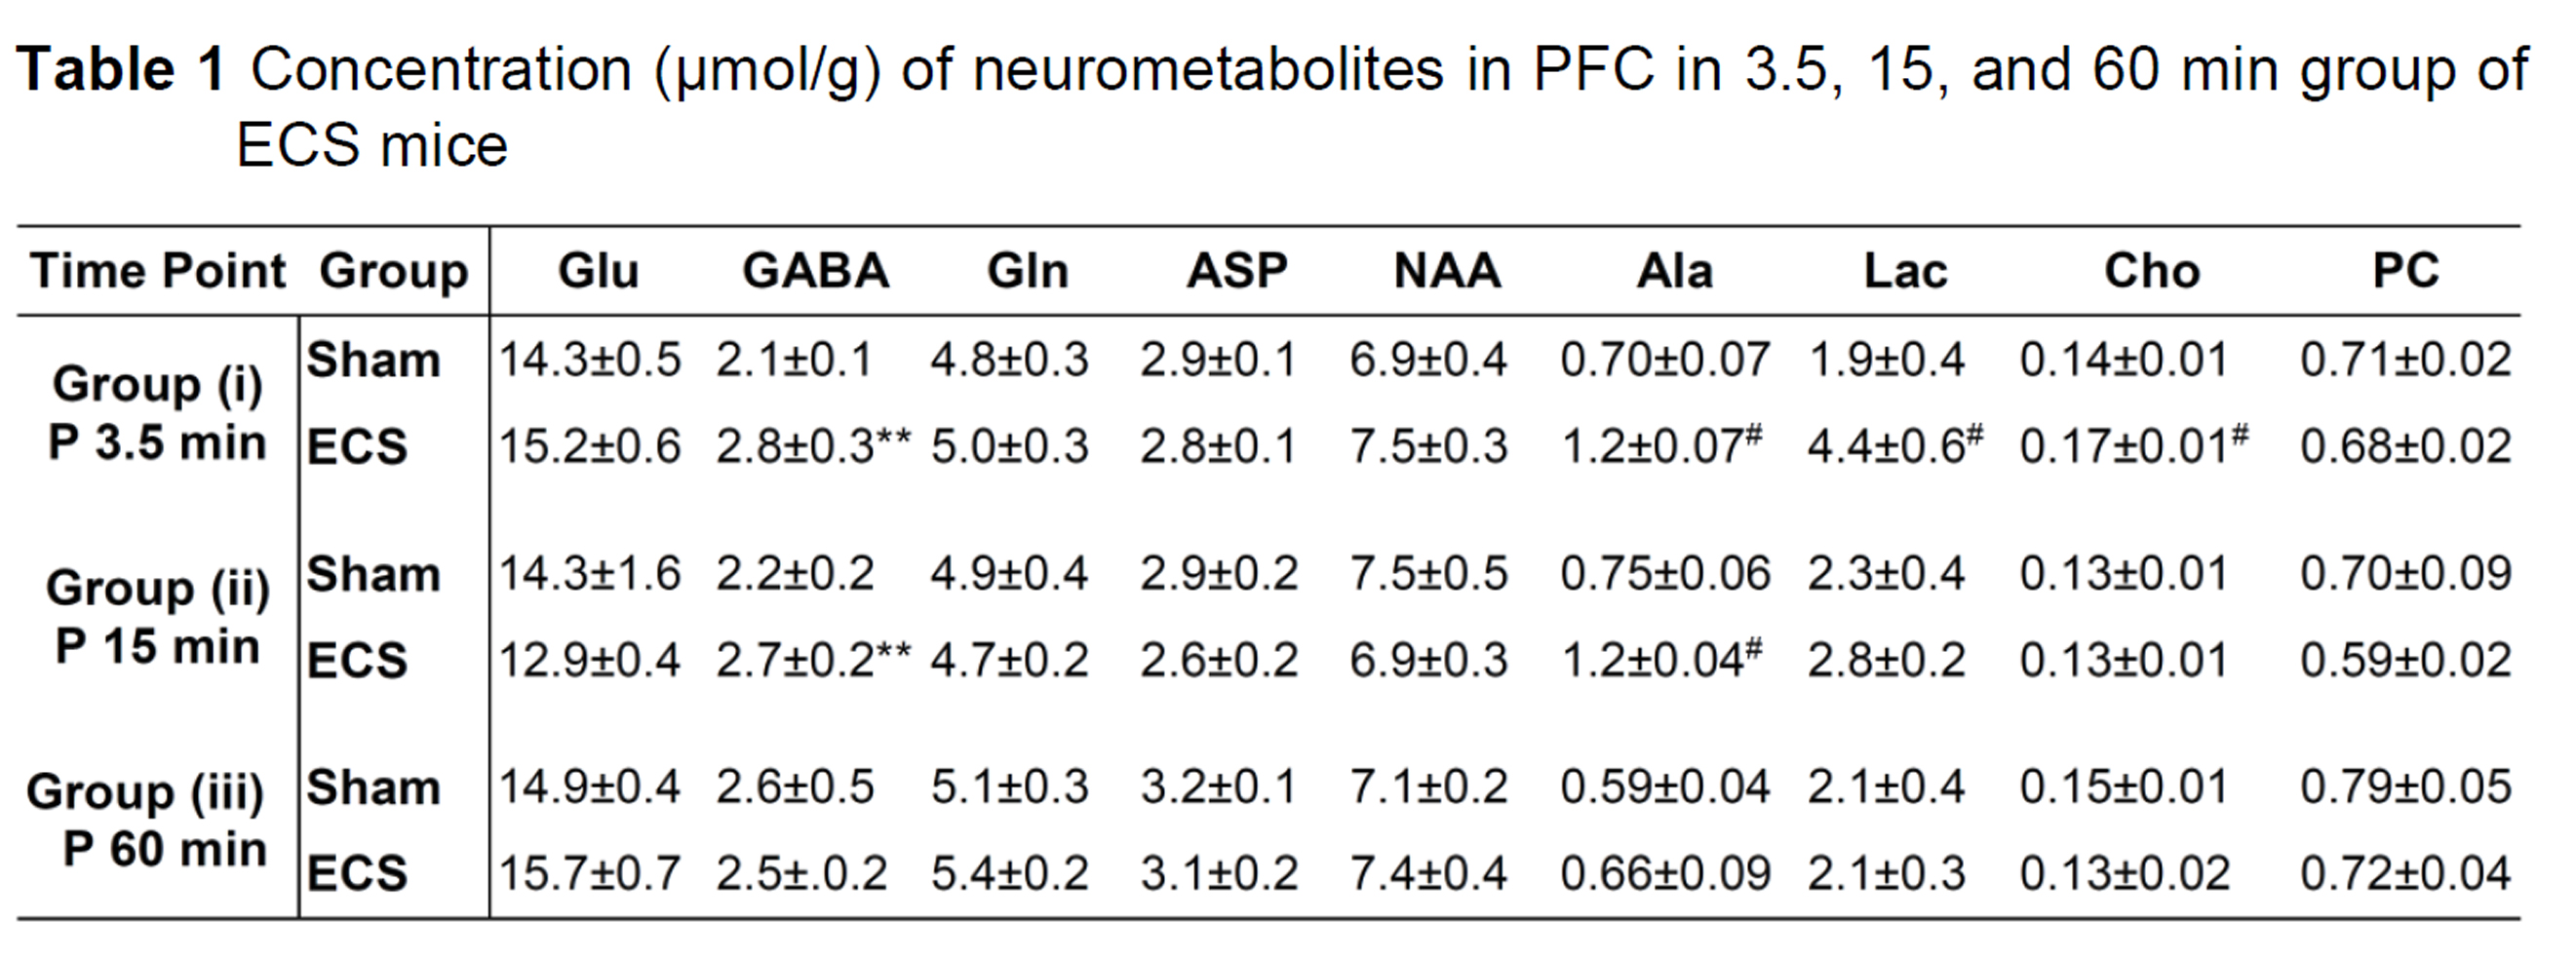
The concentrations of metabolites were measured in the PFC tissue extracts from 1H-[12C+13C]-NMR spectrum using [2-13C]glycine as reference. Values are presented as mean±SD. **p<0.005 and #p<0.0001 when ECS treated mice were compared with sham mice. Abbreviations: Ala: alanine; Asp: aspartate; Cho: Choline; PC: phosphocholine; GABA: g-aminobutyric acid; Glu: glutamate; Gln: glutamine; NAA: N-acetyl aspartate; Lac: lactate.
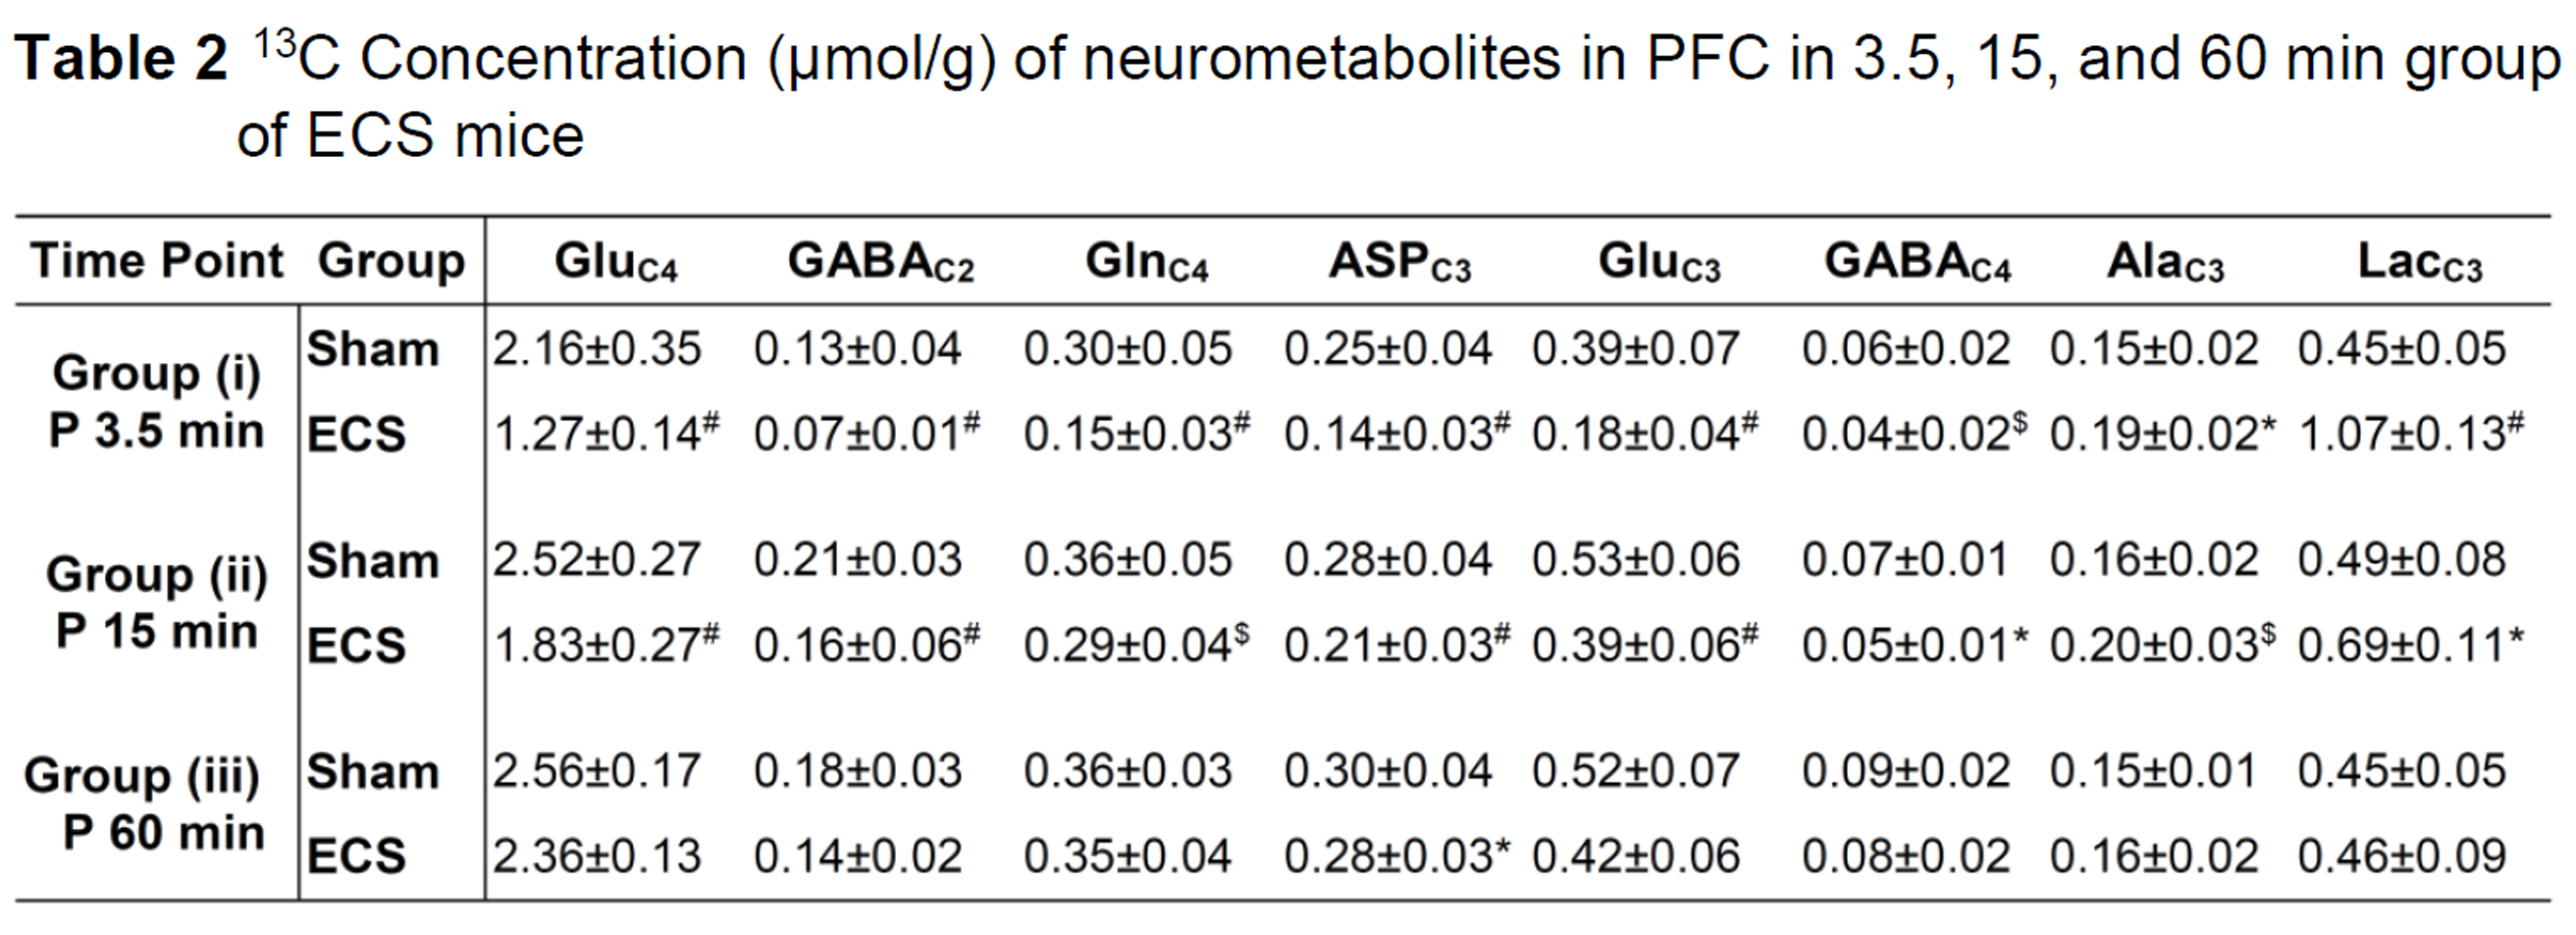
The 13C concentrations of neurometabolites were measured in the PFC tissue extracts from edited 1H-[13C]-NMR spectrum using [2-13C]glycine as reference. Values are presented as mean±SD. *p<0.05, $p<0.005 and #p<0.0001 when ECS treated mice were compared with sham. Abbreviations: AlaC3: alanine-C3; AspC3: aspartate-C3; GABAC2: g-aminobutyric acid-C2; GABAC4: g-aminobutyric acid-C4 GluC4: glutamate-C4; GluC3: glutamate-C3; GlnC4: glutamine-C4; LacC3: lactate-C3
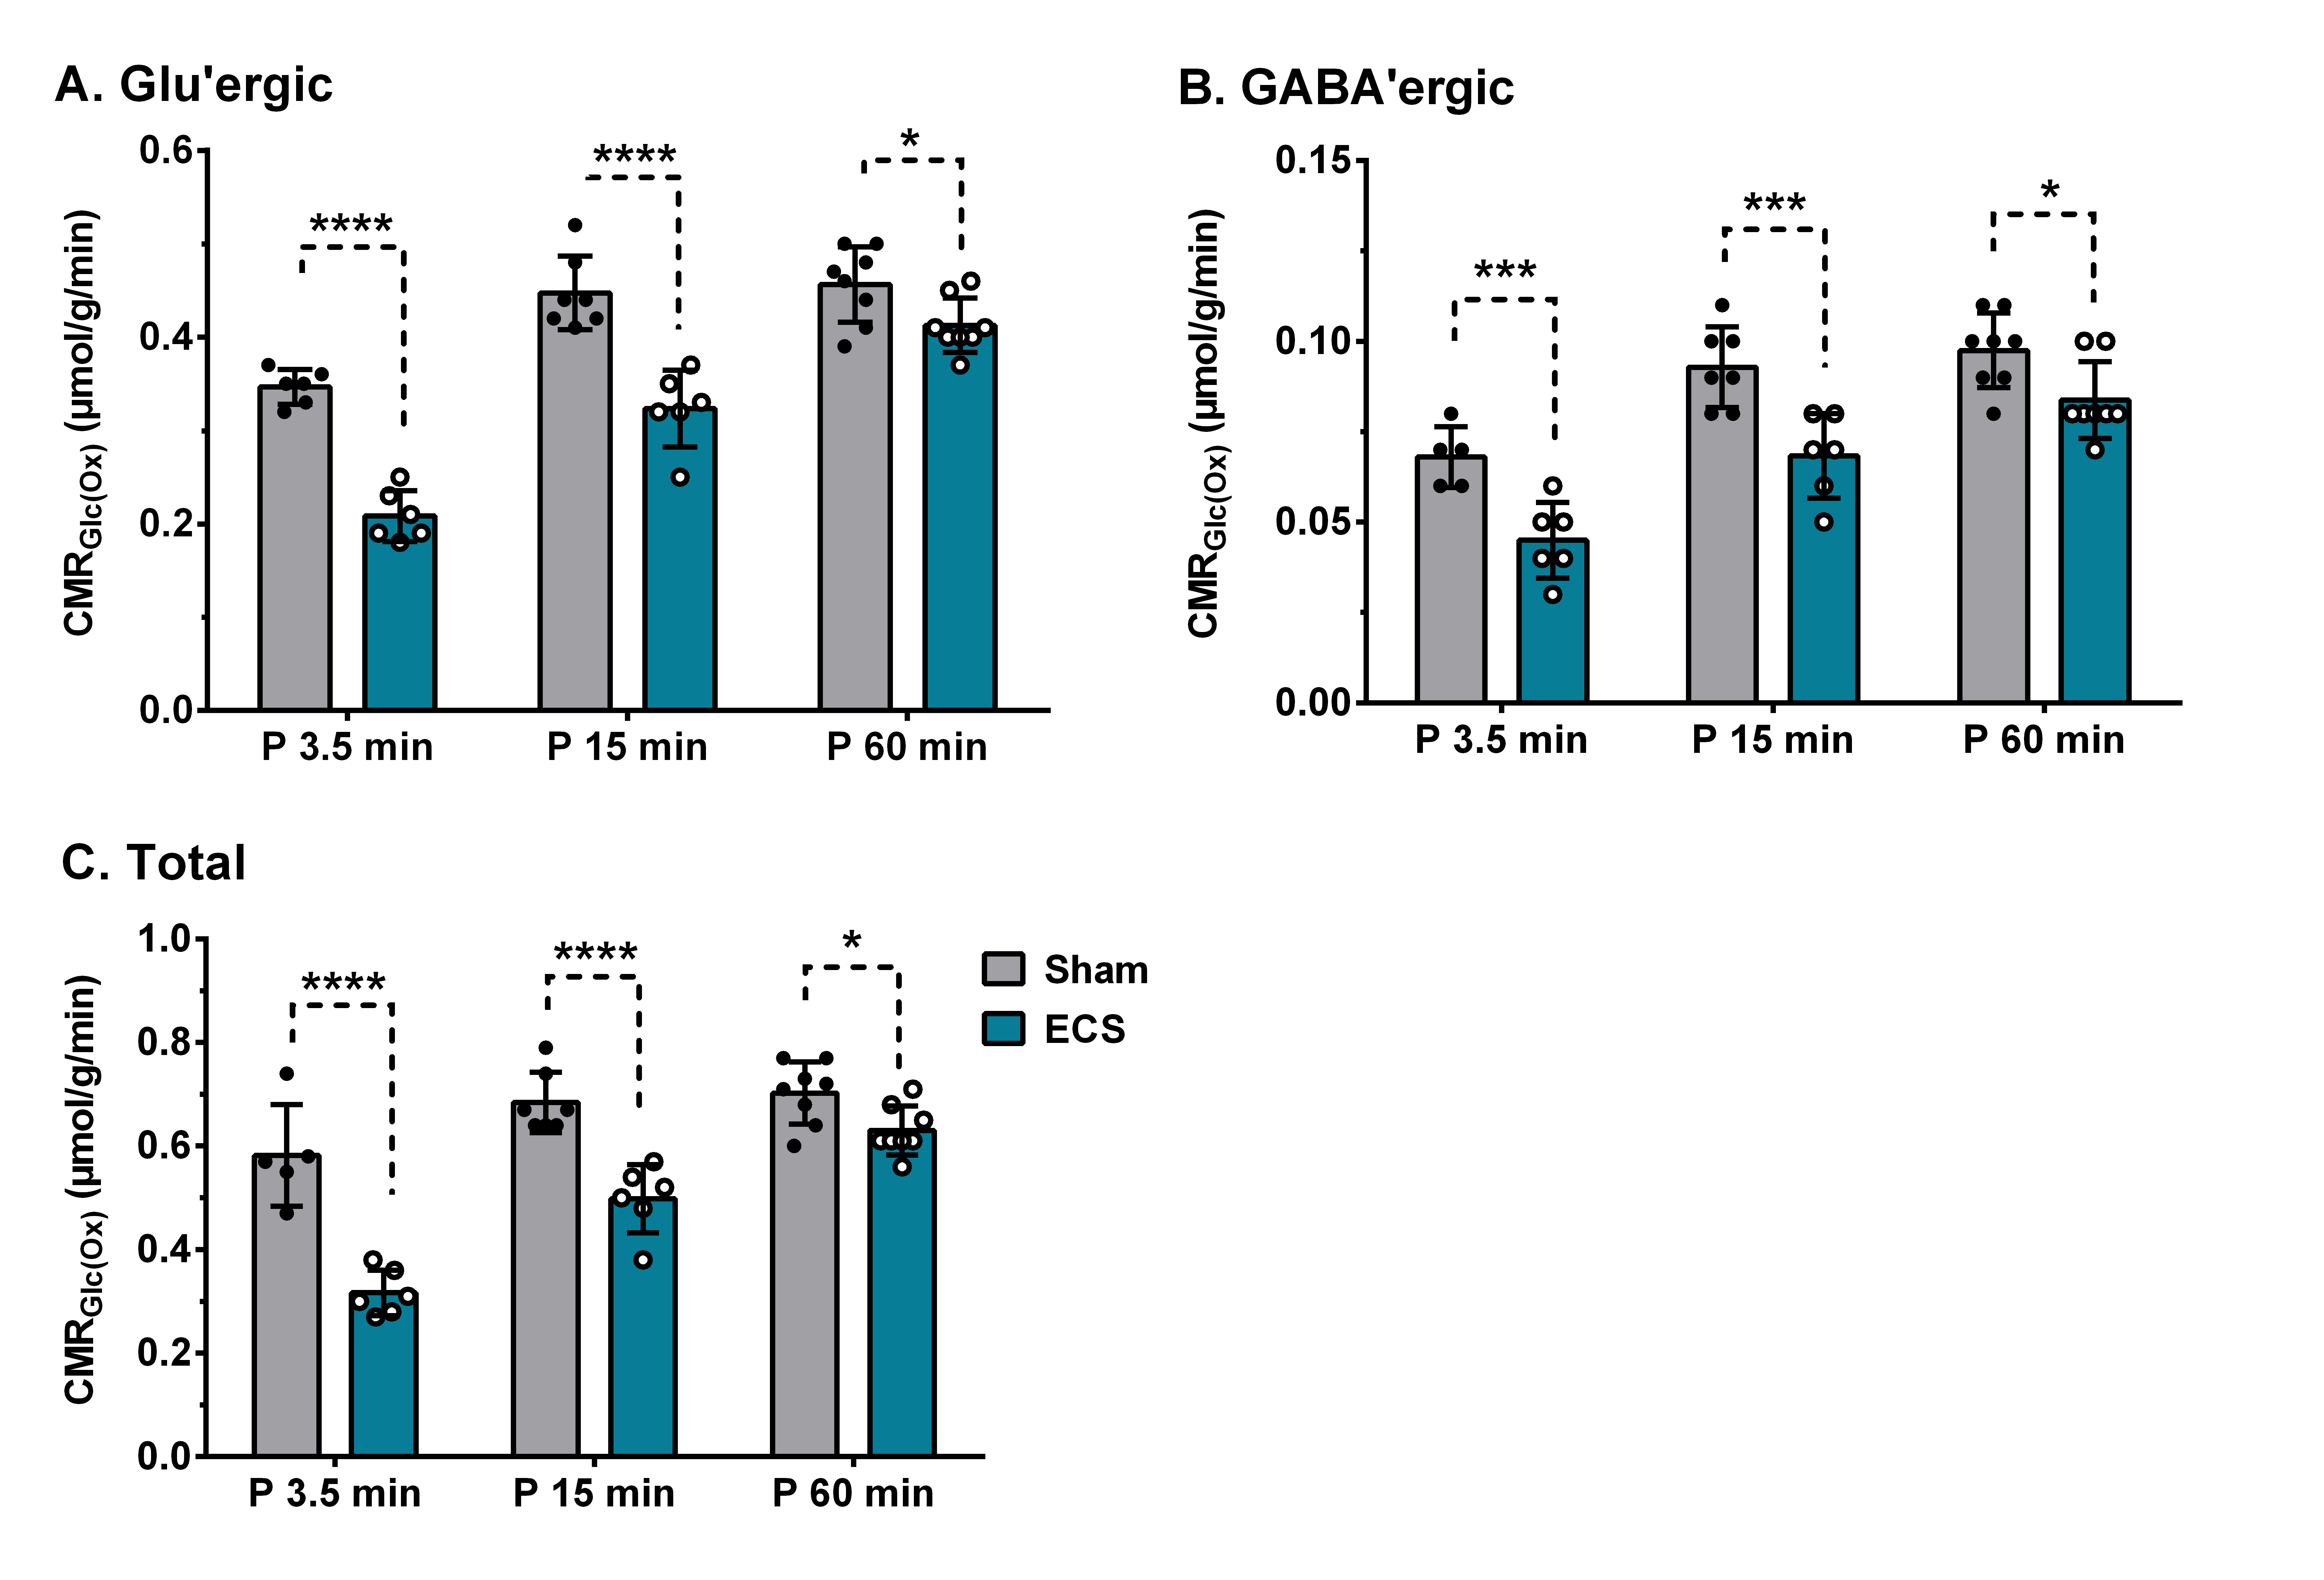
Fig. 2 The cerebral metabolic rate of glucose oxidation in PFC of 3.5, 15 and 60 min ECS group of mice. The cerebral metabolic rates were estimated based on the 13C labeled trapped into amino acids. The vertical bar represents the mean±SD of the group, while the symbols depict individual values. *p<0.05, **p<0.005, ***p<0.0005 and ****p<0.0001 when ECS treated mice were compared with controls.
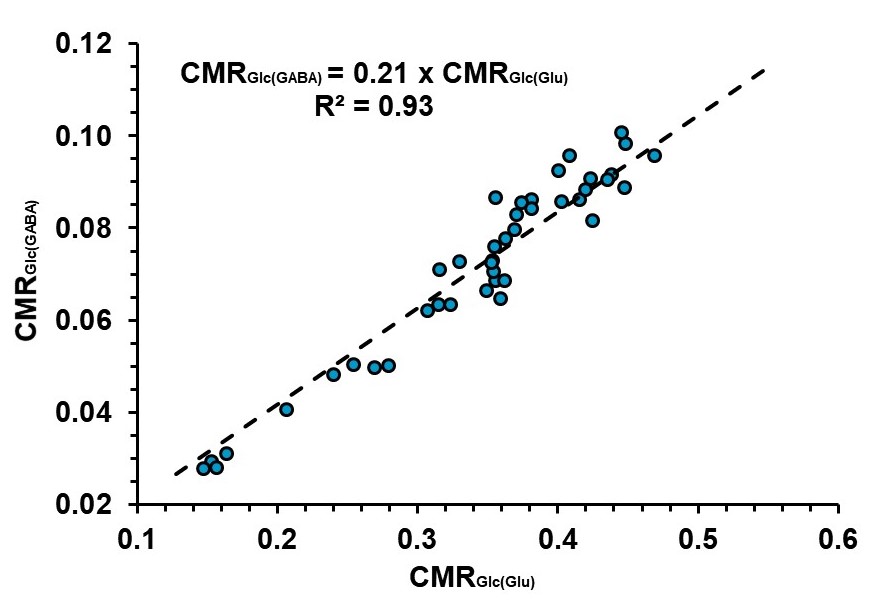
Fig. 3. Correlation between rates of glucose oxidation in GABAergic (CMRGlc(GABA)) and glutamatergic (CMRGlc(Glu)) neurons. The cerebral metabolic rates were estimated based on the 13C labeled trapped into different amino acids.