0641
Multivariate association between brain functional networks and symptoms and psychosocial environment in adolescent depression1Huaxi MR Research Center (HMRRC), Functional and Molecular Imaging Key Laboratory of Sichuan Province, Department of Radiology, West China Hospital of Sichuan University, Chengdu, China, 2Department of Radiology, Sichuan Mental Health Center, the Third Hospital of Mianyang, Mianyang, China, 3Department of Psychiatry, Sichuan Mental Health Center, the Third Hospital of Mianyang, Mianyang, China, 4Psychoradiology Research Unit of the Chinese Academy of Medical Science , West China Hospital of Sichuan University, Chengdu, China
Synopsis
Keywords: Psychiatric Disorders, fMRI (resting state), Depression
The current study investigated the multivariate correlations between resting-state functional network connectivity and symptoms and environmental measures in adolescents with major depressive disorder (MDD) using the sparse canonical correlation analysis. We identified one stable association mode which showed primary correlation of environmental stressors, especially the interpersonal stress, with functional connectivity of networks that support salience processing, reward and sensory processing. Based on this brain-behavior association, we were able to categorize adolescents with MDD into two subgroups and delineate how psychosocial factors contributed to the neurobiological mechanism underlying adolescent depression.Introduction
Adolescents with major depressive disorder (MDD) gives an increased disease burden especially after COVID-19 pandemic in the past years. Understand its clinical heterogeneity in terms of brain functional networks would help to reveal the underlying neurobiological mechanisms[1] and finally lead to better treatment strategy.Therefore, we used the sparse canonical correlation analysis (sCCA)[2] with the aim to investigate the multivariate relationships between the behavioral and environmental variables characterizing heterogenous clinical features and the functional network connectivity in medication-naïve adolescents with MDD. We then conducted a k-means clustering analysis based on the associations between clinical profiles and functional network features to identify potential subtypes of adolescents with MDD.
Methods
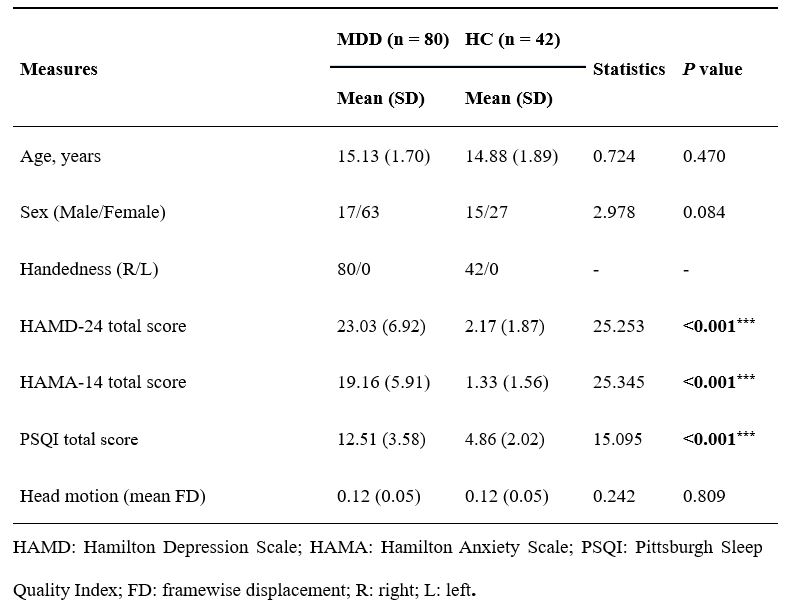
Participants and MRI Data AcquisitionWe recruited 80 adolescents with MDD and 42 healthy controls (HC) aged from 12 to 18 years old from Mental Health Center of Sichuan Province in China. All participants were scanned using a 3.0T MRI system with a twenty-channel phased-array head coil. The MR data consisted of resting-state EPI images and T1-weighted anatomical images.
Clinical assessment
We used six clinical scales to evaluate the clinical symptoms, cognition, family environment and stressful life events of adolescents: the Hamilton Depression/Anxiety scales, the Pittsburgh Sleep Quality Index, the Wisconsin Card Sorting Test, the Adolescents Self-Rating Life Events Checklist and the Family Environment Scale. In total, 38 factors from these scales were selected as the clinical variables in the analysis.
Within- and between-network functional connectivity
Preprocessing of MRI data was performed using fMRIPrep[3]. We used the Power atlas[4] with 227 spherical ROIs that assigned to 10 large-scale functional networks to construct connectivity matrices. We then estimated the within- and between-network connectivity based on the connectivity matrix, resulting in 55 functional network connectivity features for each participant.
Sparse CCA analysis
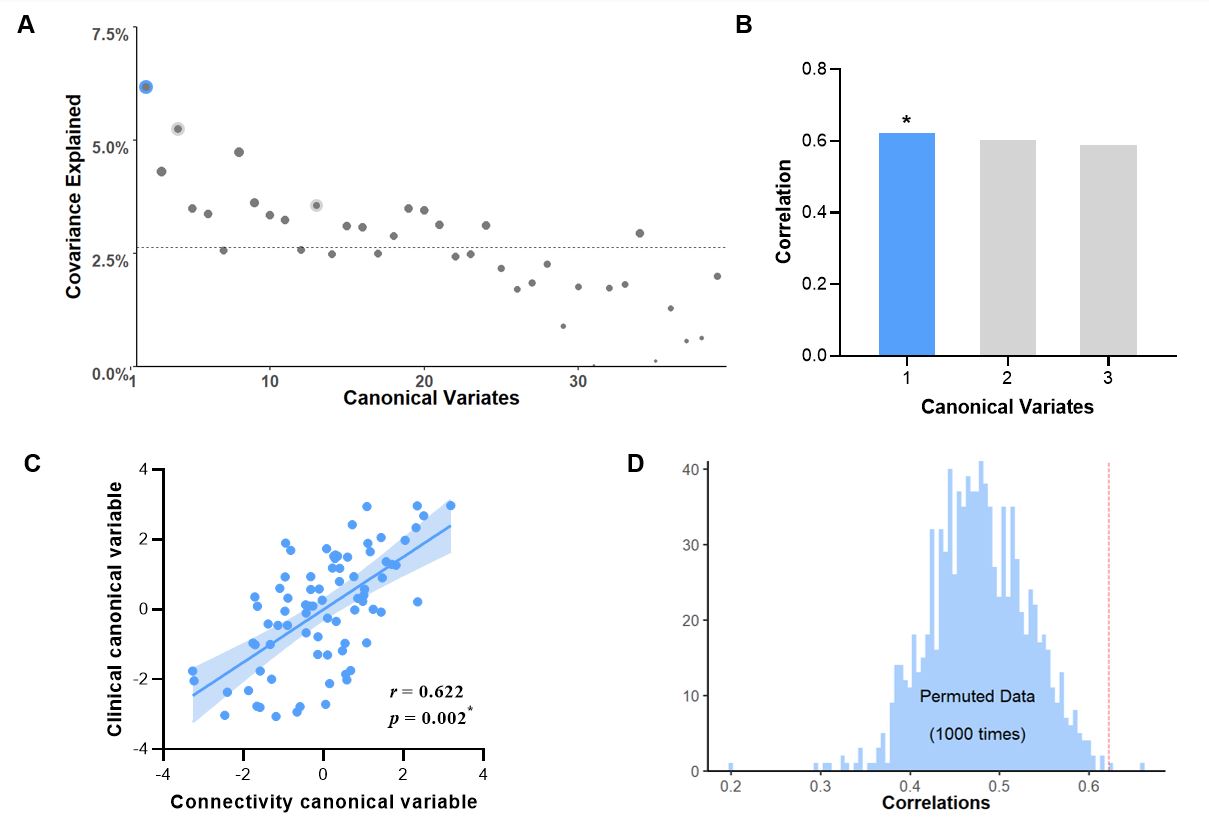
The sCCA sought a set of modes (i.e. canonical variates) that maximize correlations between linear combination of variables in clinical and connectivity sets. We used an elastic net regularization which combines the LASSO and ridge penalties to achieve the sparsity of CCA. Permutation testing (n=1000) was used to determine the statistical significance of each sCCA mode, and the p values were corrected by FDR correction. Subsequently, we calculated the clinical and connectivity loadings to quantify the contribution of each variable to each mode. The bootstrapping with 1000 replacements resamples was used to estimate the stability of the findings.
K-means clustering analysis
We performed the k-means clustering using the first pair of canonical variates derived from sCCA as input features. The optimal cluster number and the validity of the cluster solution were determined using the ‘Nbclust’ in R. Clustering stability was examined using the Jaccard coefficient with bootstrapping (n = 1000).
Results
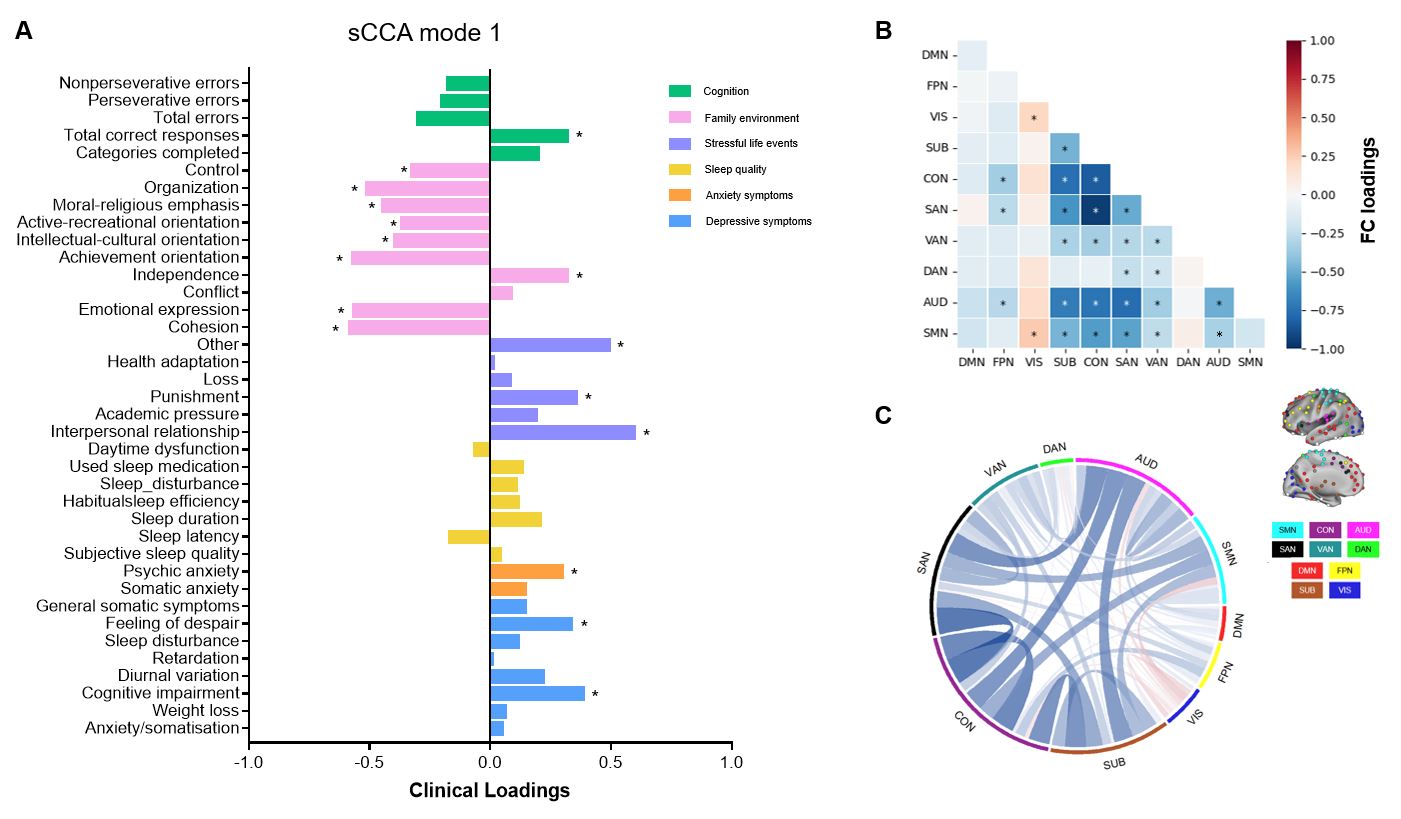
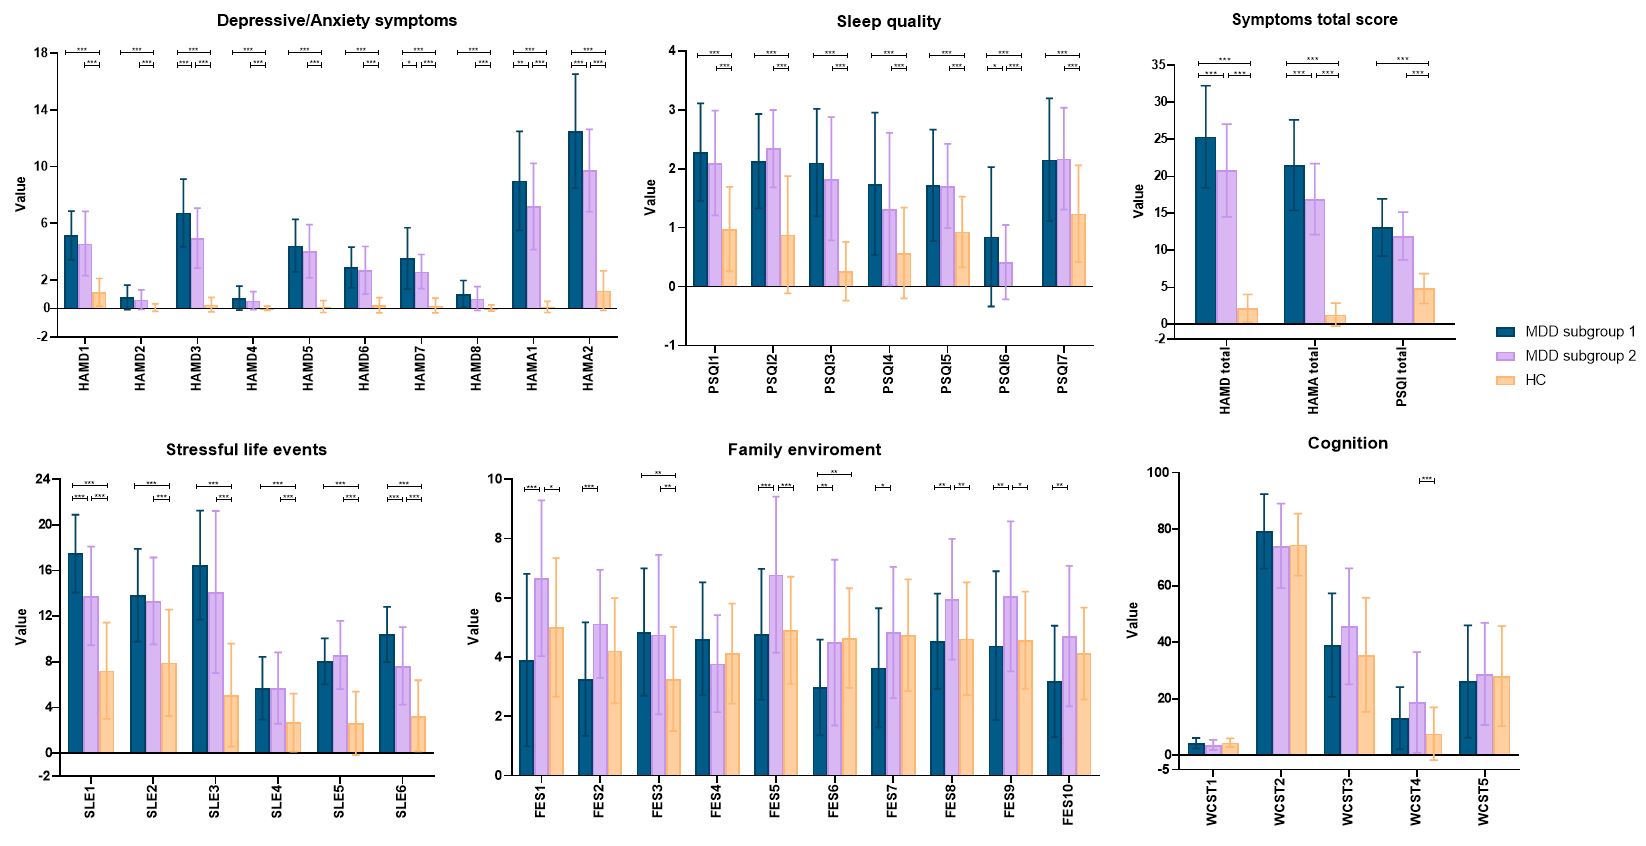
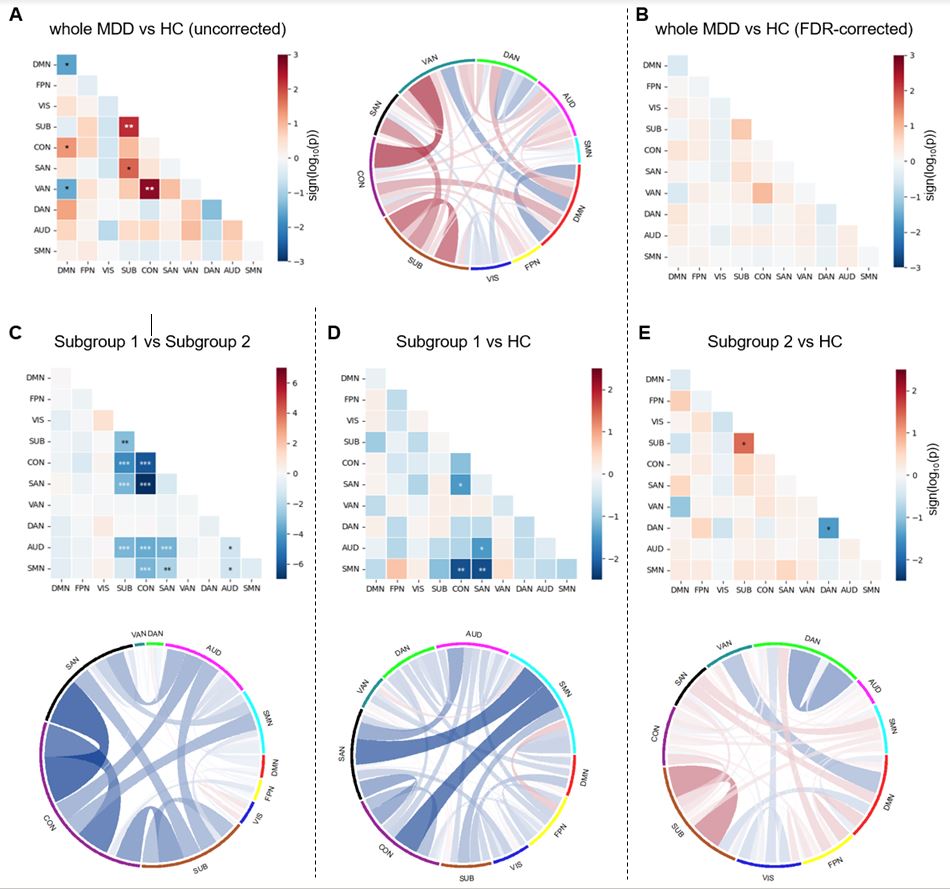
Using the sCCA, we identified one statistically significant and stable association mode (canonical correlation r = 0.622, Ppermutation = 0.002, PFDR = 0.048) which explained the largest amount of covariance (Figure 1). The interpersonal relationship stress was the most positive (loading = 0.60) contributors whereas the family cohesion was the most negative (loading = -0.59) contributors to the first clinical canonical variate (Figure 2A). And the first connectivity canonical variate was negatively correlated with within-and between-network connectivity of the the cingulo-opercular, salience, attention, subcortical and sensory networks (Figure 2B and C).The clustering analysis identified two adolescent MDD subgroups (subgroup 1: n = 39, subgroup 2: n = 41). These two subgroups showed different environment characteristics, symptom severity (Figure 3) and functional connectivity patterns (Figure 4) but no significant differences in age and sex.
Discussion & Conclusion
The primary strength of the current study is that we identified contribution of environmental stressors, especially the interpersonal relationship in the neuropathology of adolescent MDD by quantifying the relationships between brain functional networks and a variety of behavioral and environmental measures in an integrated analysis framework. The identified multivariate correlation mode with brain networks expand prior researches of adolescent depression.The second innovative point of this study is that we used the brain-behavior-environment association identified by the sCCA to categorize adolescents with MDD into two subgroups. The subgroup 1 had more interpersonal relationship stress and anxiety and depressive symptoms, while the subgroup 2 demonstrated more positive family environment and relatively less severe symptoms. This suggested that interpersonal stress serves as a risk factor whereas healthy family environment play a protective role in the development of adolescent depression[5].
Taken together, our study linked interpersonal stressors with specific brain functional network abnormalities in MDD youths and provide potential translational value of resting-state fMRI network analysis with multivariate brain-behavior mapping approach.
Acknowledgements
This study is supported by grants from Natural Science Foundation of Sichuan Province (2022NSFSC0052) and Clinical and Translational Research Fund of Chinese Academy of Medical Sciences (2021-I2M-C&T-B-097).References
[1] Kaczkurkin AN, Moore TM, Sotiras A, Xia CH, Shinohara RT, Satterthwaite TD. Approaches to Defining Common and Dissociable Neurobiological Deficits Associated With Psychopathology in Youth. Biol Psychiatry. 2020 Jul 1;88(1):51-62.
[2] Xia CH, Ma Z, Ciric R, Gu S, Betzel RF, Kaczkurkin AN, Calkins ME, Cook PA, García de la Garza A, Vandekar SN, Cui Z, Moore TM, Roalf DR, Ruparel K, Wolf DH, Davatzikos C, Gur RC, Gur RE, Shinohara RT, Bassett DS, Satterthwaite TD. Linked dimensions of psychopathology and connectivity in functional brain networks. Nat Commun. 2018 Aug 1;9(1):3003.
[3] Esteban O, Markiewicz CJ, Blair RW, Moodie CA, Isik AI, Erramuzpe A, Kent JD, Goncalves M, DuPre E, Snyder M, Oya H, Ghosh SS, Wright J, Durnez J, Poldrack RA, Gorgolewski KJ. fMRIPrep: a robust preprocessing pipeline for functional MRI. Nat Methods. 2019 Jan;16(1):111-116.
[4] Power JD, Cohen AL, Nelson SM, Wig GS, Barnes KA, Church JA, Vogel AC, Laumann TO, Miezin FM, Schlaggar BL, Petersen SE. Functional network organization of the human brain. Neuron. 2011 Nov 17;72(4):665-78.
[5] Alison L. Shortt and Susan H. Spence (2006). Risk and Protective Factors for Depression in Youth. Behaviour Change, 23, pp 1-30 doi:10.1375/bech.23.1.1.
Figures