0640
Astrocyte dysfunction drives abnormal resting-state functional connectivity in depression1School of Biomedical Engineering, Southern Medical University, Guangzhou, China, Guangzhou, China, 2Key Laboratory of Mental Health of the Ministry of Education, Guangdong-Hong Kong-Macao Greater Bay Area Center for Brain Science and Brain-Inspired Intelligence, Guangdong Province Key Laboratory of Psychiatric Disorders, Department of Neurobiology, School of Basic Medical Sciences, Southern Medical University, Guangzhou 510515, China, Guangzhou, China, 3Laboratory of Biomedical Imaging and Signal Processing, The University of Hong Kong, Pokfulam, Hong Kong SAR, China, Hong Kong, China, 4Department of Electrical and Electronic Engineering, The University of Hong Kong, Pokfulam, Hong Kong SAR, China, Hong Kong, China, 5Guangdong Provincial Key Laboratory of Medical Image Processing, Southern Medical University, Guangzhou, China, Guangzhou, China, 6Guangdong Province Engineering Laboratory for Medical Imaging and Diagnostic Technology, Southern Medical University, Guangzhou, China, Guangzhou, China, 7Microbiome Medicine Center, Department of Laboratory Medicine, Zhujiang Hospital, Southern Medical University, Guangzhou, Guangdong 510515, China, Guangzhou, China
Synopsis
Keywords: Brain Connectivity, fMRI
Even though brain-wide network-level abnormalities in major depressive disorder (MDD) patients via resting-state functional MRI (rsfMRI) exist, the mechanisms underlying such network changes are unknown. Here, we show that the astrocytic calcium deficient mice, inositol 1,4,5-trisphosphate-type-2 receptor knockout mice (Itpr2-/- mice), display abnormal rsfMRI connectivity (rsFC), which is highly consistent with those of MDD patients. Optogenetic activation of medial prefrontal cortex (mPFC) astrocytes partially rescues rsFC. Optogenetic activation of the mPFC neurons or mPFC-striatum pathway rescues disrupted rsFC and depressive-like behaviors in Itpr2-/- mice. Our results identify the previously unknown role of astrocyte dysfunction in driving rsFC abnormalities in depression.Introduction
The high lifetime prevalence (~17%) and the leading cause of disability and suicide make major depressive disorder (MDD) a devastating psychiatric disease1. Mounting evidence has established that MDD patients display abnormal resting-state functional connectivity (rsFC) in key functional hubs involved in emotional processing2-4. Despite the immense potential of rsfMRI for diagnosing depression and guiding depression treatment, the mechanisms underlying rsfMRI connectivity abnormalities in depression remain poorly understood.Astrocytes, the most abundant glial cell type in the mammalian brain, are strongly implicated in depression5-9. However, the role of astrocytes in rsfMRI connectivity remains understudied for both normal and depressed brains. To elucidate whether astrocyte dysfunction drives abnormal rsfMRI connectivity in depression, we examined the effects of astrocyte-specific functional loss and gain on brain-wide rsFC, as well as the association between abnormal rsFC and depressive-like behaviors in Itpr2-/- mice.
Methods
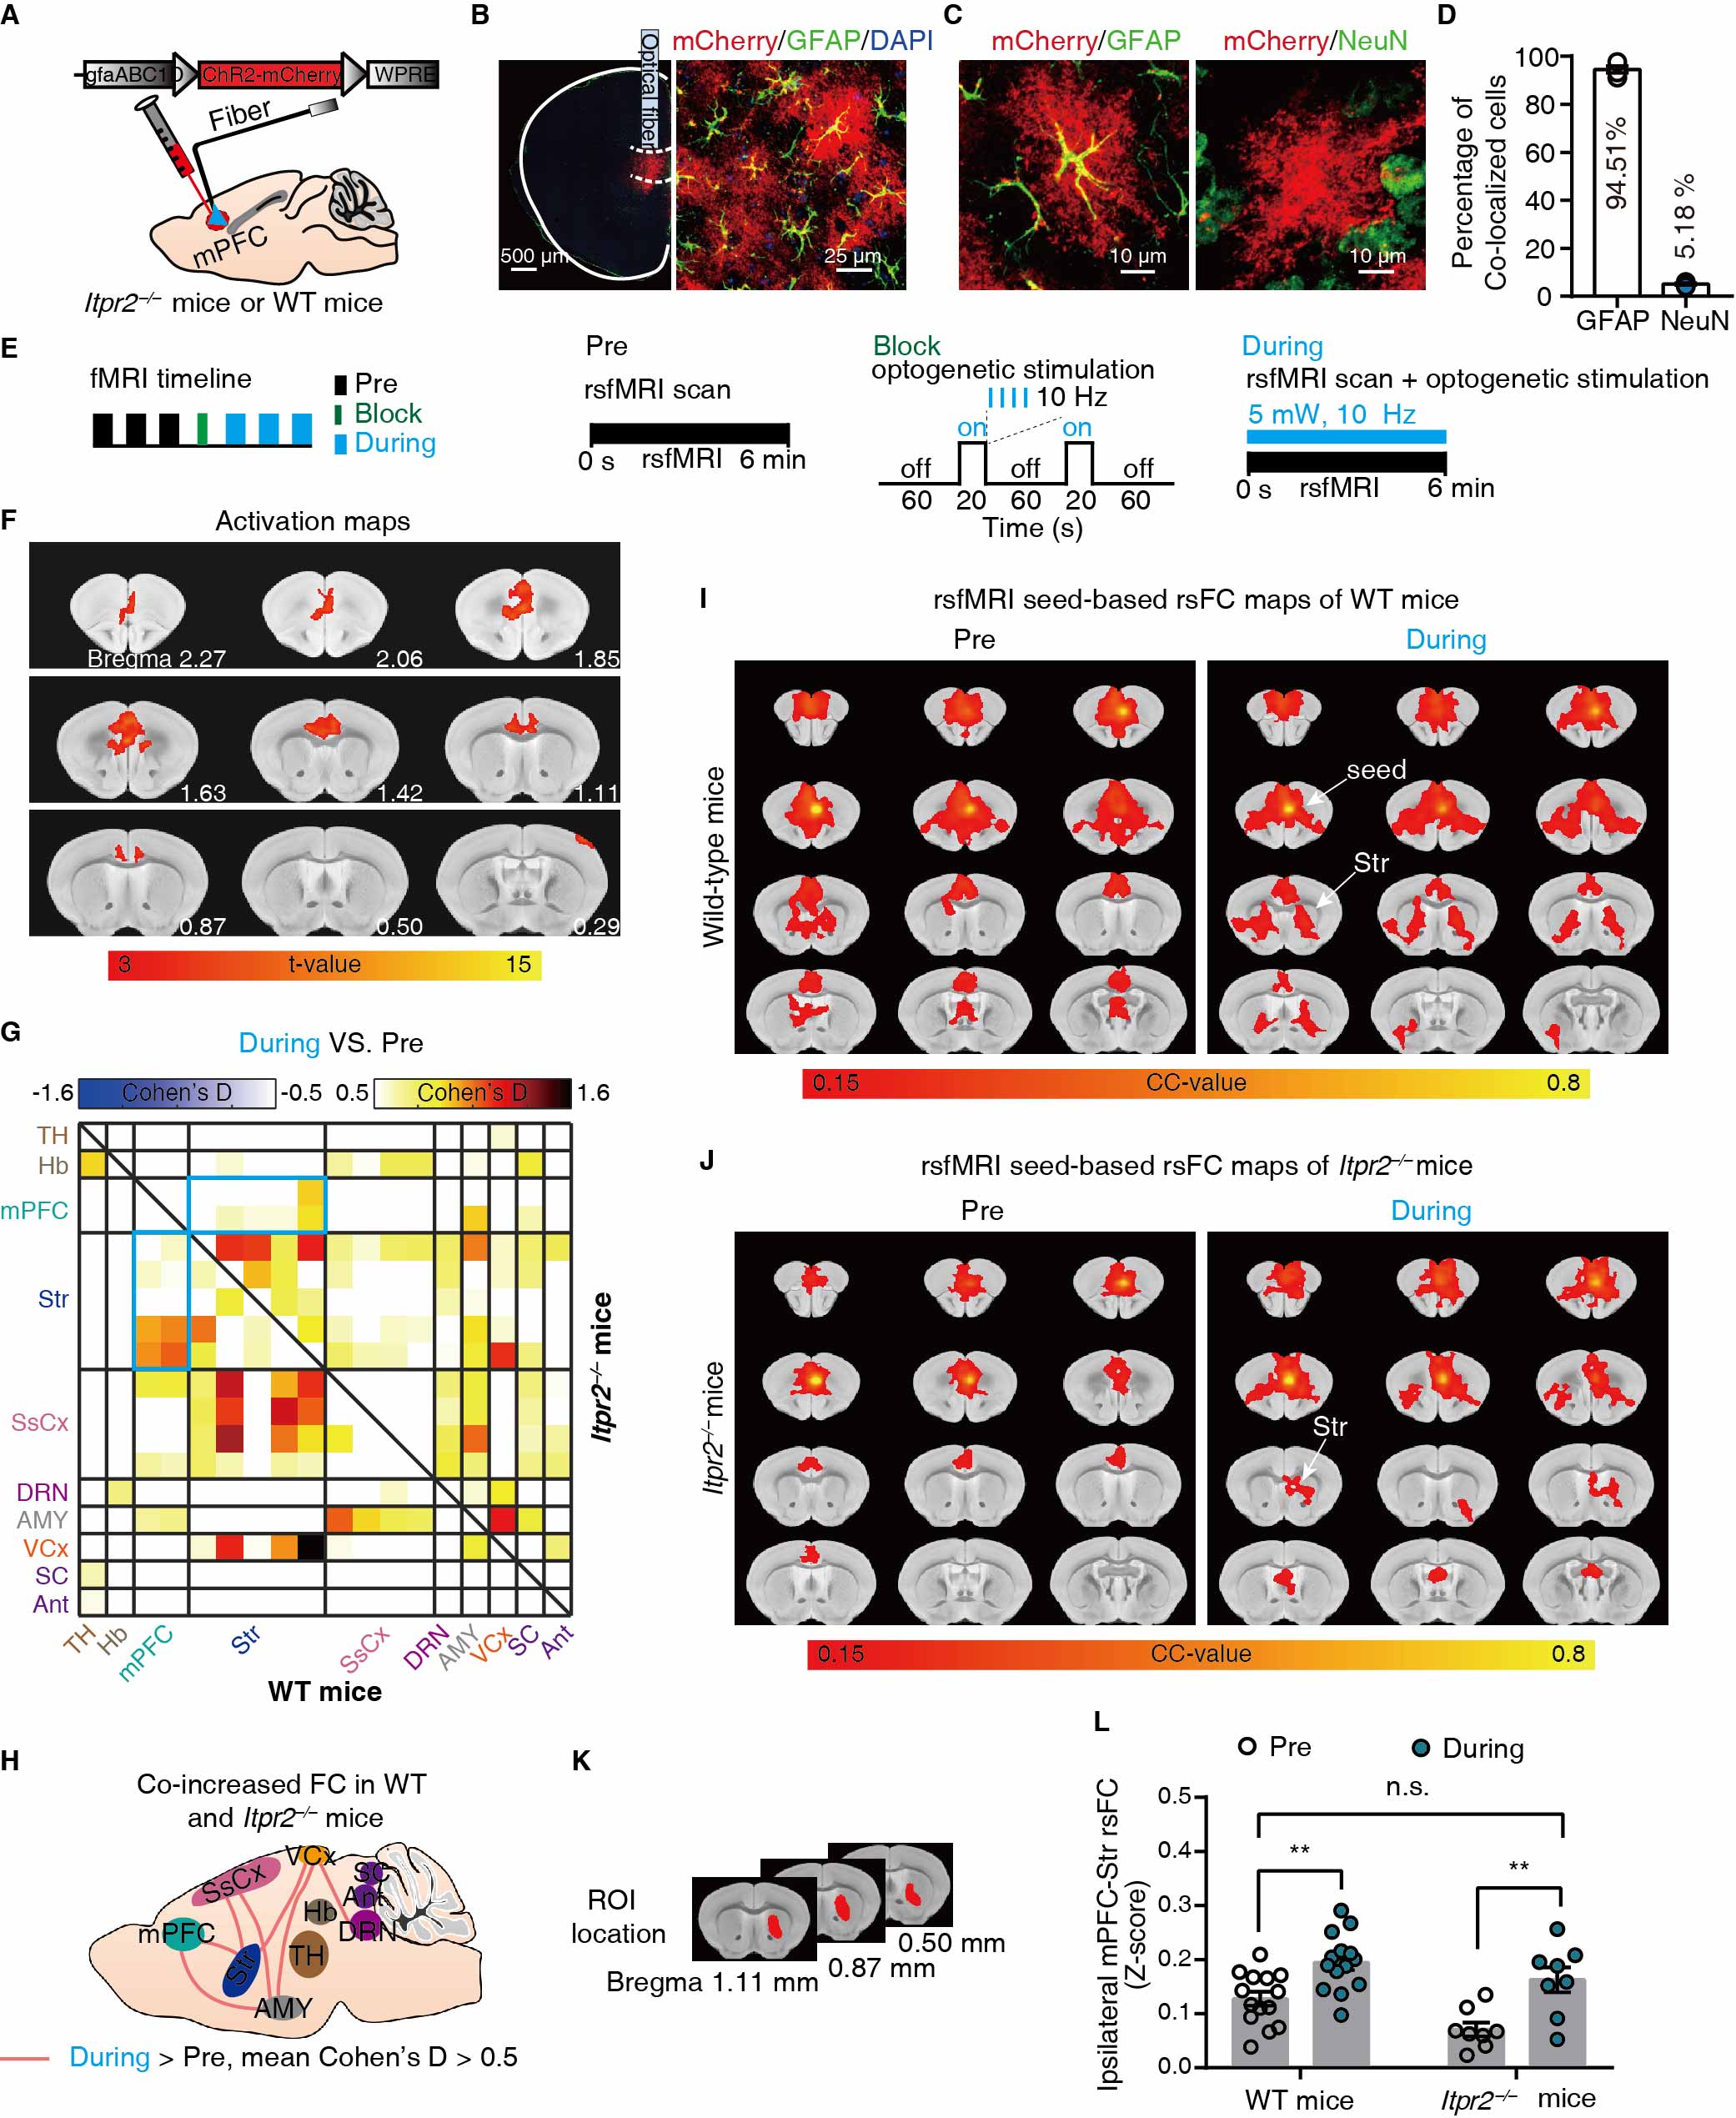
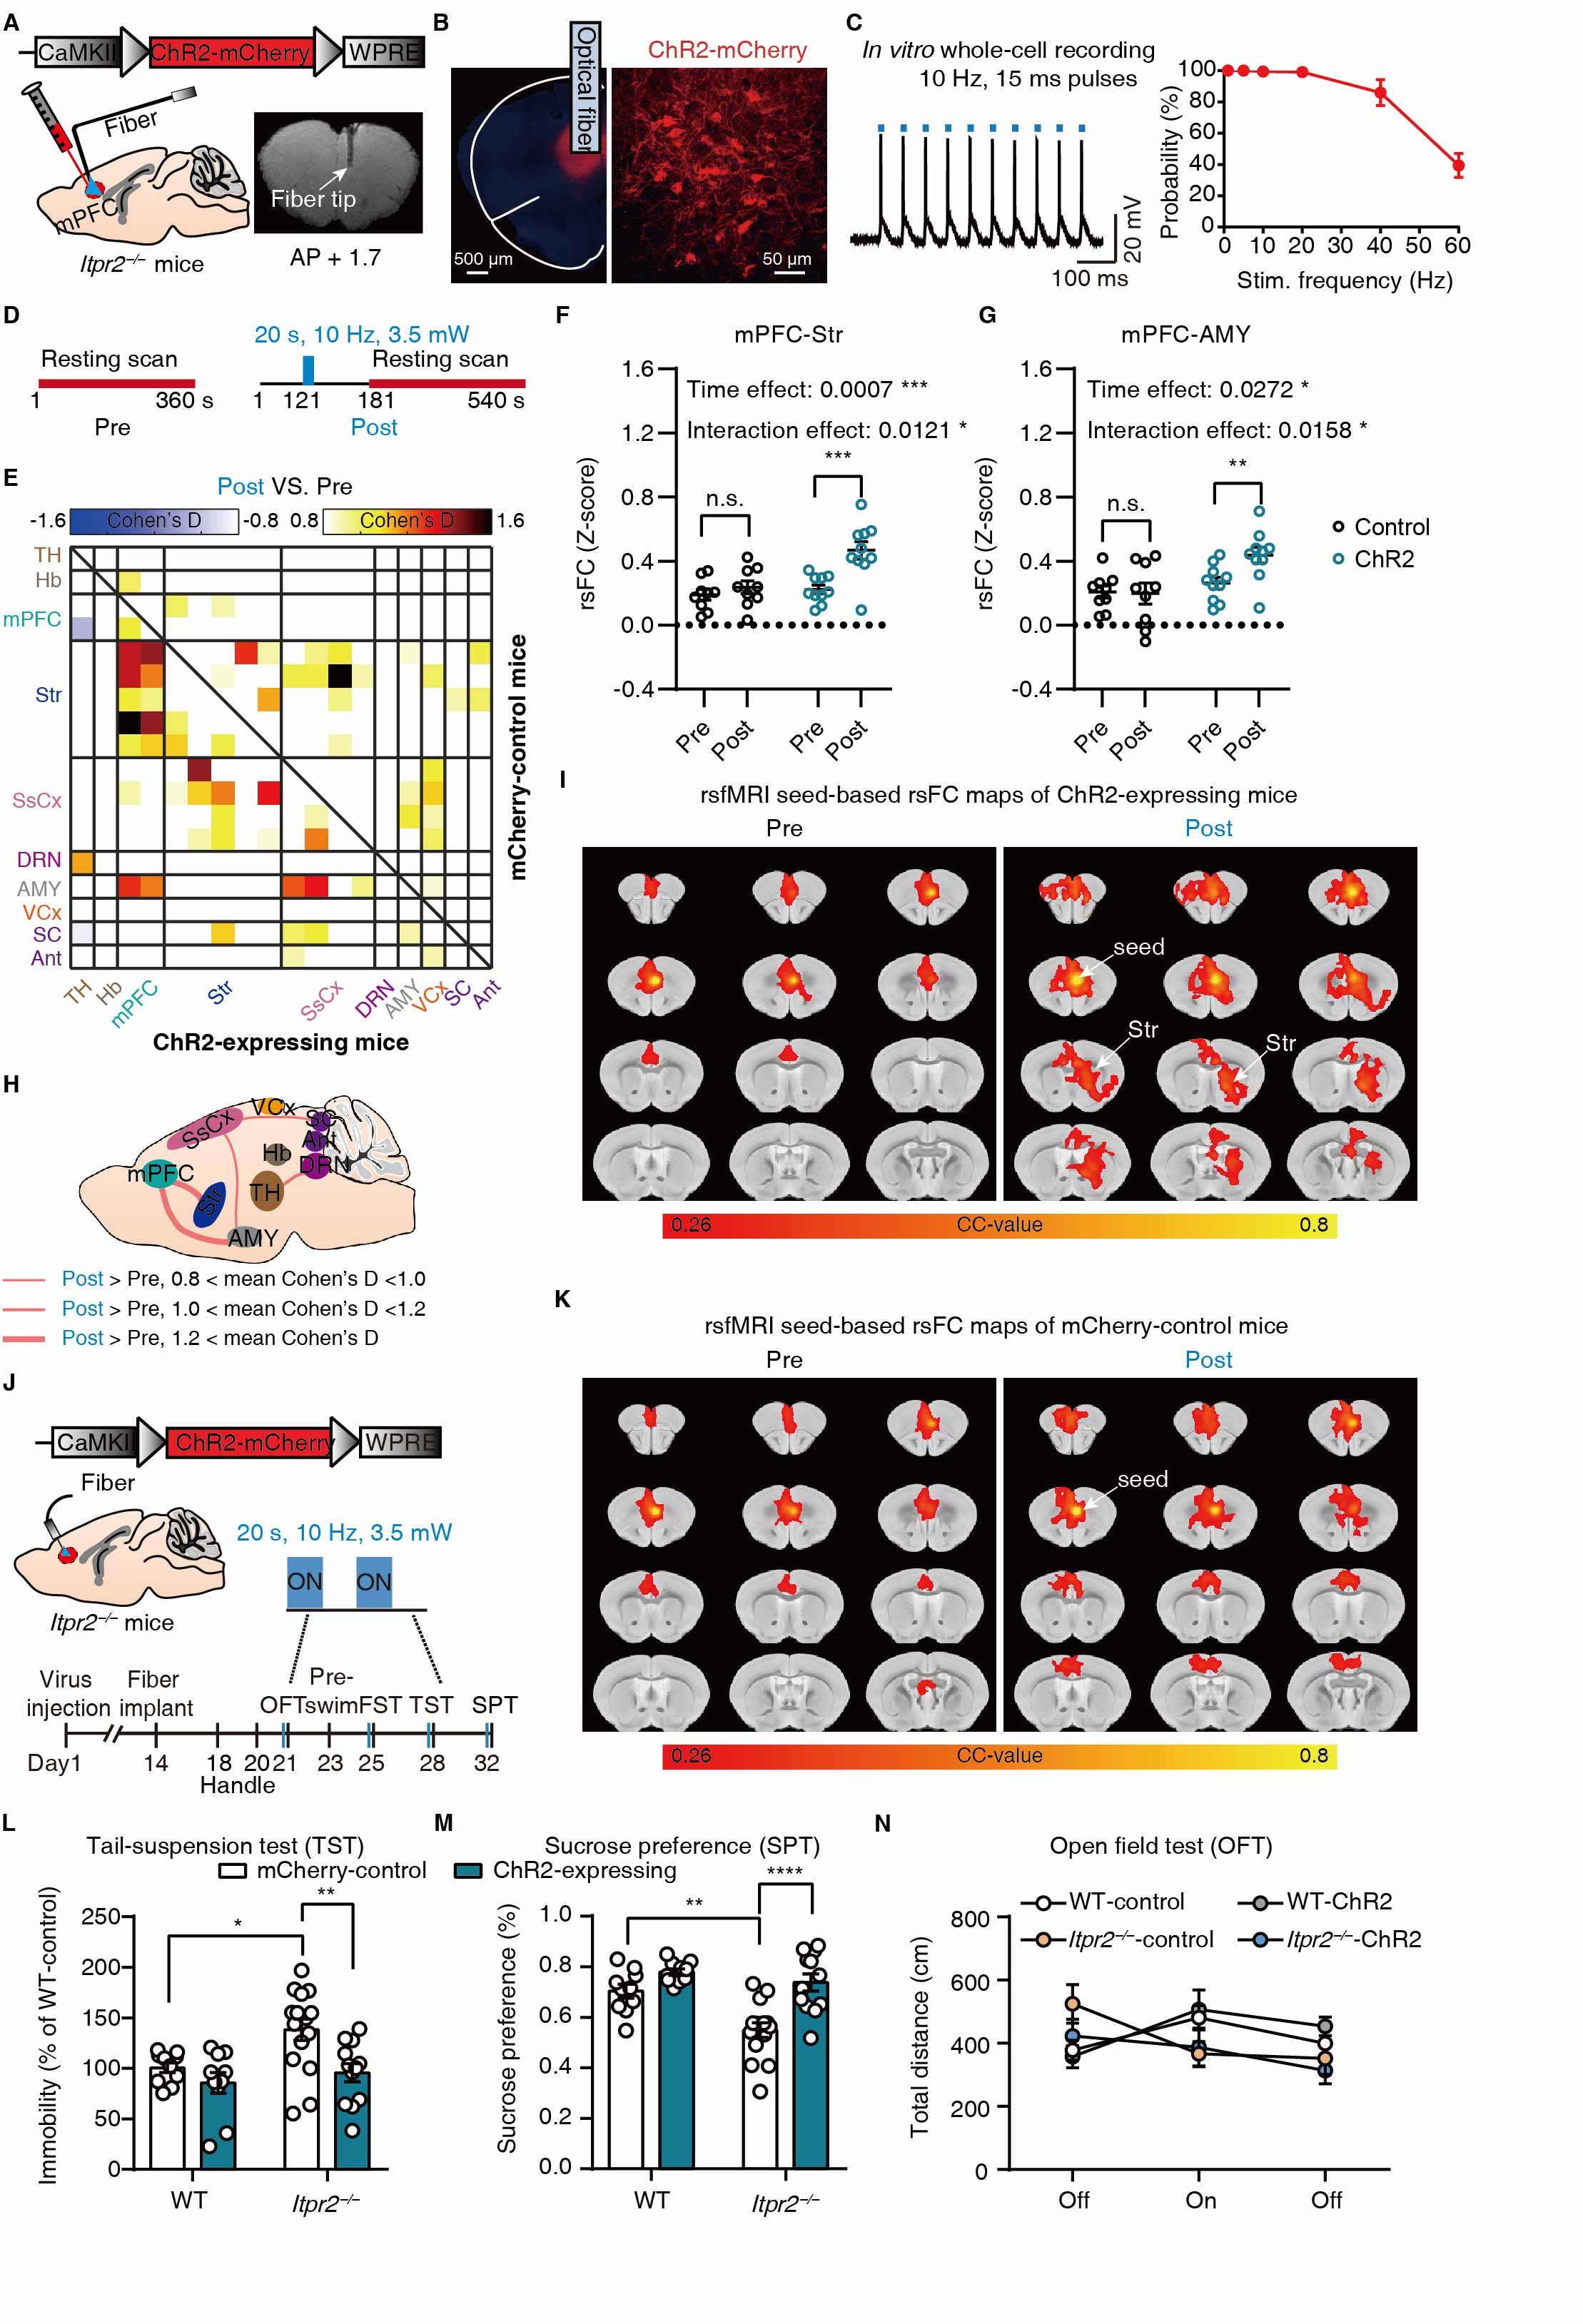
Optogenetics: All experiments were approved by the Southern Medical University Animal Ethics Committee. 300 nl of AAV2/9-mCaMKIIα-hChR2(H134R)-mCherry or AAV2/9-mCaMKIIα-mCherry was injected in right mPFC of Itpr2-/- mice (male, 8 weeks). For optogenetic activation of mPFC astrocytes, AAV2/5-gfaABC1D-hChR2(H134R)-mCherry was injected in right mPFC of Itpr2-/- or wild-type mice (male, 8 weeks). Four or eight weeks after injection, blue light (473 nm, 5 mW, 10 Hz) was presented to ChR2-expressing cells.fMRI acquisition and analysis: MRI data was acquired on a Bruker 7T preclinical scanner using GE-EPI with FOV = 16 × 16 mm2, matrix = 64 × 64, flip angle = 54.7°, slice thickness = 0.4 mm, TE = 15 ms, TR = 750 ms (rsfMRI) or 1000 ms (optogenetic fMRI). Data was preprocessed and then performed independent component analysis to extract the time series for Pearson’s correlation analysis. The general linear model was applied to calculate the response maps.
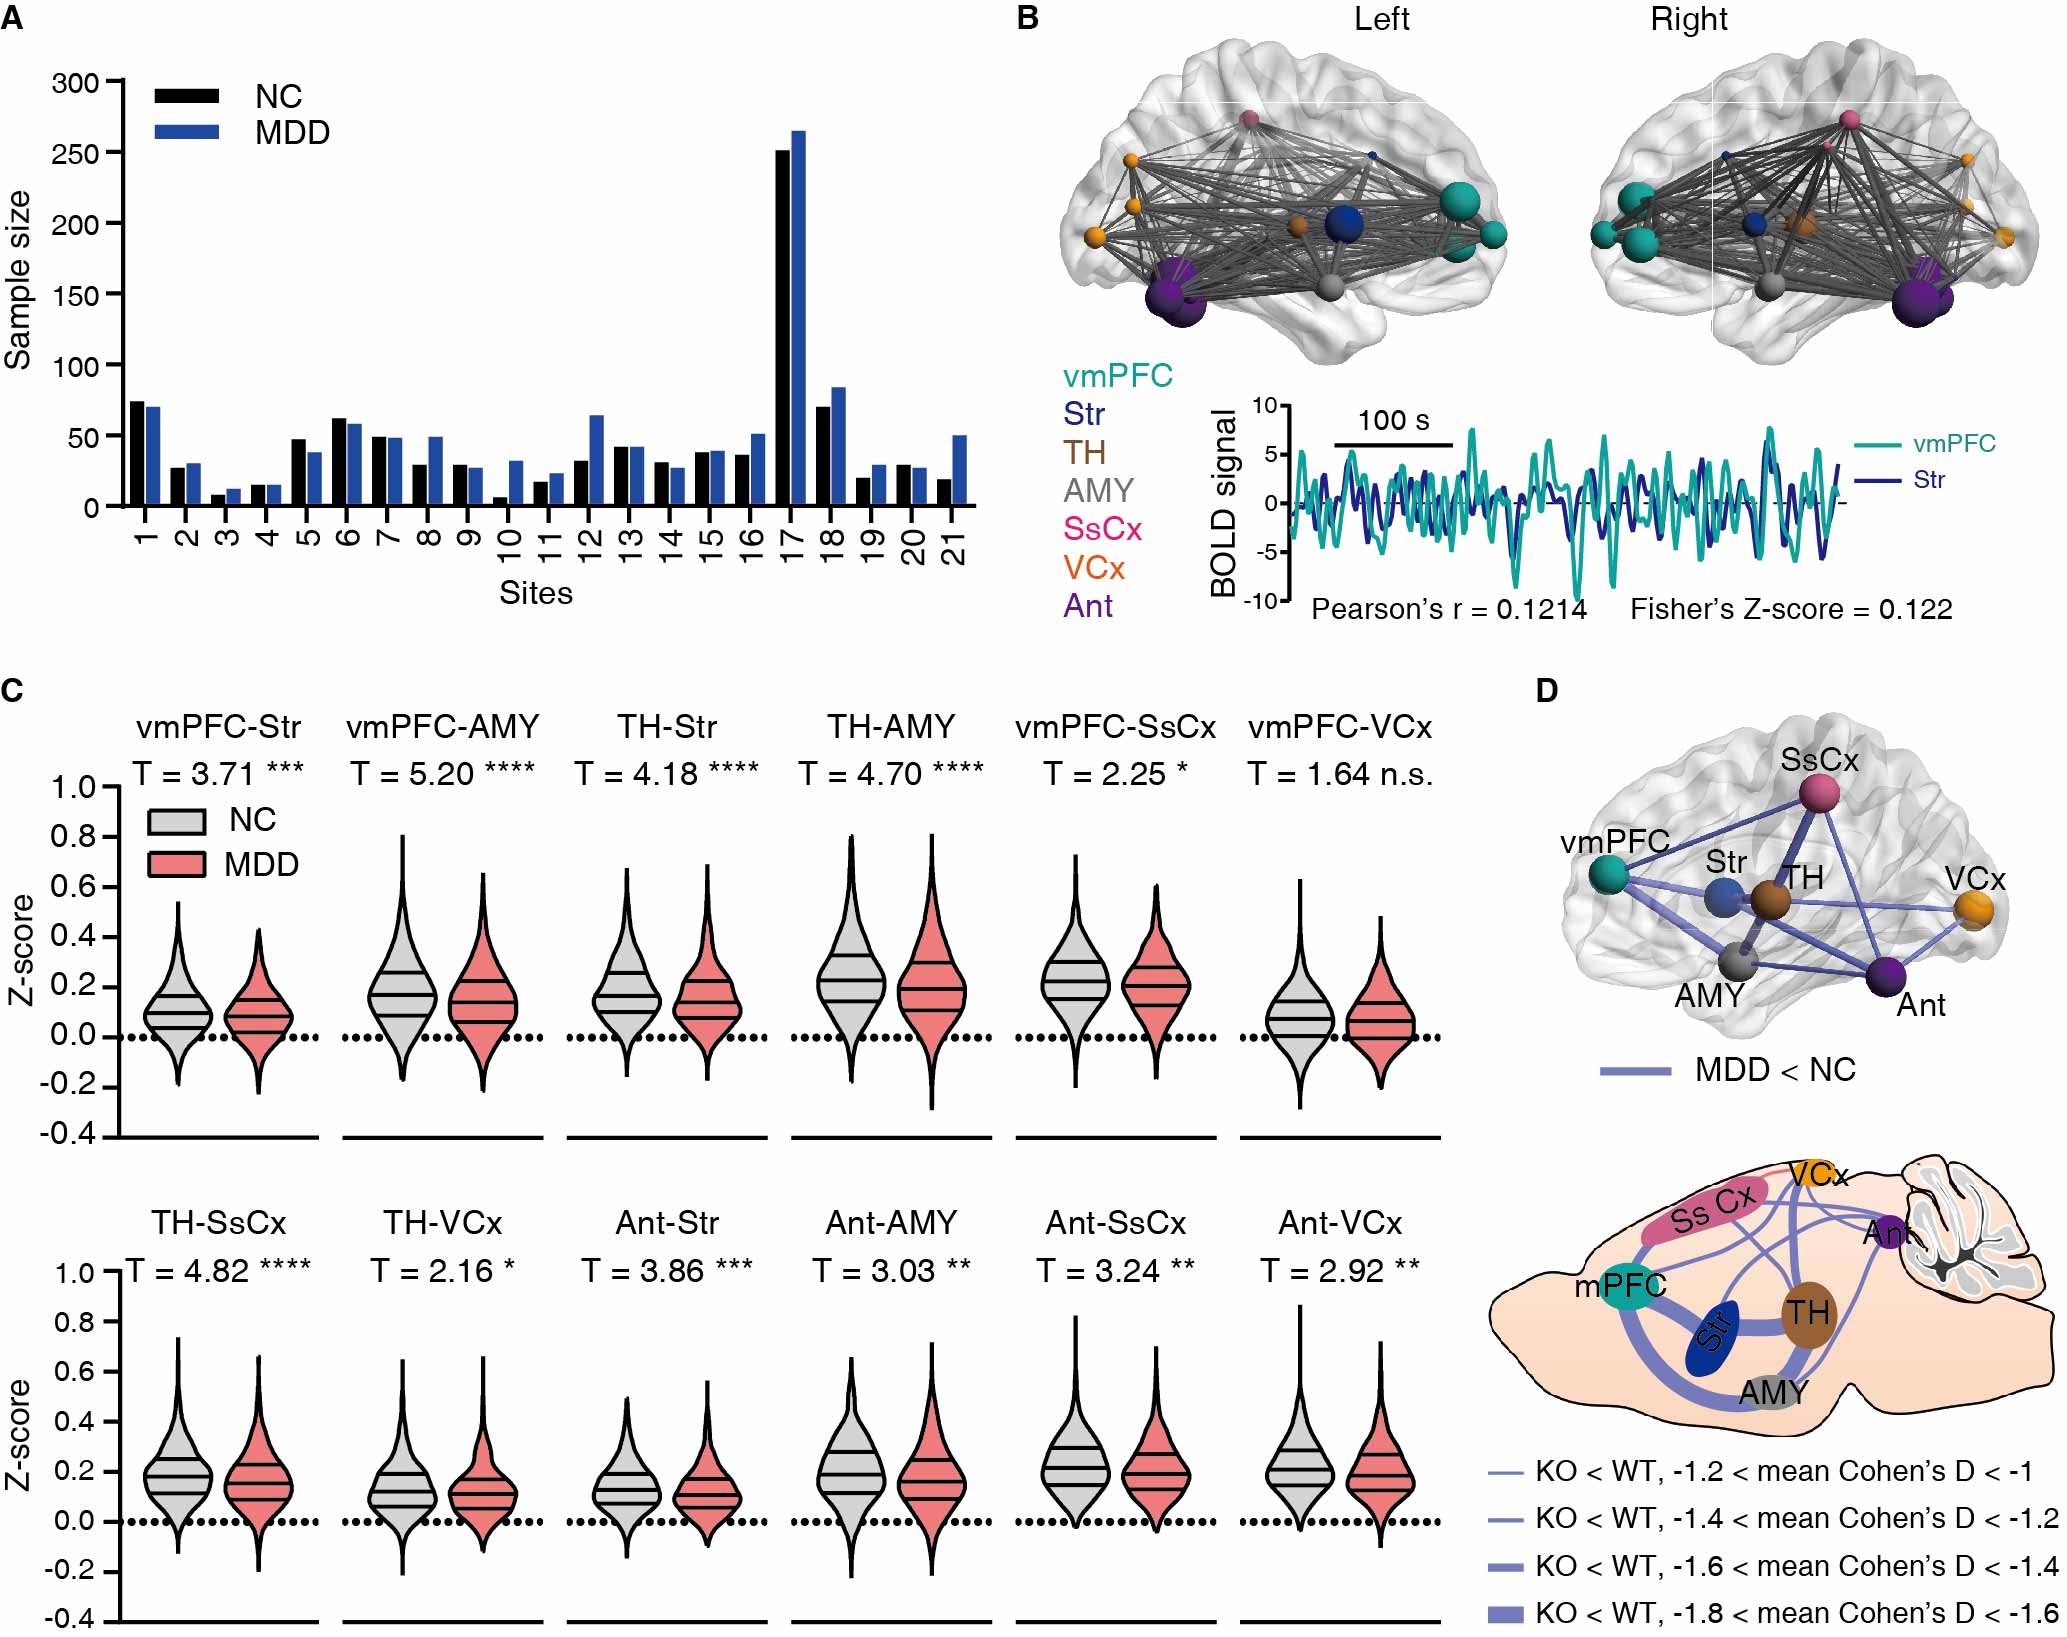
rsfMRI data analysis of MDD patients: Data preprocessing, time series extraction procedure and statistical analysis was described in detail previously10. Pearson’s correlation analysis was used to analyze rsFC.
Behavioral assays: Mice were implanted unilaterally with optical fibers over the infected cells. 20 s blue light (473 nm, 10 Hz, 15% duty cycle) was delivered as 3.5 mW at the fiber tip. Behavioral tests were performed after habituation. The fiber positions of all mice were checked with confocal images.
Results
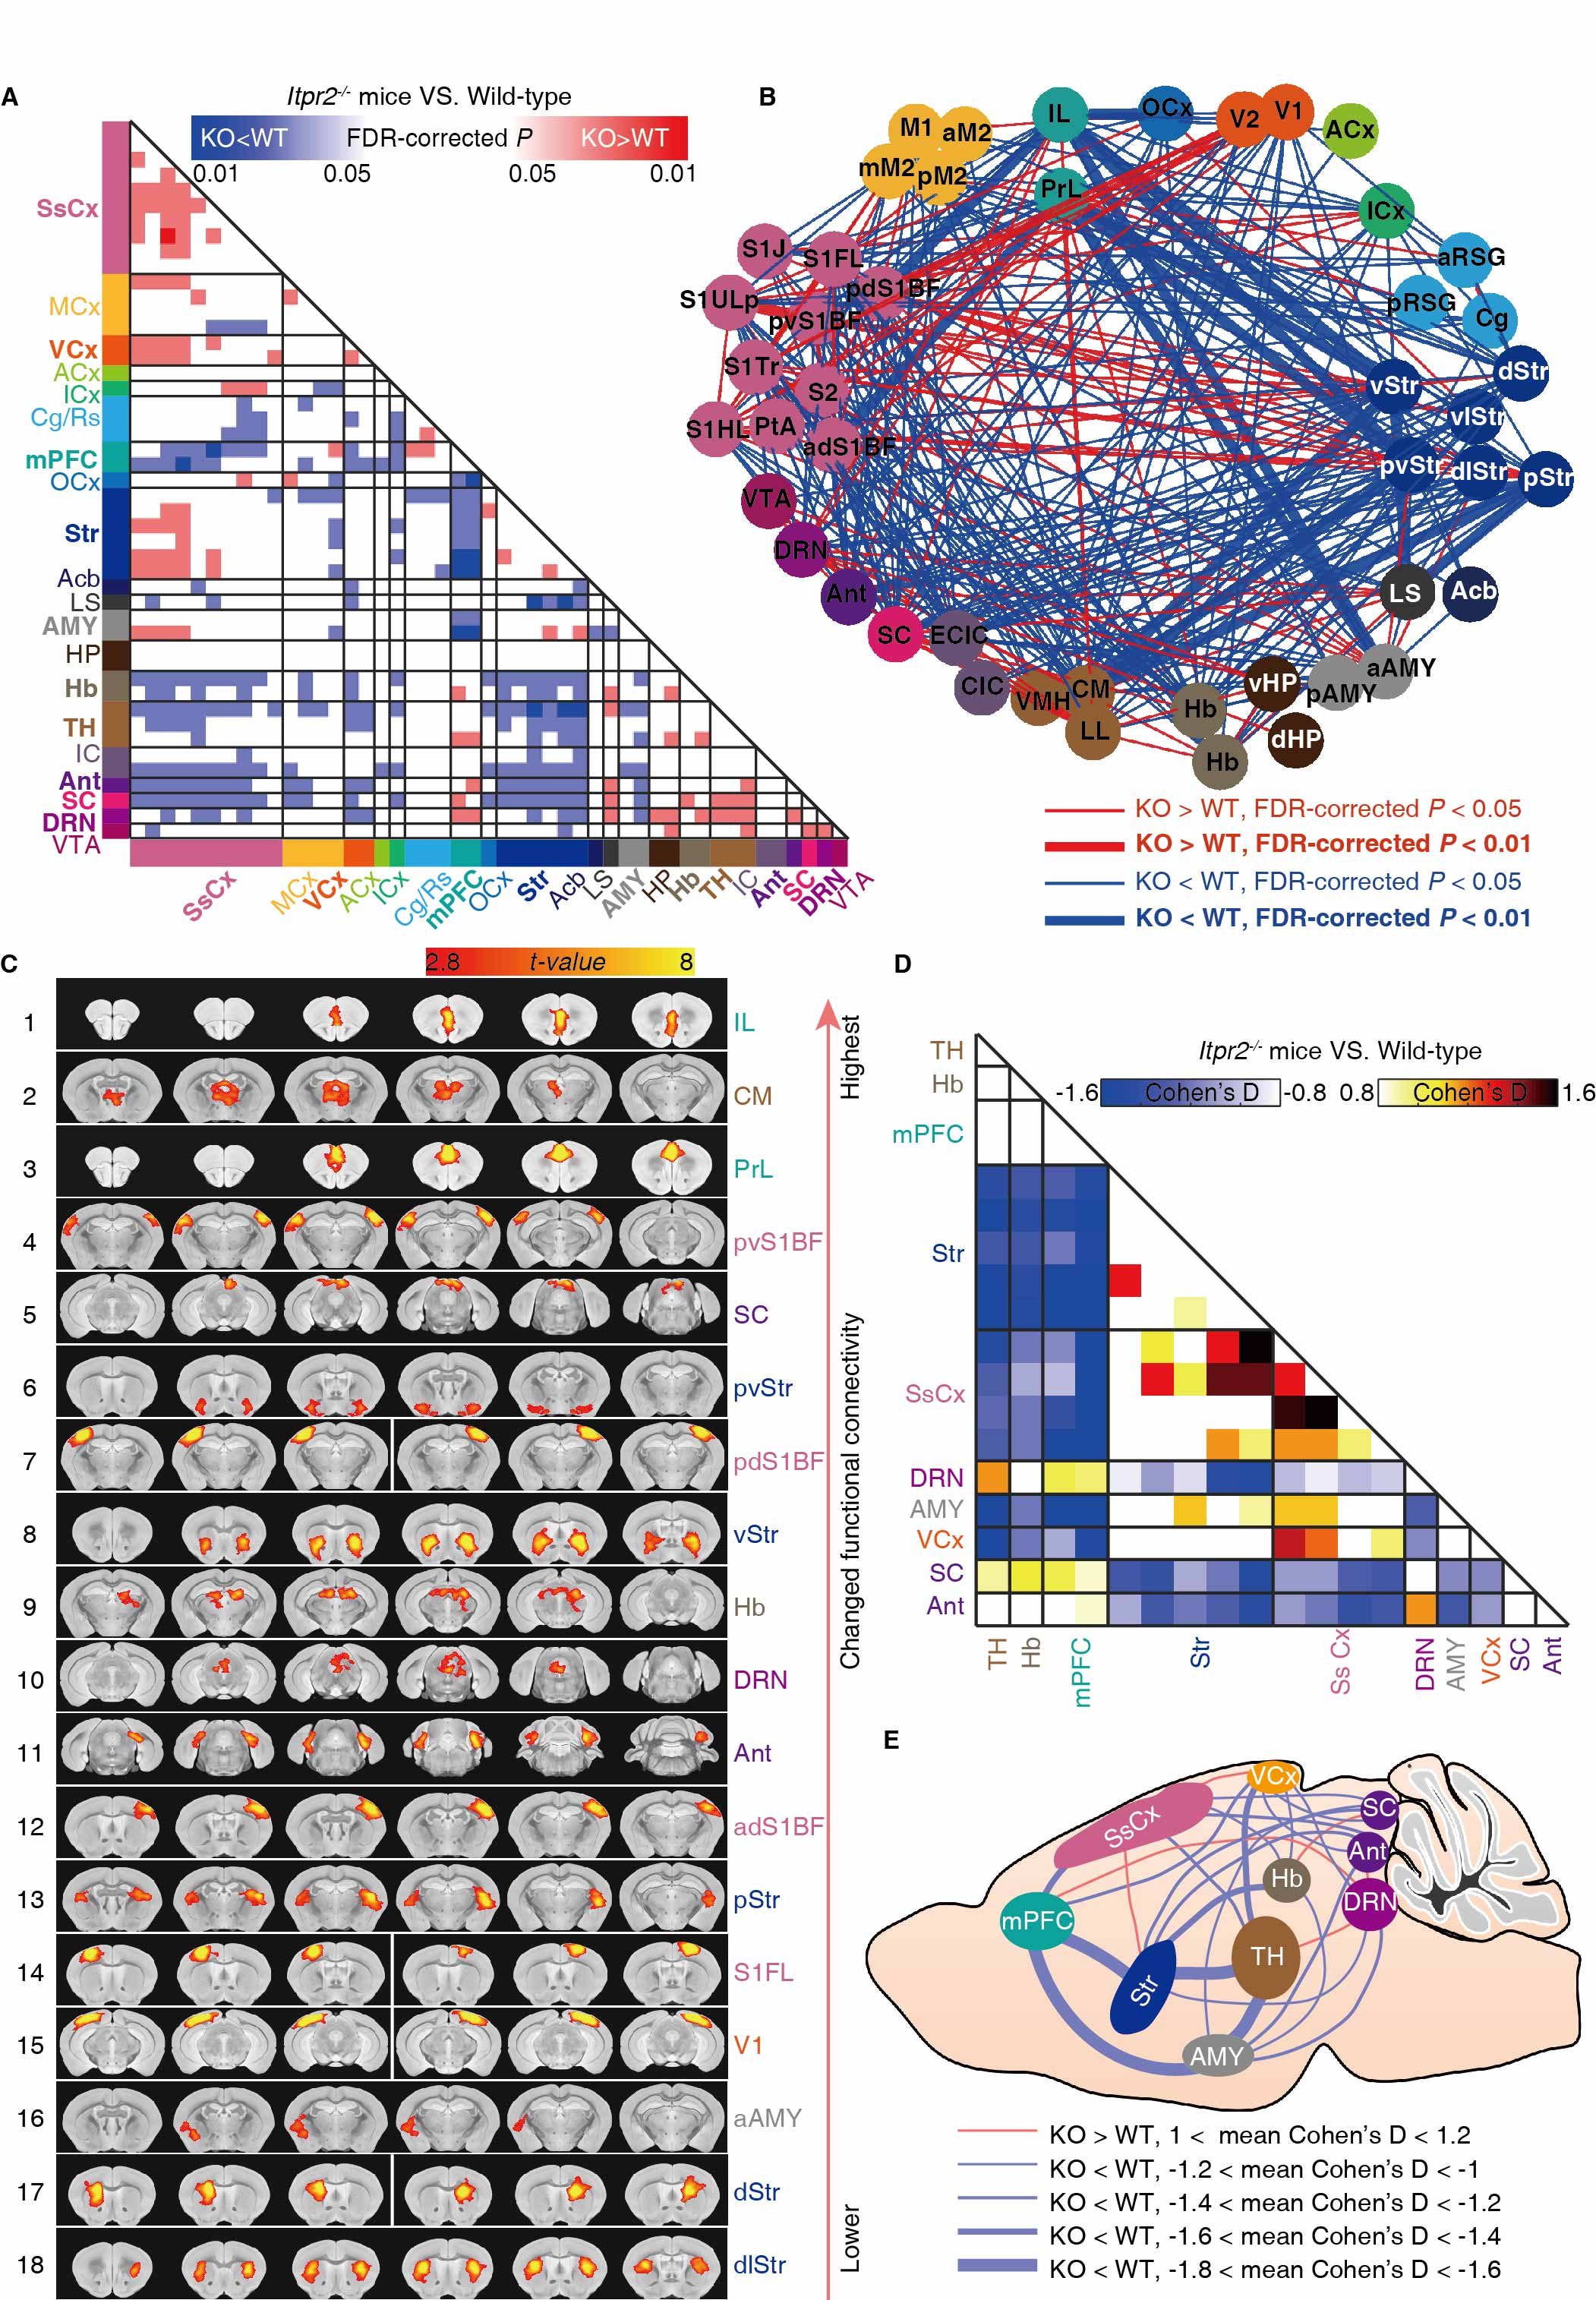
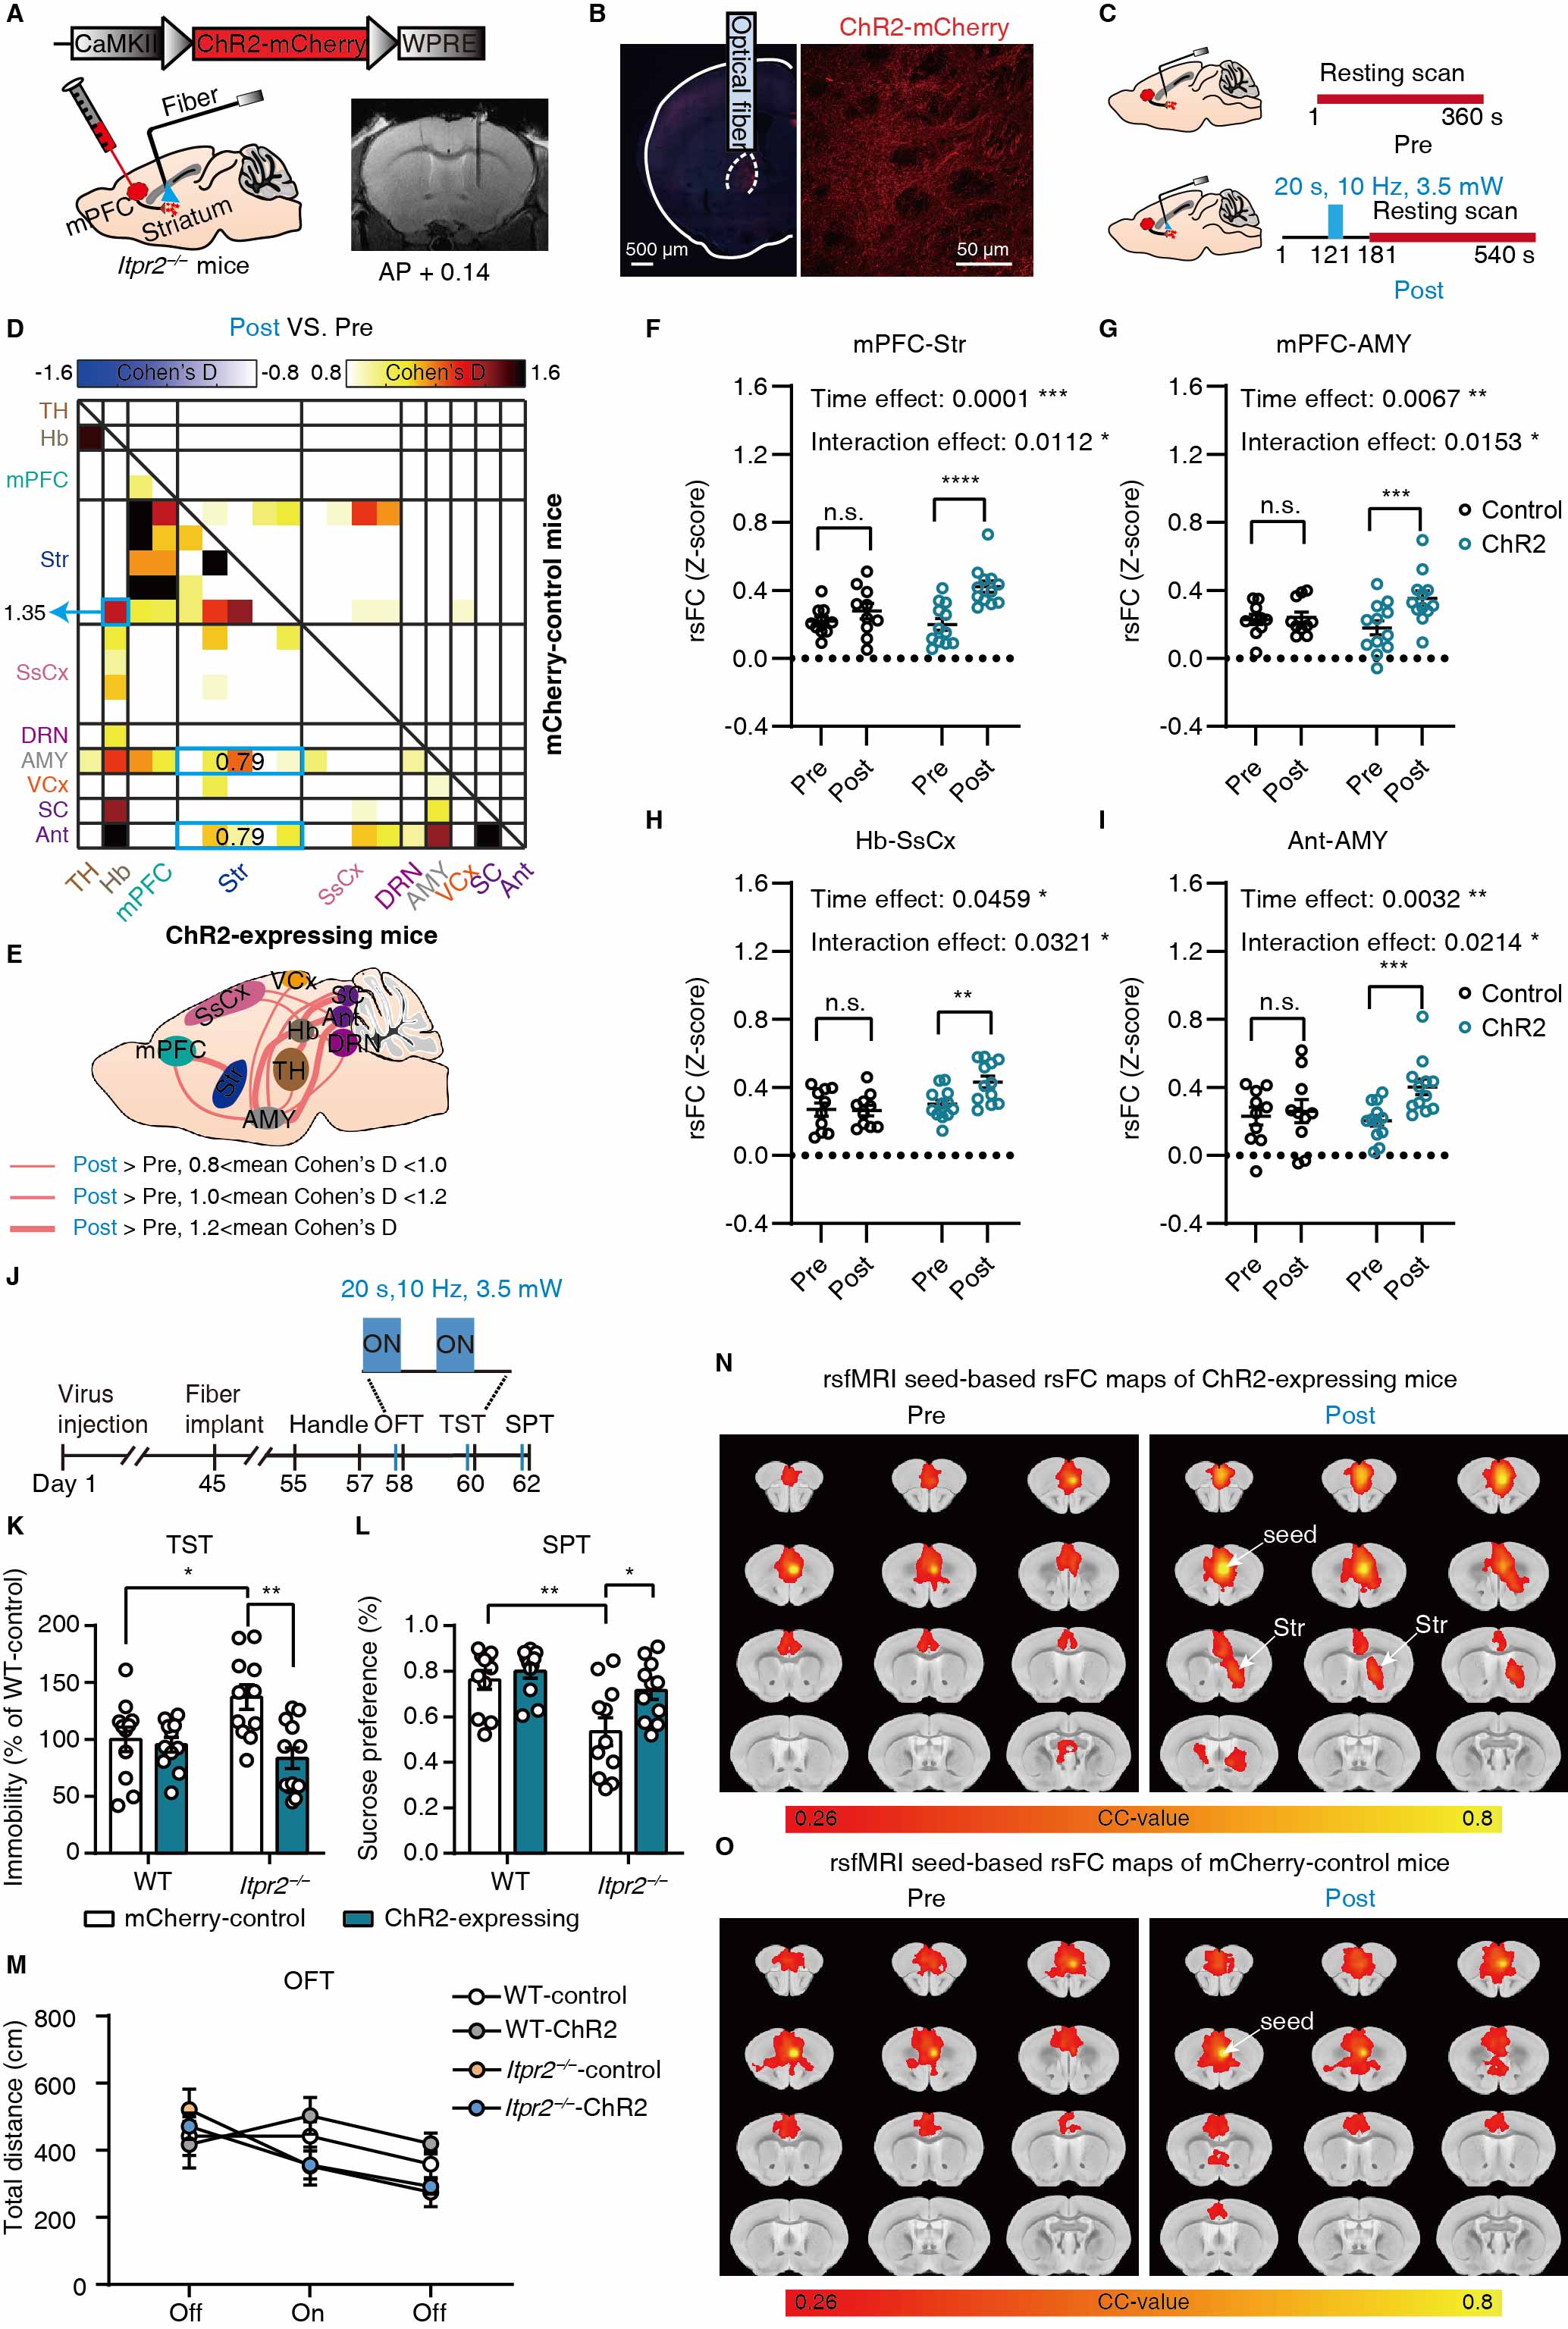
Our previous study has reported that Itpr2-/- mice display depressive-like behaviors5. The Itpr2-/- mice exhibited significant changes in the brain-wide rsFC, especially in key functional hubs involved in emotion processing5,6,11,12, including the mPFC, thalamus (TH), striatum (Str), somatosensory (SsCx), habenula (Hb), amygdala (AMY), dorsal raphe nucleus (DRN), visual cortex (VCx), superior colliculus (SC) and anterior lobe cerebellum (Ant) (hereafter referred to as depression-related networks) (Figure 1).By analyzing the rsfMRI dataset from the REST-meta-MDD consortium10, we found that the altered rsFC in depressed patients and Itpr2-/- mice are highly consistent (Figure 2).
We next found that increased calcium signals in mPFC astrocytes by optogenetic stimulation can mitigate rsFC alterations in depression-related networks, especially partially enhance the decreased rsFC due to astrocyte dysfunction (Figure 3).
Optogenetic activation of mPFC neurons or mPFC-Str projection rescued most of the abnormal rsFC, especially the mPFC-Str and mPFC-AMY rsFC, and produced an antidepressant effect in Itpr2-/- mice (Figures 4 and 5).
Discussion and Conclusion
Here, we showed that Itpr2-/- mice exhibit a decreased rsFC signature in depression-related networks. MDD patients exhibited highly consistent rsFC changes with Itpr2-/- mice. We could partially rescue this signature by astrocytic activation. Moreover, enhancing mPFC-related rsFC using optogenetic stimulation, especially the mPFC-Str rsFC, was paralleled by the improvement of depressive-like behaviors in Itpr2-/- mice. These results indicate that astrocyte dysfunction drives aberrant rsfMRI connectivity in depression.In summary, our results reveal the astrocytic mechanisms underlying functional MRI connectivity aberrations in depression, unifying two distinct and important concepts in the pathophysiology of depression, namely, microscopic astrocyte dysfunction and macroscopic functional network abruptions.
Acknowledgements
We thank the members of the REST-meta-MDD Consortium for providing the human fMRI data. This study was supported by Ministry of Science and Technology China Brain Initiative Grant 2022ZD0204702 (X.C.), National Natural Science Foundation of China 81871349 (Y.F.) and Hong Kong Research Grant Council C7048-16G (E.X.W.).References
1. Kessler, R. C. et al. The epidemiology of major depressive disorder: results from the National Comorbidity Survey Replication (NCS-R). JAMA 289, 3095-3105, doi:10.1001/jama.289.23.3095 (2003). 2. Spellman, T. & Liston, C. Toward Circuit Mechanisms of Pathophysiology in Depression. Am J Psychiatry 177, 381-390, doi:10.1176/appi.ajp.2020.20030280 (2020).
3. Cullen, K. R. et al. Abnormal amygdala resting-state functional connectivity in adolescent depression. JAMA Psychiatry 71, 1138-1147, doi:10.1001/jamapsychiatry.2014.1087 (2014).
4. Lui, S. et al. Resting-state functional connectivity in treatment-resistant depression. Am J Psychiatry 168, 642-648, doi:10.1176/appi.ajp.2010.10101419 (2011).
5. Cao, X. et al. Astrocyte-derived ATP modulates depressive-like behaviors. Nat Med 19, 773-777, doi:10.1038/nm.3162 (2013).
6. Cui, Y. et al. Astroglial Kir4.1 in the lateral habenula drives neuronal bursts in depression. Nature 554, 323-327, doi:10.1038/nature25752 (2018).
7. Torres-Platas, S. G., Nagy, C., Wakid, M., Turecki, G. & Mechawar, N. Glial fibrillary acidic protein is differentially expressed across cortical and subcortical regions in healthy brains and downregulated in the thalamus and caudate nucleus of depressed suicides. Mol Psychiatry 21, 509-515, doi:10.1038/mp.2015.65 (2016).
8. Zhou, X. et al. Astrocyte, a Promising Target for Mood Disorder Interventions. Front Mol Neurosci 12, 136, doi:10.3389/fnmol.2019.00136 (2019).
9. Anderson, K. M. et al. Convergent molecular, cellular, and cortical neuroimaging signatures of major depressive disorder. Proc Natl Acad Sci U S A 117, 25138-25149, doi:10.1073/pnas.2008004117 (2020).
10. Yan, C. G. et al. Reduced default mode network functional connectivity in patients with recurrent major depressive disorder. Proc Natl Acad Sci U S A 116, 9078-9083, doi:10.1073/pnas.1900390116 (2019).
11. Hare, B. D. & Duman, R. S. Prefrontal cortex circuits in depression and anxiety: contribution of discrete neuronal populations and target regions. Mol Psychiatry 25, 2742-2758, doi:10.1038/s41380-020-0685-9 (2020).
12. Ferenczi, E. A. et al. Prefrontal cortical regulation of brainwide circuit dynamics and reward-related behavior. Science 351, aac9698, doi:10.1126/science.aac9698 (2016).
Figures