0636
MRI-based porosity index and suppression ratio in the tibial cortex: significant differences in normal, osteopenic, and osteoporotic subjects1Department of Radiology, University of California, San Diego, La Jolla, CA, USA, San Diego, CA, United States, 2Radiology Service, Veterans Affairs San Diego Healthcare System, San Diego, La Jolla, CA, USA, San Diego, CA, United States, 3Department of Orthopedic Surgery, University of California, San Diego, La Jolla, CA, USA, San Diego, CA, United States, 4Department of Medicine, University of California, San Diego, La Jolla, CA, USA, San Diego, CA, United States
Synopsis
Keywords: Bone, Bone, Tibia
The porosity index (PI) and the suppression ratio (SR) are two rapid MRI-based techniques developed using ultrashort echo time (UTE) sequences to evaluate the cortical bone microstructure. We have investigated the performance of PI and SR in detecting tibial bone quality differences between osteoporosis (OPo) patients, osteopenia (OPe) patients, and healthy volunteers with normal bone (Normal). We also investigated the correlations of PI and SR with DEXA T-score performed at the hip in patients. PI and SR were significantly higher in the OPo group compared with the Normal and OPe groups. DEXA T-score was significantly correlated with PI and SR.INTRODUCTION
According to the World Health Organization, bone mineral density (BMD) assessment using dual-energy x-ray absorptiometry (DEXA) is the standard method for osteoporosis (OPo) diagnosis (1–4). Notably, a major portion of bone volume (>55% in cortical bone and >90% in trabecular bone) (5) is comprised of the organic matrix, water, and fat, which cannot be accurately evaluated via DEXA measurement or other x-ray-based techniques (6). MRI-based cortical bone evaluation is attractive since MRI is tomographic and avoids the potential harm associated with x-ray-based techniques(7,8). The MRI-based bone evaluation may also provide an excellent assessment of the surrounding soft tissue, a benefit that is not available in x-ray-based techniques. UTE-MRI-based evaluation of bone is partly underutilized due to the high cost and time demands of MRI in general. Several research studies have focused on developing rapid and efficient UTE-MRI-based bone evaluation methods to facilitate clinical translational imaging of bone. The signal ratio calculation in dual-echo UTE imaging (so-called porosity index, PI) (9) and the signal ratio between UTE and inversion recovery UTE (IR-UTE) (so-called, suppression ratio, SR) (10) are two remarkable examples of rapid UTE-based bone evaluation techniques, each of which takes less than 5 minutes. This study aimed to investigate the performance of PI and SR in detecting bone quality differences between female osteopenia (OPe) patients, osteoporosis (OPo) patients, and participants with normal bone (Normal).METHODS
Tibial cortical bone of 82 female participants (37 Normal (36±19 yo), 14 OPe patients (72±6 yo), and 31 OPo patients (72±6 yo) were scanned on a 3T clinical scanner (MR750, GE) using an eight-channel knee coil. Institutional review board approval and written informed consent were obtained for all recruited subjects. The imaging slab was centered in the middle of the tibia. The UTE-MRI scans involved: a) dual-echo 3D Cones UTE sequence (TR=100 ms, TE=0.032 and 2.2 ms, FA=10°) for PI measurement (2nd TE signal divided by UTE signal) (7,9,11) and b) 3D inversion recovery (IR) Cones UTE sequence (TR=100, TI=45, and TE=0.032ms, FA=20°) to calculate SR (UTE signal divided by IR-UTE signal)(7,10,11). Field-of-view (FOV), matrix dimension, nominal voxel size, number of slices, and slice thickness were 14cm, 160×160×0.87mm, 24, and 5mm, respectively. The total scan time was approximately 10 mins. Average MRI signals were calculated within regions of interest (ROIs) covering the entire bone cross-section selected by two experienced MRI readers for measuring PI and SR using a home-developed MATLAB (Mathworks, MA, USA) code. Intraclass correlation coefficient (ICC) was calculated for PI and SR between the two readers. The Kruskal–Wallis test by ranks was used to examine the PI and SR differences between the groups. Spearman’s correlation was calculated between MRI measures and available hip T-score for 51 patients. P-values <0.05 were considered significant.RESULTS
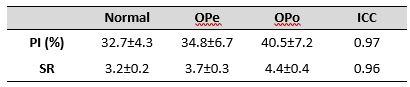
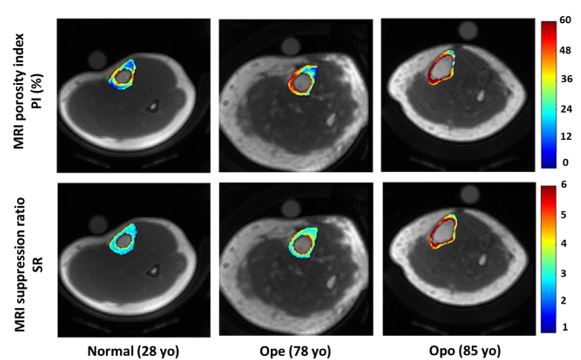
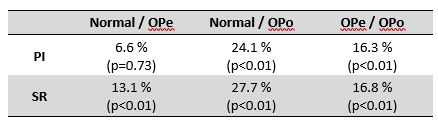
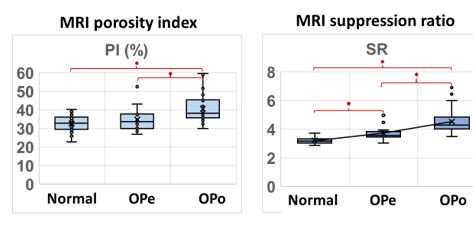
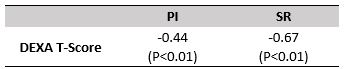
Average UTE-MRI measures and inter-observer ICCs are presented in Figure 1 (Table 1) for Normal, OPe, and OPo groups. For all MRI parameters, ICCs were higher than 0.95, indicating a high consistency between measurements performed by independent readers. PI and SR values were observed in the following ascending order: Normal<OPe<OPo. Figure 2 demonstrates the generated PI and SR pixel maps for three exemplary participants from the Normal, OPe, and OPo groups. Percentage differences in PI and SR between the investigated groups and their statistical significance are presented in Figure3 (Table 2). PI was significantly higher in the OPo group compared with the Normal (24.1%) and OPe (16.3%) groups. PI in the OPe group was higher than in the Normal group, but the difference was nonsignificant. SR was significantly higher in the OPo group compared with the Normal (27.7%) and Ope (16.8%) groups. SR differences between the OPe and Normal groups were also statistically significant (13.1%). Figure 4 depicts the average, median, SD, and first and third quartiles of PI and SR values for each group of participants using Whisker boxplots. Significant differences are indicated between groups by horizontal red lines marked with an asterisk. Spearman’s correlation coefficients between DEXA T-score (performed at the hip or spine) and UTE-MRI measures (performed at the tibial shaft) are presented in Figure 5 (Table 3, using 51 data points with DEXA scans; young control subjects did not have DEXA scans). SR correlation with T-score was significant moderate (R=-0.67), while PI showed a significant but poor correlation with T-score (R=-0.44).DISCUSSION
PI and SR, two recently developed rapid UTE-MRI-based indices, were significantly higher in the OPo group compared with the Normal and OPe groups. DEXA T-scores in patients were significantly correlated with PI and SR. These rapid UTE-MRI-based techniques for bone assessment can be considered in vivo-translatable techniques due to their simplicity, time efficiency, and, importantly, their non-invasive and ionizing-radiation-free nature.CONCLUSION
PI and SR, as rapid UTE-MRI-based techniques, may be useful tools to detect and monitor bone quality changes in individuals affected by osteoporosis.Acknowledgements
The authors acknowledge grant support from the National Institutes of Health (R01AR068987, R01AR062581, R01AR075825, K01AR080257, R01AR079484, and 5P30AR073761), Veterans Affairs Clinical Science and Rehabilitation R&D (I01CX001388, I01RX002604, and I01CX000625), and GE Healthcare.References
1. Zanker J, Duque G. Osteoporosis in Older Persons: Old and New Players. J Am Geriatr Soc 2019;67:831–840 doi: 10.1111/jgs.15716.
2. Guerri S, Mercatelli D, Gómez MPA, et al. Quantitative imaging techniques for the assessment of osteoporosis and sarcopenia. Quant Imaging Med Surg 2018;8:60–85 doi: 10.21037/qims.2018.01.05.
3. Looker AC, Frenk SM. Percentage of Adults Aged 65 and Over With Osteoporosis or Low Bone Mass at the Femur Neck or Lumbar Spine: United States, 2005–2010. Centers for Disease Control and Prevention 2015:2005–2010.
4. Dimai HP. Use of dual-energy X-ray absorptiometry (DXA) for diagnosis and fracture risk assessment; WHO-criteria, T- and Z-score, and reference databases. Bone 2017;104:39–43 doi: https://doi.org/10.1016/j.bone.2016.12.016.
5. MacDonald HM, Nishiyama KK, Kang J, Hanley DA, Boyd SK. Age-related patterns of trabecular and cortical bone loss differ between sexes and skeletal sites: A population-based HR-pQCT study. Journal of Bone and Mineral Research 2011;26:50–62 doi: 10.1002/jbmr.171.
6. Trajanoska K, Schoufour JD, de Jonge EAL, et al. Fracture incidence and secular trends between 1989 and 2013 in a population based cohort: The Rotterdam Study. Bone 2018;114:116–124 doi: 10.1016/j.bone.2018.06.004.
7. Ma Y-J, Jerban S, Jang H, Chang D, Chang EY, Du J. Quantitative Ultrashort Echo Time (UTE) Magnetic Resonance Imaging of Bone: An Update. Front Endocrinol (Lausanne) 2020;11:667–676 doi: 10.3389/fendo.2020.567417.
8. Jerban S, Chang DG, Ma Y, Jang H, Chang EY, Du J. An Update in Qualitative Imaging of Bone Using Ultrashort Echo Time Magnetic Resonance. Front Endocrinol (Lausanne) 2020;11:677–689 doi: 10.3389/fendo.2020.555756.
9. Rajapakse CS, Bashoor-Zadeh M, Li C, Sun W, Wright AC, Wehrli FW. Volumetric Cortical Bone Porosity Assessment with MR Imaging: Validation and Clinical Feasibility. Radiology 2015;276:526–35 doi: 10.1148/radiol.15141850.
10. Li C, Seifert AC, Rad HS, et al. Cortical Bone Water Concentration: Dependence of MR Imaging Measures on Age and Pore Volume Fraction. Radiology 2014;272:796–806 doi: 10.1148/radiol.14132585.
11. Jerban S, Ma Y, Wei Z, Jang H, Chang EY, Du J. Quantitative Magnetic Resonance Imaging of Cortical and Trabecular Bone. Semin Musculoskelet Radiol 2020;24:386–401 doi: 10.1055/s-0040-1710355.
Figures