0630
Quantification of muscle fat fraction and water T2 via RF phase-modulated 3D gradient-echo imaging1NMR Laboratory, Neuromuscular Investigation Center, Institute of Myology, Paris, France, 2Siemens Healthcare SAS, Saint-Denis, France
Synopsis
Keywords: Muscle, Quantitative Imaging
Intramuscular fat fraction (FF) is a frequently used biomarker of neuromuscular disease severity while water-T2 has been identified as a biomarker of disease activity. In this feasibility study, we explored the possibility to exploit RF phase-modulated 3D gradient-echo imaging to obtain multi-parametric mapping adapted to the study of skeletal muscles. Monte Carlo simulations were conducted to evaluate the robustness to noise of this proposed approach. An in vivo proof of concept on healthy volunteers was performed.Introduction
In clinical trials related to neuromuscular diseases (NMDs), the intramuscular fat fraction (FF) and water-T2 relaxation time are typically used as imaging biomarkers of disease severity and activity, respectively1. Both can be assessed using multi-spin-multi-echo (MSME) sequences, which remains the reference approach for T2 measurement2. But this approach lacks 3D compatibility. Fast 3D parametric sequences are often required for longitudinal evaluations, in which inter-scan reproducible positioning is crucial because the pattern of disease involvement in the muscles can be highly spatially heterogeneous3.It has been shown that RF phase-modulated (or partially-spoiled) 3D gradient-echo (GRE) steady-state signal could be sensitized to T2 by varying RF-phase increments (φinc)4, allowing fast T2 mapping from a few GRE phase images5-6. The whole complex signal can also be exploited to extract a larger number of parameters, including T2, using the QuICS (quantitative imaging using configuration states) method7. However, these methods did not address the issue of fatty infiltration, which represents an important limitation for patients with NMDs. In the present work, we optimized the parameters of a series a partially-spoiled 3D GRE (SPGR), based on the VIBE sequence, to extract simultaneously the water-T2 and FF in muscle tissues.
Methods
The steady-state signal of SPGR sequences applied in mixture of water and fat was computed using a differentiable extended phase graph (EPG) algorithm. A 6-peak fat model was used for an accurate representation of the lipid signal8. The measured complex signal was fitted by exhaustive search into a two-component dictionary to obtain water-T2 and B1 estimates, using a phase-constrained least squares linear regression for the weights of the water and fat components.In designing the series of SPGR sequence, the number of acquired volumes was set to 10, as a trade-off between the acquisition time and the precision on the extracted variables. TE and TR were set to minimum (2.25 and 5.5 ms respectively) to minimize the examination time. The same TE was kept between all the acquisitions to minimize the sensitivity to B0. A strategy based on the minimization of the Cramer-Rao lower bound (CRLB) was used to determine the flip angles and the phase increments to be applied to the SPGR image series to optimize the precision on the three parameters of interest: FF, water-T2 and B1. The cost function (CF) was defined as the CRLB of the following parameter combination: magnitude, FF, water T1, B1 and water T2, summed over three different B1 values (0.8-1-1.2). It was then minimized using the Sequential Least Squares Programming (SLSQP) algorithm from the scipy.minimize Python package9. Monte Carlo simulations were performed to evaluate the accuracy and precision of the method for several SNR values.
Acquisitions were performed at 3T (Magnetom PrismaFit, Siemens Healthineers, Erlangen Germany) using a flexible body matrix coil or a 15-channel knee coil on the lower limbs of two healthy volunteers. One volunteer was scanned at rest on the thighs. The second volunteer was asked to perform a calf raises exercise until muscle exhaustion and was scanned before and after exercise on the right leg.
A 17-TE MSME-based image series, fitted by dictionary searching2 and a GRE-VIBE 3-point Dixon10 scan were acquired as reference values for water-T2 and FF, respectively. We modified the VIBE sequence to be able to adjust φinc and spoiling gradient.
For all sequences, scan parameters were: Axial plane, FOV 175x350 mm2. SPGR scan parameters were resolution 0.8x0.8x5 mm3, FA=(6.5,7,25,26,8,8,17,13,16,16)°,φinc=(0.3,0.3,-1.1,0.3,2.1,-2.1,3,-2.6,2.8,-2.6)°. Scan time were 3min41s for the MSME, 1min24s for the Dixon and 4min 40s for the proposed method.
Results
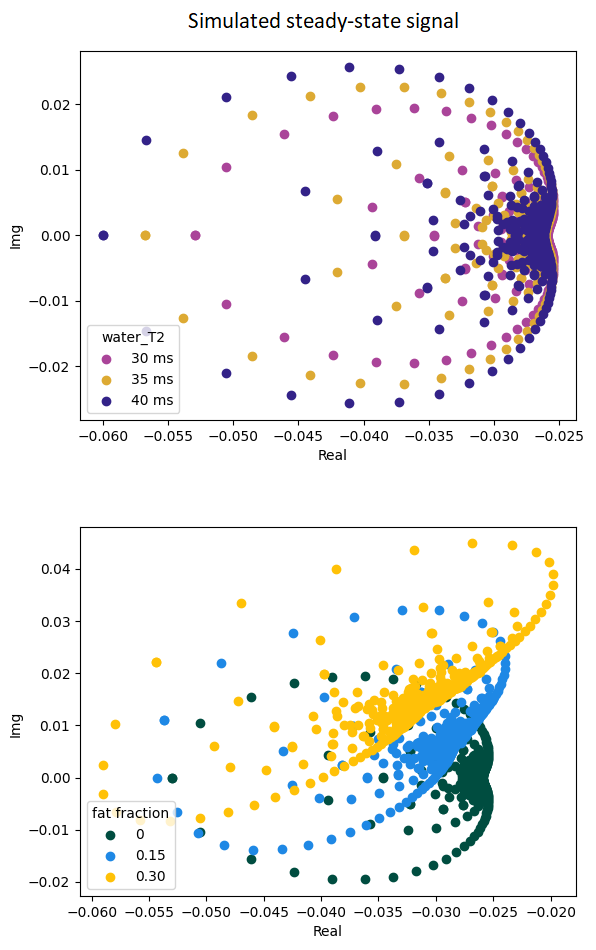
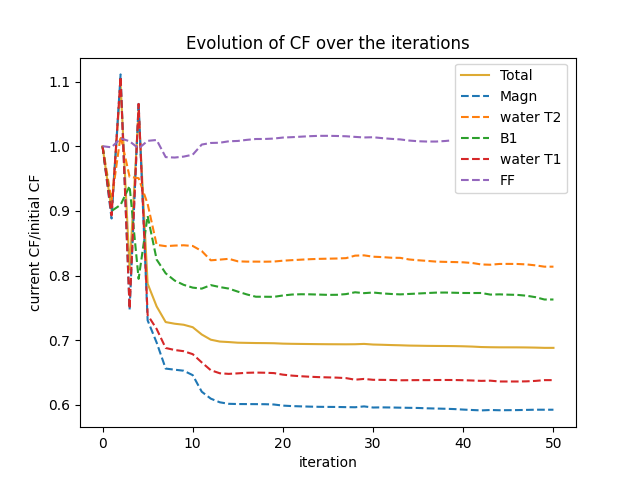
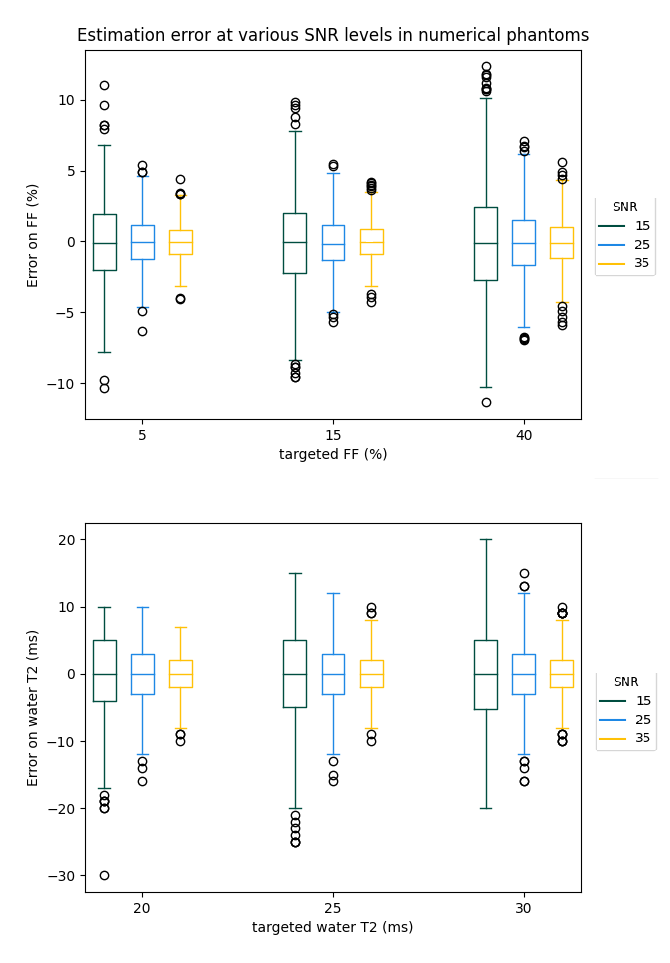
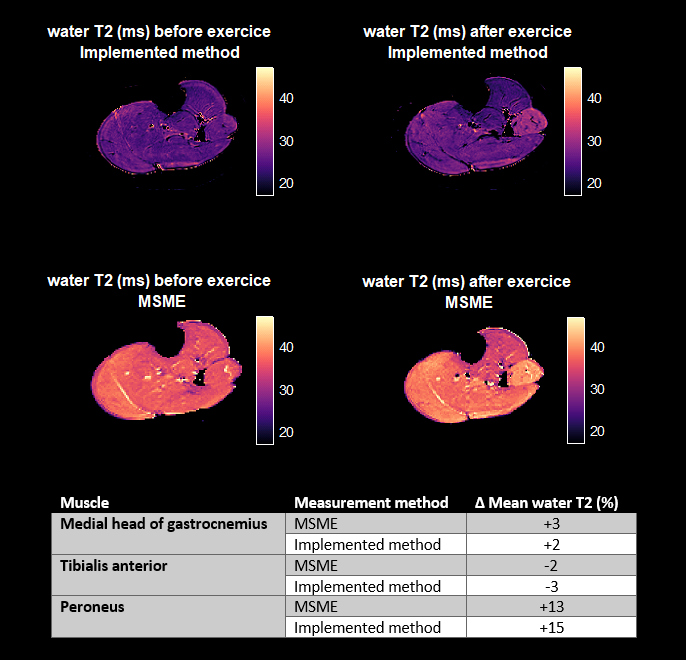
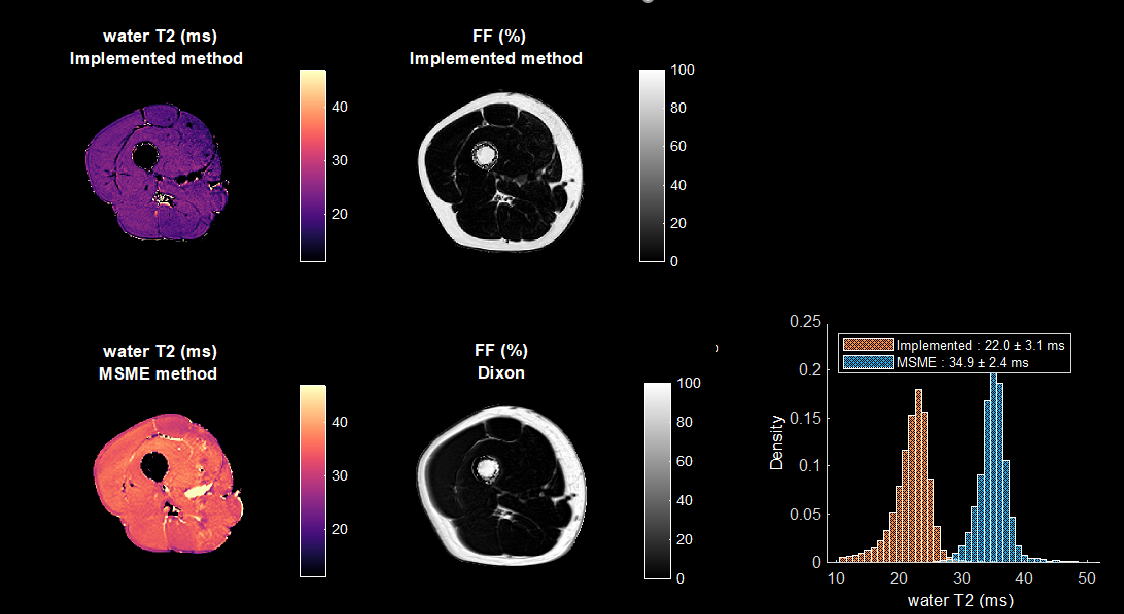
Fig.1 shows the complex representation of the EPG simulated SPGR steady-state signal for different φinc between 0 and 360° for different realistic fat fraction and water T2 values. This highlights the sensitivity of the complex signal to these two tissue parameters, and thereby the possibility of identifying them from a number of well-chosen acquisitions. Fig.2 shows the decrease of the cost function during the optimization phase. The optimization resulted in an improvement of the precision of the variables estimations. Fig.3 provides simulations performed with the chosen sequence parameters and illustrates its robustness in the presence of Gaussian noise. On average, FF is consistently reliable with a standard deviation below 5% even at low SNR such as 15; while water-T2 quantification was more affected but remained unbiased. Water T2 was lower using the proposed method compared to MSME . The water T2 map of the exercise data shows a clear activation of the peroneus muscle. This evolution was noticeable in the same proportion using the SPGR and the MSME sequences as shown in Fig.4. In Fig.5, we illustrate the ability of the sequence to handle larger variations of the B1 field on a volunteer’s thigh scan. The FF map was in agreement with the reference method and water-T2 was homogeneous throughout the entire slice.Conclusions/Discussion
Our results shows the potential of multi-parametric muscle MRI based on steady-state sequences as a new method to acquire fast 3D water-T2 and FF maps. The proposed strategy provided valid sequence parameters for muscle characterization. Further evaluation are required to assess it in muscles demonstrating different levels of fat replacement and disease activity.Acknowledgements
No acknowledgement found.References
[1] P. G. Carlier et al., « Skeletal Muscle Quantitative Nuclear Magnetic Resonance Imaging and Spectroscopy as an Outcome Measure for Clinical Trials », JND, vol. 3, no 1, p. 1‑28, mars 2016, doi: 10.3233/JND-160145.
[2] B. Marty et al., « Simultaneous muscle water T 2 and fat fraction mapping using transverse relaxometry with stimulated echo compensation: SIMULTANEOUS MUSCLE WATER T 2 AND FAT FRACTION MAPPING », NMR Biomed., vol. 29, no 4, p. 431‑443, avr. 2016, doi: 10.1002/nbm.3459.
[3] M. T. Hooijmans et al., « Non-uniform muscle fat replacement along the proximodistal axis in Duchenne muscular dystrophy », Neuromuscular Disorders, vol. 27, no 5, p. 458‑464, mai 2017, doi: 10.1016/j.nmd.2017.02.009.
[4] P. L. de Sousa, A. Vignaud, E. Caldas de Almeida Araújo, et P. G. Carlier, « Factors controlling T 2 mapping from partially spoiled SSFP sequence: Optimization for skeletal muscle characterization: Accuracy of T2-pSSFP Mapping », Magn. Reson. Med., vol. 67, no 5, p. 1379‑1390, mai 2012, doi: 10.1002/mrm.23131.
[5] A. Seginer et R. Schmidt, « Phase-based fast 3D high-resolution quantitative T2 MRI in 7 T human brain imaging », Sci Rep, vol. 12, no 1, p. 14088, août 2022, doi: 10.1038/s41598-022-17607-z.
[6] X. Wang, D. Hernando, et S. B. Reeder, « Phase‐based T 2 mapping with gradient echo imaging », Magn Reson Med, vol. 84, no 2, p. 609‑619, août 2020, doi: 10.1002/mrm.28138.
[7] L. Leroi et al., « Simultaneous proton density, T 1 , T 2 , and flip‐angle mapping of the brain at 7 T using multiparametric 3D SSFP imaging and parallel‐transmission universal pulses », Magn Reson Med, vol. 84, no 6, p. 3286‑3299, déc. 2020, doi: 10.1002/mrm.28391.
[8] N. Azzabou, H. Reyngoudt, et P. G. Carlier, « Using a generic model or measuring the intramuscular lipid spectrum: impact on the fat infiltration quantification in skeletal muscle. », in Proc. 25th ISMRM, Honolulu, Hawaii, USA, avr. 2017, p. A5189.
[9] P. Virtanen et al., « SciPy 1.0: fundamental algorithms for scientific computing in Python », Nat Methods, vol. 17, no 3, p. 261‑272, mars 2020, doi: 10.1038/s41592-019-0686-2.
[10] G. H. Glover, « Multipoint dixon technique for water and fat proton and susceptibility imaging », J. Magn. Reson. Imaging, vol. 1, no 5, p. 521‑530, sept. 1991, doi: 10.1002/jmri.1880010504.
Figures