0629
Unraveling Bone Marrow Adipose Tissue Composition Through 3T Deep Learning Chemical Shift Encoded-MRI
Dimitri Martel1, Benjamin Leporq2, Anmol Monga1, Stephen Honig3, and Gregory Chang1
1Radiology, NYU Langone, New York, NY, United States, 2Université de Lyon; CREATIS CNRS UMR 5220, Inserm U1206, INSA-Lyon, Villeurbanne, France, 3Osteoporosis Center, Hospital for Joint Diseases, NYU Langone, New York, NY, United States
1Radiology, NYU Langone, New York, NY, United States, 2Université de Lyon; CREATIS CNRS UMR 5220, Inserm U1206, INSA-Lyon, Villeurbanne, France, 3Osteoporosis Center, Hospital for Joint Diseases, NYU Langone, New York, NY, United States
Synopsis
Keywords: Bone, Fat
Chemical Shift Encoded (CSE) MRI method has been used to highlight subregional differences in the femoral bone marrow in terms of fatty acids composition in proximal femur, suggesting an important role of the marrow in bone quality. This method requires a certain number of echoes (3 for fat/water separation and >8 for fatty acids mapping). Deep Learning (DL) has been recently applied to accelerate, improve the quality and efficiency for fat/water separation in CSE-MRI. Our aim was to develop a DL-CSE method and evaluate it for fatty acids composition mapping; using different echo numbers.
Introduction
There are increasing pieces of evidence that bone marrow adipose tissues (BMAT) play a significant role in the pathophysiology of osteoporosis(1-3). Previous reports using chemical shift-encoded (CSE) MRI have described subregional differences in the femur in terms of poly and mono unsaturation in BMAT between primary and secondary osteoporosis in the more biomechanical stressed subregions of the proximal femur suggesting a lipotoxic role of BMAT in OP progression and in bone quality (4-8). This method requires a certain number of echoes (at least 3 for fat/water separation and >8 for fatty acids mapping), and post-processing consists of pixel fitting using complex or magnitude MR signal. To avoid severe artifacts and improve precision, modeling typically includes not only water and fat signals but frequency offsets from main magnetic field inhomogeneities, R2* relaxation, and a multipeak fat spectrum. These models have not only led to a robust technique for fat identification and segmentation, but also the robust measurement of fat content (Proton Density Fat Fraction (PDFF)) and fatty acids (FA) composition: saturated (SFA), monounsaturated (MUFA) and polyunsaturated (PUFA)) for applications in the liver, bone marrow and subcutaneous adipose tissue. Deep Learning (DL) has been applied to various image processing, including Convolutional neural network (CNN), which is the most commonly used artificial neural network. CNNs have been recently applied to accelerate and improve the quality and efficiency of fat/water separation in MRI (9-11). Our aim was to develop a DL-CSE method and evaluate it for fatty acids mapping; using different echo numbers (nTE).Material/Method
This study had institutional review board approval and written informed consent was obtained from all subjects. All subjects were recruited from the Rheumatology division at our institution. We used retrospective data from previous studies of MRI of the pelvis of n=115 subjects (98F, 47.09+/-16.57y, BMI: 24.25+/-4.86 kg/m^2; 17M, 50.61+/-11.5, BMI: 25.17+/-4.71kg/m^2). MRI acquisitions were performed on a clinical 3T MRI system (Skyra System, Siemens Healthineers, Erlangen, Germany) using an 18-channel flexible coil overlying the pelvis. A 3D spoiled-multiple echo gradient echo sequence with a flyback readout gradient was used. The repetition time (TR) and flip angle (FA) were chosen to avoid T1 weighting: TR: 16 msec; FA 5°; 12 echo times (TEs) giving an echo train length of n = (1:12) × 1.2 msec; receiver bandwidth = 2000 Hz.pixel-1; signal averages = 4; the field of view (FOV) was chosen to cover both hips from the level of the femoral head to the femoral shaft with in-plane resolution of 1.5 × 1.5 mm2; matrix = 160 × 160 interpolated to 192 × 192; 52 coronal slices; slice thickness = 2.4 mm, scan time: 5:15 minutes. Magnitude and phase images were systematically saved. Using method described in (7) , fat content (i.e. Proton Density Fat Fraction (PDFF)) and fatty acid composition (i.e. saturated (SFA), monounsaturated (MUFA) and polyunsaturated (PUFA)) were computed as parametric maps. The DL-CSE method was based on a CNN built using MATLAB R2021b Deep Learning Toolbox (MathWorks, Natick, MA), which consists of an encoder subnetwork and a corresponding decoder subnetwork with a depth of 4 (Fig. 1). Slices covering the most of hip bone were used as input images and FA maps as output. To reduce computing time images matrix size were downsampled to 128x128. Magnitude and Phase images of each echo were concatenated across input channels. No data augmentation was performed. Images were divided into Training/Validation/Testing dataset with a respective ratio of 0.6/0.2/0.2 (n=1306/436/436). We trained network with different nTE as input and made subregional measurement in an independent dataset consisting of shorter acquisitions with only 26 slices (2:50min, n=11,F subjects, age=41.80+/-18.73y , BMI=24.57+/-3.79kg/m^2). Subregional analysis was performed by placing ROIs in: the femoral head, femoral neck, femoral shaft, thigh muscle, subcutaneous adipose tissue. In addition, regions with low, medium and high fat content were determined using thresholding of PDFF maps (respectively PDFF<20%, 20-70%, >70%).Results/ Discussion
The CNN architecture is presented in Figure 1 with CSE-MRI acquisition as input and corresponding reconstructed FA maps as output. Figure 2 shows a comparison between processed and predicted maps. Residuals between CSE reconstructed and DL-CSE predicted maps were very low. Structural similarity coefficients are presented in Table 1 and are high for PDFF (0.90-0.94), SFA (0.79-0.86), MUFA (0.80-0.87), and PUFA (0.77-0.84). Figure 3 presents significant correlation coefficients between subregional measurement performed in reconstructed and predicted maps. For subregions with high/medium fat content as SAT or proximal femur, FA measurements are highly correlated (>0.8) even with lower nTE, but had lower correlations in regions with low fat content such as in muscle (SFA:0.76-0.89; MUFA: 0.64-0.76; PUFA: 0.63-0.68). PDFF was highly correlated for all nTE (>0.9) in medium to high fat content subregions (0.64-0.99).Conclusion
In addition to Fat/Water separation, DL-CSE can be used to reconstruct FA maps using acquisition with fewer number of echoes than typically required for BMAT assessment. More subjects are needed to further validate these results.Acknowledgements
No acknowledgement found.References
1. Scheller EL, Rosen CJ. What's the matter with MAT? Marrow adipose tissue, metabolism, and skeletal health. Ann N Y Acad Sci 2014;1311:14-30.2. Scheller EL, Doucette CR, Learman BS, et al. Region-specific variation in the properties of skeletal adipocytes reveals regulated and constitutive marrow adipose tissues. Nat Commun 2015;6(1):7808.
3. Li Z, Hardij J, Bagchi DP, Scheller EL, MacDougald OA. Development, regulation, metabolism and function of bone marrow adipose tissues. Bone 2018;110:134-140.
4. Sollmann N, Löffler MT, Kronthaler S, et al. MRI‐Based Quantitative Osteoporosis Imaging at the Spine and Femur. J Magn Reson Imaging 2021;54(1):12-35.
5. Patsch JM, Musculoskeletal Quantitative Imaging Research Group DoRaBIUoCSFSFCU, Li X, et al. Bone marrow fat composition as a novel imaging biomarker in postmenopausal women with prevalent fragility fractures. J Bone Miner Res 2017;28(8):1721-1728.
6. Karampinos DC, Ruschke S, Dieckmeyer M, et al. Quantitative MRI and spectroscopy of bone marrow. J Magn Reson Imaging 2018;47(2):332-353.
7. Martel D, Leporq B, Saxena A, et al. 3T chemical shift-encoded MRI: Detection of altered proximal femur marrow adipose tissue composition in glucocorticoid users and validation with magnetic resonance spectroscopy. J Magn Reson Imaging 2019;50(2):490-496.
8. Martel D, Leporq B, Bruno M, Regatte RR, Honig S, Chang G. Chemical shift-encoded MRI for assessment of bone marrow adipose tissue fat composition: Pilot study in premenopausal versus postmenopausal women. Magn Reson Imaging 2018;53:148-155.
9. Li S, Shen C, Ding Z, She H, Du YP. Accelerating multi-echo chemical shift encoded water–fat MRI using model-guided deep learning. Magnet Reson Med 2022;88(4):1851-1866.
10. Liu K, Li X, Li Z, et al. Robust water–fat separation based on deep learning model exploring multi-echo nature of mGRE. Magnet Reson Med 2021;85(5):2828-2841.
11. Goldfarb JW, Craft J, Cao JJ. Water–fat separation and parameter mapping in cardiac MRI via deep learning with a convolutional neural network. J Magn Reson Imaging 2019;50(2):655-665.
Figures
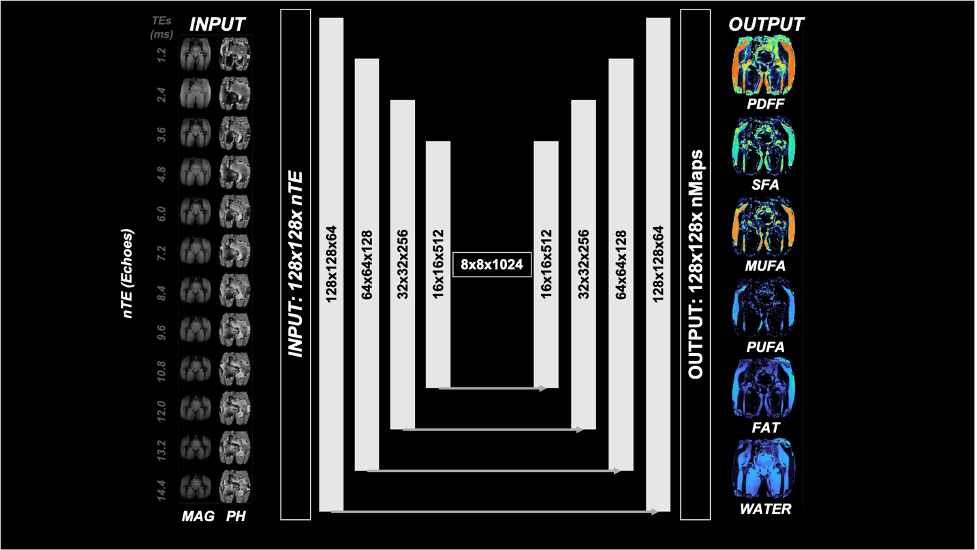
Figure 1: CNN architecture. Images with chosen number of Echoes (nEchoes) are inputted into a UNET with 4 encoding and 4 decoding layers with skip connections to predict the Output.
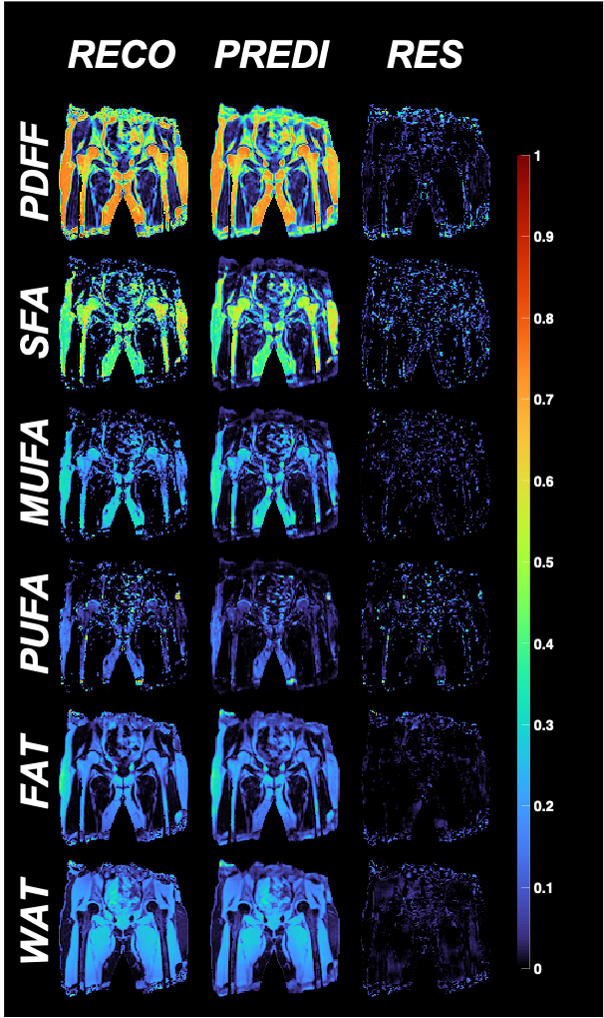
Figure 2: Typical reconstruction (RECO) and associated prediction (PREDI) made by the CNN for 12 echoes acquisition and residuals between the two (RES).
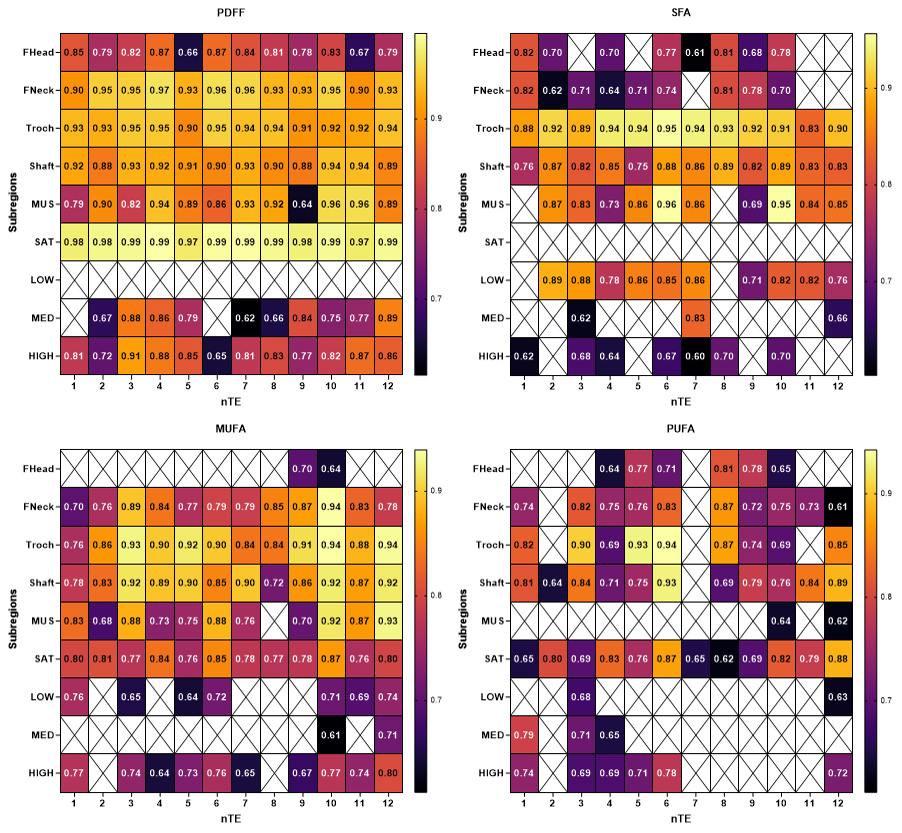
Figure 3: Significant correlations between subregional measurements between reconstructed and predicted maps on an independent dataset for different CNN with different echoes number (nTE) in different subregions (FHEAD: femoral head, FNECK: femoral neck, Shaft: femoral shaft, MUS: thigh muscle, SAT: subcutaneous adipose tissue, LOW, MED, HIGH: regions in image with respectively PDFF<20%, 20-70%, >70%).

Table 1: Structural similarity index for between reconstructed and predicted
DOI: https://doi.org/10.58530/2023/0629