0628
Non-Contrast MRI of Micro-Vascularity of the Feet and Toes1Radiology, University of California, San Diego, La Jolla, CA, United States, 2VA San Diego Healthcare System, San Diego, CA, United States, 3Radiology, Teikyo University, Tokyo, Japan, 4Canon Medical Systems Corp, Otawara, Japan, 5Radiology, Asahi General Hospital, Chiba, Japan, 6Kyoritsu Tobata Hospital, Kitakyusyu, Japan, 7University of California, San Diego, La Jolla, CA, United States
Synopsis
Keywords: MSK, Arterial spin labelling, Bilateral feet perfusion, ASL, Feet and Toes
Non-contrast MR perfusion techniques were developed to assess micro-vascularity of the foot in humans. Using flow-out spin labeling with 3D SSFSE acquisition at multiple Tis, we obtained perfusion signal into distal feet and toes. Signal vs. TI data was fit to determine perfusion metrics including peak height (PH), apparent blood volume (aBV) and apparent blood flow (aBF). Compared to 1-tag, when 4-tag pulses were used PH, aBV, and aBF were significantly greater, suggesting increased signal afforded by the 4-tag pulses. This will be useful for subjects with low blood flow, such as those with peripheral artery disease.Introduction
Non-contrast magnetic resonance (MR) evaluation of blood flow in the foot of diabetics with insufficient renal function is clinically useful for evaluating peripheral artery disease (PAD)1,2. Existing contrast-enhanced MR angiography using gadolinium-based contrast agents has not been successful in the distal foot due to inseparable arteries and veins in images. In addition, it is critical to realize the presence of blood flow at the distal feet and toes, especially in diabetic foot. We introduce novel non-contrast MR techniques for assessing micro-vascularity of the foot in human subjects.Methods
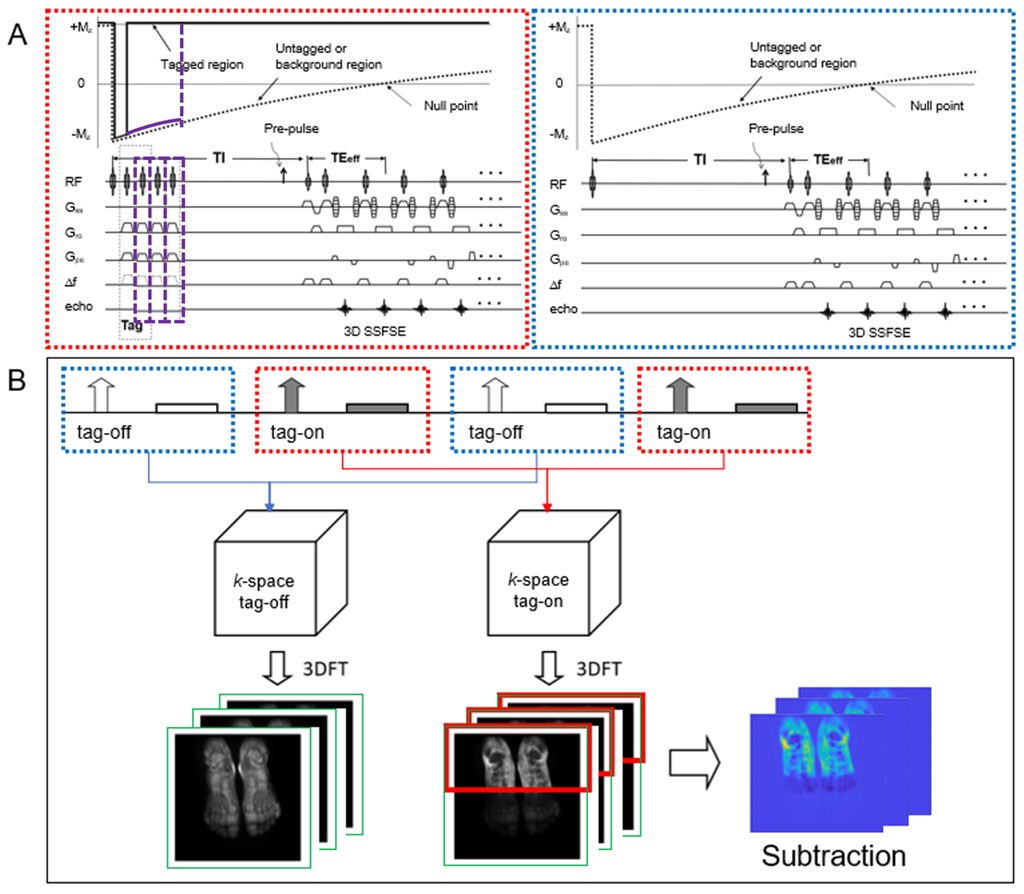
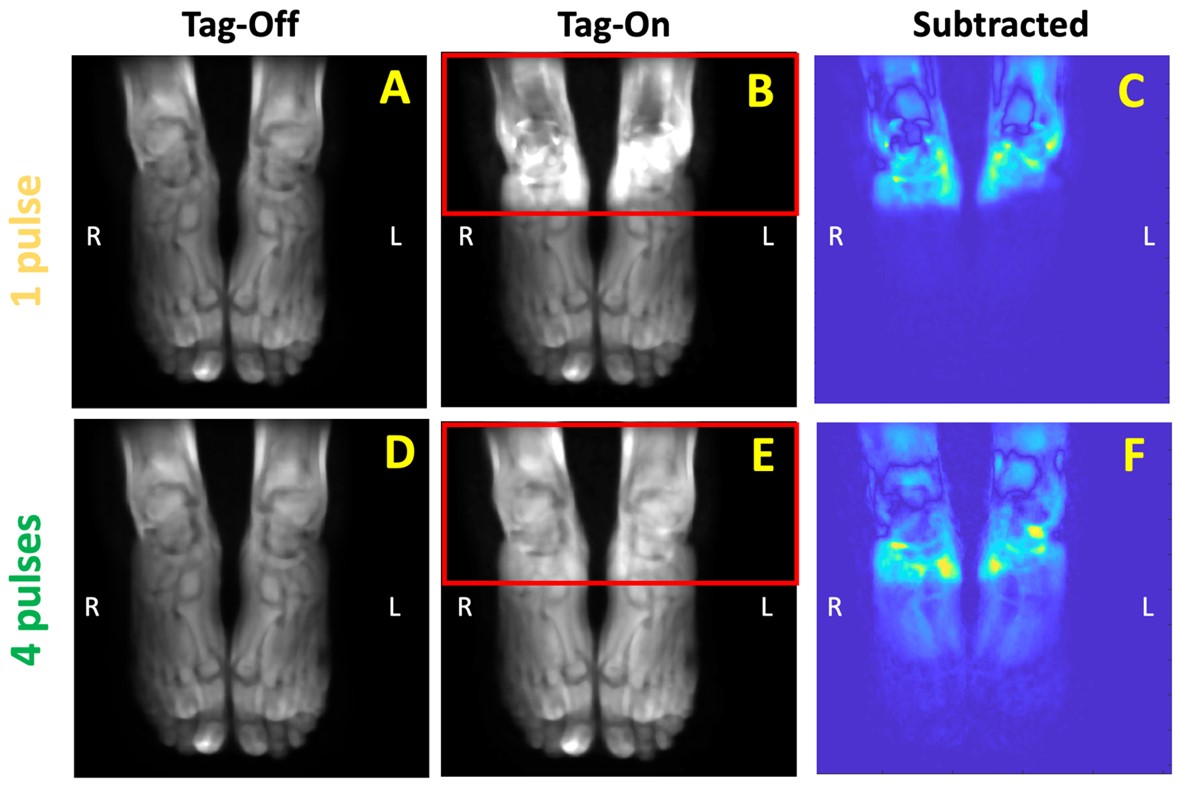
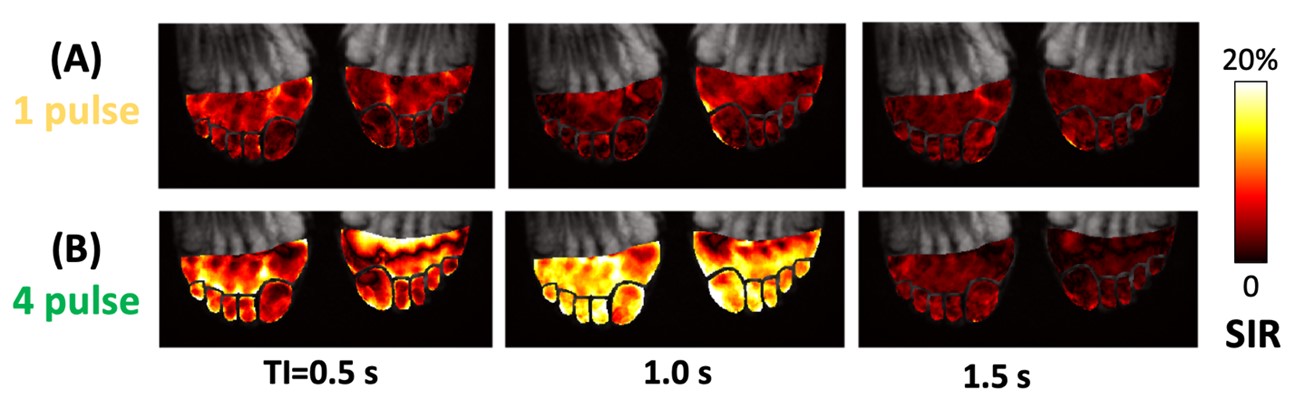
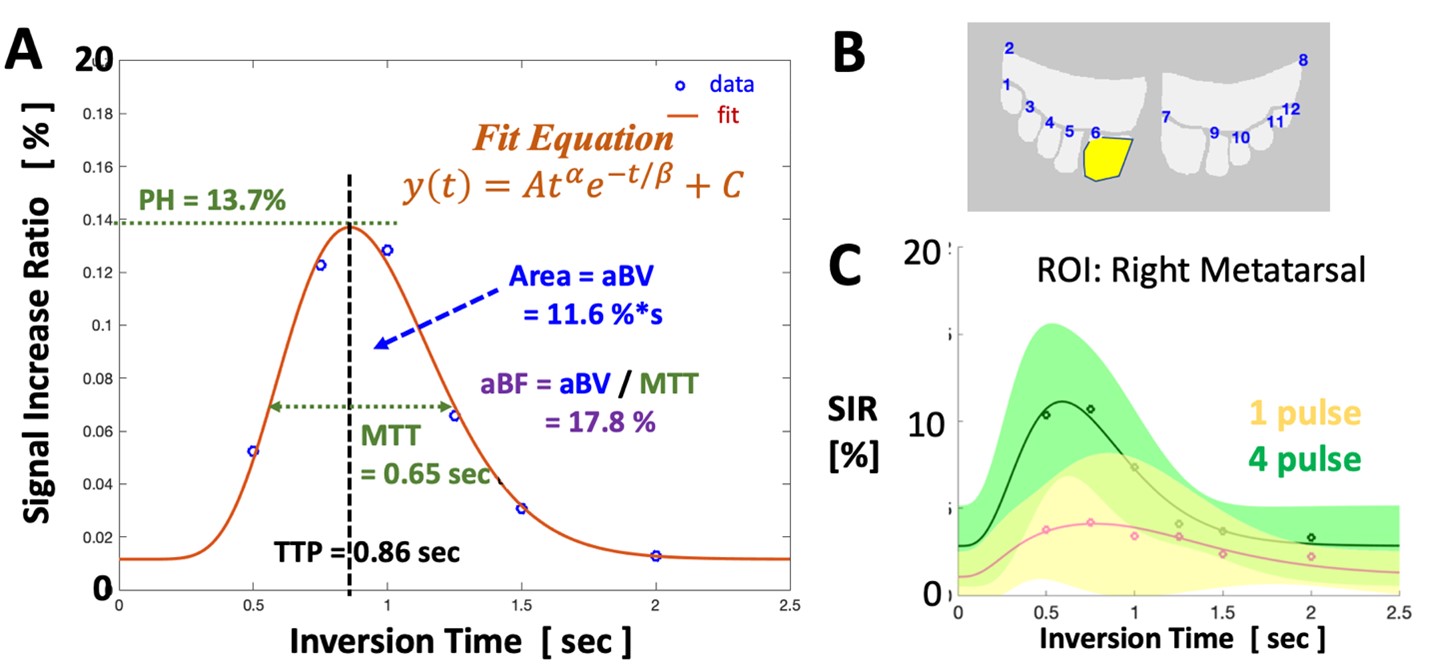
All experiments were performed on a clinical 3T scanner with a 16-ch flex coil. Seven subjects (19 to 72 years old, 6 males and 1 female) were enrolled and bilateral feet were imaged. The flow-out spin labeling technique uses three-dimensional (3D) single shot fast spin echo (SSFSE) or half-Fourier fast spin echo read-out to avoid issues with often-used echo-planar imaging and bSSFP acquisitions that are sensitive to B0 inhomogeneity and motion artifacts3. Figure 1 shows a flow-out sequences of tag-on with 1 or 4-tag pulses (Figure 1, purple lines) and tag-off acquisitions, and Figure 1B shows the subtraction method. For each subject, images of the foot without (Figure 2AD) and with (Figure 2BE) the tag were acquired and subtracted (Figure 2CF), using 1- (Figure 2ABC) and 4-tag pulses (Figure 2DEF). The tag-on pulse consists of a selective IR pulse which inverts the ankle and upper foot regions (Figure 2BE red boxes) to -Mz (Figure 1 Tag-On). The tag-off acquisition is performed without an IR pulse. The acquisition protocol for 3D SSFSE was: TR=4 RR intervals, TE=80 ms, oblique axial, FOV=280x340 mm, matrix size=256x320 (interpolated to 512x640), and slice thickness=2.8 mm (interpolated to 1.4 mm). To determine time-series perfusion signal, the acquisition was repeated at varying inversion times (TI) of 0.5, 0.75, 1.0, 1.25, 1.5 and 2.0 sec. To normalize data, the subtraction images were divided by tag-off images to determine Signal Increase Ratio (SIR) at each voxel (Figure 3) and averaged at 12 regions of interest in the distal foot and the toes (Figure 4B). SIR versus TI data were fit using a gamma variate function4 (Figure 4A) to determine perfusion metrics of peak height (PH), time to peak (TTP), mean transit time (MTT), apparent blood volume (aBV) and apparent blood flow (aBF) in the distal foot and individual toes, as well as voxel-wise colormaps (Figure 5). Using analysis of variance, effects of tag pulse and ROI on the mean perfusion metrics were assessed.Results and Discussion
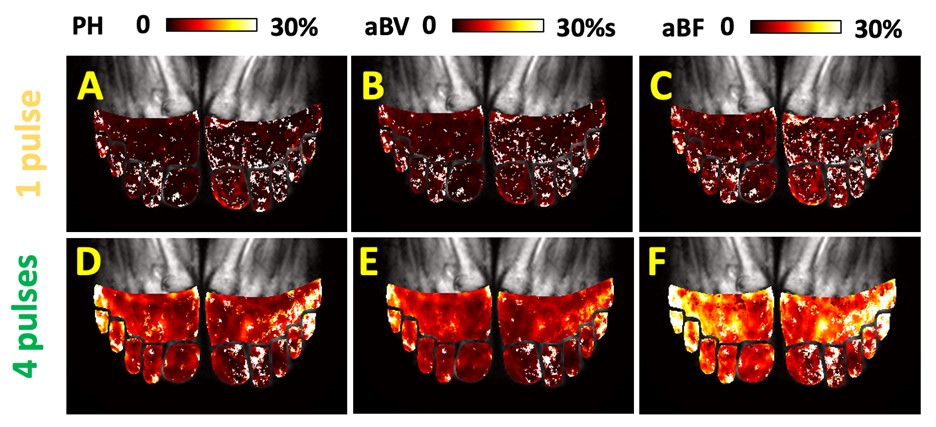
Using MR perfusion techniques, SIR versus TI data showed well-defined leading and trailing edges, with a peak near TI of 0.75 sec and subsiding quickly to near zero by TI of 2 sec. This was more apparent when 4 tag pulses were used compared to 1 tag pulse (Figure 4C). In our normal subjects imaged with 1-tag pulse, the overall (across 12 ROIs and 7 subjects) mean ± standard deviation values of PH, TTP, MTT, aBV, and aBF were 6.5±4.5%, 0.65±0.26 sec, 0.60±0.23 sec, 8.4±4.6 %∙sec, and 15.0±9.0 %, respectively. When imaged with 4 tag pulse sequence, we found a significantly greater values in PH (13.4±7.3 %, p<0.00001), TTP (0.60±0.25 sec, p=0.005), aBV (13.7±6.3 %∙sec, p<0.00001), and aBF (25.4±16.1 %, p=0.008). Voxel-wise color map (Figure 5) also showed greater and less-noisy perfusion metric data for 4-pulse acquisition.Conclusion
Feasibility of MR perfusion imaging of the distal foot was shown, and advantages of the 4-tag pulse technique was demonstrated with greater SIR and perfusion metrics, compared to 1 tag pulse technique. This will likely benefit those with low perfusion due to aging or diseases such as PAD and diabetic foot.Acknowledgements
This research study was supported in parts by the National Institute of Heart, Lung, Blood Institute R01HL154092 and Canon Medical grant (35938) to Dr. Miyazaki and by National Institute of Arthritis and Musculoskeletal and Skin Diseases P30 AR073761 in support of Dr. Bae.
Authors thank Mr. Yurian Falls of Canon Medical Systems for his technical support.
References
1. WHO Media Center (http://www.who.int/mediacentre/factsheets/fs317/en/).
2. Selvin E, Erlinger TP. Prevalence of and risk factors for peripheral arterial disease in the United States: results from the National Health and Nutrition Examination Survey, 1999-2000. Circulation 2004; 110:738-743.
3. Miyazaki M, Yamamoto A, Malis V, et al., Time-resolved noncontrast magnetic resonance perfusion imaging of paraspinal muscle. J Magn Reson Imaging 2022; DOI: 10.1002/jmri.28123
4. Chan AA, Nelson AJ. Simplified gamma-variate fitting of perfusion curves. IEEE International Symposium on Biomedical Imaging: Nano to Macro 2004; 2:1067-1070.
Figures