0627
Evaluation of an accelerated Deep Learning-reconstructed T2 mapping technique through knee cartilage regional analysis using DOSMA framework1GE Healthcare, Munich, Germany, 2LAIMBIO, Rey Juan Carlos University, Madrid, Spain, 3GE Healthcare, New York, NY, United States, 4GE Healthcare, San Ramon, CA, United States, 5University of California, San Francisco, San Francisco, CA, United States, 6Radiology, Stanford University, Stanford, CA, United States, 7Electrical Engineering, Stanford University, Stanford, CA, United States, 8Clinica CEMTRO, Madrid, Spain
Synopsis
Keywords: Cartilage, Quantitative Imaging
The clinical translation of MRI Quantitative Imaging is still hampered by the high variability and suboptimal reproducibility of the cartilage biomarkers. The purpose of this work is to validate the consistency of a novel accelerated DL reconstructed T2 mapping technique compared to conventional reconstructed acquisition, on knee patient population. To access both femoral cartilage T2 maps, we propose a semi-automatic workflow through AI-based cartilage segmentation and regional quantification using DOSMA framework. Relaxometry analysis showed no difference between both T2 mapping techniques, implying a great step into an extensive clinical adoption.
Introduction
Quantitative relaxometry biomarkers, such as T2, can potentially be useful for non-invasive early diagnosis of degenerative disease of the knee joint, including osteoarthritis1-4, and for monitoring response to cartilage repair treatments5,6. However, the high variability and suboptimal reproducibility, besides long examination times, is hindering its clinical translation7.A novel deep learning (DL) reconstructed T2 mapping technique was recently proposed to shorten acquisition times while providing robust quantitative cartilage information8.
Tedious manual post-processing is usually required to access the T2 map data. Thus, an efficient automatic pipeline could establish a standardized practice for extracting imaging biomarkers9,10.
The purpose of this work is to further evaluate the performance of the novel DL T2 mapping technique8 on a larger population, by proposing a semi-automatic pipeline to access the knee relaxometry data.
Data acquisition methods
Under an IRB-approved study, 12 patients were scanned on a 3T SIGNA™ Architect (GE Healthcare, Waukesha, WI, USA) scanner with a 18-Ch Tx/Rx knee coil. Adding to the routine knee clinical protocol: Fat-suppressed 3D FSE CUBE sequence, (TE/TR=60/1500ms, FOV=16cm, 0.3125x0.3125x0.6mm, sagittal view, tacq=5min) and two multi-echo FSE sequences (CartiGram (GE Healthcare, Waukesha, WI, USA)) with no acceleration and conventional reconstruction, versus ARC=3 and DL reconstruction8. Only some slices from one condyle were acquired on both sequences, to reduce conventional Cartigram scan time (TE/TR=6.8-54.4(ẟTE=6.8)/1200ms, FOV=16cm, 0.3125x0.3125x3mm, sagittal view, tacq=5:10 vs 2:40min (NPW factor=1.4)).Data analysis methods
For this study, we proposed a python-based pipeline utilizing and adapting the Deep Open-Source Medical Analysis (DOSMA) framework11 (Figure 1).A DL Knee Segmentation tool was used to automatically segment the cartilage from CUBE12,13 volume on a binary mask with a different label for each extracted cartilaginous compartment, that was given to the pipeline as an additional input.
CUBE volumes were then rotated, translated and isotropically scaled through three dimensions (3D rigid versor transform)10 so that they could be aligned with the first echo of Cartigram sequences. CUBE was set to be the “moving” image due to its higher and more isotropic resolution as compared with the “fixed” T2 mapping sequences. Registration parameters were refined and validated by fusing the CUBE and femoral label over the Cartigram datasets and checking the accuracy of the cartilage alignment. Further manual refinement of the parameters was needed on some cases.
Since we were interested in the femoral cartilage (FC) from the sagittal Cartigram scans, we extracted only the femoral label from the binary mask and applied the resulting transformation, so both CUBE and FC were downsampled to Cartigram space. Registration across echoes in Cartigram datasets was unnecessary as the echo images were acquired as a single interleaved acquisition, so aligned by nature. All the registration/transformation operations were done using Elastix14 and Transformix14 libraries supported by DOSMA.
For the remaining tasks, we made use of the FC tissue supported by DOSMA along with its methods for analysis and visualization. T2 mono-exponential fitting was performed for FC region, projecting the resulting T2 maps onto a 2D space (unrolled view)15. Parametric analysis with subregion division was performed automatically, FC was sub-divided into 3 layers (total, deep and superficial) and 6 sub-regions (anterior/central/posterior for the medial/lateral sides) (Figure 2).
We used the proposed pipeline to estimate T2 maps from both Cartigram acquisitions and compare the T2 values (total layer) for each region in the FC (anterior, central, and posterior), averaging the medial and lateral values (Figure 3).
Percentage errors between both T2 map estimations were evaluated considering conventional reconstructed Cartigram as the reference technique. We also conducted a paired t-test to compare both techniques. Bias and limits of agreement values were calculated with the methods of Bland and Altman (GraphPad Prism version 7, California, USA).
Results & discussion
The average time to run the whole relaxometry analysis was 4min, including registrations.DL reconstruction allowed to get denoised, and therefore minimized standard deviation, T2 maps almost identical to non-accelerated ones. Mean T2 error of DL T2 mapping was 1.25% in the posterior region, 3.92% in the central and 2.45% in the anterior; all within the accepted intra-subject variability range7, 4%–5%.
Paired t-test showed no significant statistical difference between the T2 values obtained using the two Cartigram acquisitions (p>>0.05). Based on the Bland-Altman analysis (Figure 4) no differences in bias were noted for the T2 values between both techniques.
The workflow was proposed for unilateral FC but could be easily extended to support analysis for both condyles and different tissues available in DOSMA. Having proved the accuracy of the DL T2 mapping acquisition, a bilateral sagittal acquisition could be done in the same scan time as the unilateral conventional Cartigram (Figure 5). By adding more registration steps, it could be used for longitudinal follow-up assessment and large cross-sectional studies.
Conclusion
Our findings demonstrate that thanks to DL reconstruction, accelerated T2 mapping technique could replace the conventional longer acquisition, providing consistent quantitative cartilage information.The proposed semi-automatic pipeline implies a great step into the inclusion of DL T2 mapping as a cartilage health biomarker in the clinical setting, that would allow an accurate understanding of cartilage status and behavior from both morphological and functional standpoints.
More in-vivo data would be needed to further optimize the registration performance and validate the accuracy of the pipeline.
Acknowledgements
No acknowledgement found.References
1. Li X, Benjamin Ma C, Link TM, et al. In vivo T1rho and T2 mapping of articular cartilage in osteoarthritis of the knee using 3 T MRI. Osteoarthritis Cartilage 2007;15(7):789–797.
2. MacKay JW, Low SBL, Smith TO, Toms AP, McCaskie AW, Gilbert FJ. Systematic review and meta-analysis of the reliability and discriminative validity of cartilage compositional MRI in knee osteoarthritis. Osteoarthritis Cartilage 2018;26(9):1140–1152.
3. Guermazi, A., Alizai, H., Crema, M. D., Trattnig, S., Regatte, R. R., & Roemer, F. W. Compositional MRI techniques for evaluation of cartilage degeneration in osteoarthritis. Osteoarthritis and cartilage 2015; 23(10): 1639–1653.
4. Liebl H, Joseph G, Nevitt MC, et al. Early T2 changes predict onset of radiographic knee osteoarthritis: data from the osteoarthritis initiative. Ann Rheum Dis 2015;74(7):1353–1359
5. heologis AA, Schairer WW, Carballido-Gamio J, Majumdar S, Li X, Ma CB. Longitudinal analysis of T1r and T2 quantitative MRI of knee cartilage laminar organization following microfracture surgery. Knee 2012;19(5): 652–657.
6. Welsch GH, Mamisch TC, Domayer SE, et al. Cartilage T2 assessment at 3-T MR imaging: in vivo differentiation of normal hyaline cartilage from reparative tissue after two cartilage repair procedures -- initial experience. Radiology 2008;247(1):154–161.
7. Chalian M, Li X, Guermazi A et al. The QIBA Profile for MRI-based Compositional Imaging of Knee Cartilage. Radiology. 2021;301(2):423-432.
8. Carretero, L., Fung, M. et al. Quantitative & qualitative evaluation of accelerated T2 mapping technique using Deep Learning reconstruction in knee cartilage. ISMRM 31st Annual Meeting & Exhibition, London, England, May 2022. Abstract 6990.
9. Pedoia, V. and Majumdar, S. Translation of morphological and functional musculoskeletal imaging. J. Orthop. Res. 2019; 37: 23-34.
10. Urish KL, Williams AA, Durkin JR, Chu CR. Registration of Magnetic Resonance Image Series for Knee Articular Cartilage Analysis: Data from the Osteoarthritis Initiative. Cartilage. 2013;4(1):20-27.
11. Desai Arjun, Barbieri Marco, Mazzoli Valentina, Rubin Elka, Black Marianne, Watkins Lauren, Gold Garry, Hargreaves Brian, Chaudhari Akshay, DOSMA: A deep-learning,open-source framework for musculoskeletal MRI analysis, in: ISMRM 27th Annual Meeting and Exibition, Montreal, Canada, May 2019. Abstract 1135
12. Carretero, L., García-Polo, P., Kaushik, S. Fung, M. et al. Assessment of the potential of a Deep Learning Knee Segmentation and Anomaly Detection Tool in the clinical routine. ISMRM & SMRT Annual Meeting & Exhibition, Online, May 2021. Abstract 780.
13. Astuto, B., Flament, I., K Namiri, N., Shah, R., Bharadwaj, U., M Link, T., D Bucknor, M., Pedoia, V., & Majumdar, S. Automatic Deep Learning-assisted Detection and Grading of Abnormalities in Knee MRI Studies. Radiology. Artificial intelligence, 2021; 3(3), e200165.
14. Klein S, Staring M, Murphy K, Viergever MA, Pluim JP. Elastix: a toolbox for intensity-based medical image registration. IEEE transactions on medical imaging 2010;29(1):196-205.
15. Monu UD, Jordan CD, Samuelson BL, Hargreaves BA, Gold GE, McWalter EJ.Cluster analysis of quantitative MRI T2 and T1ρ relaxation times of cartilage identifies differences between healthy and ACL-injured individuals at 3T." Osteoarthritis and cartilage 2017;25(4):513-520.Figures
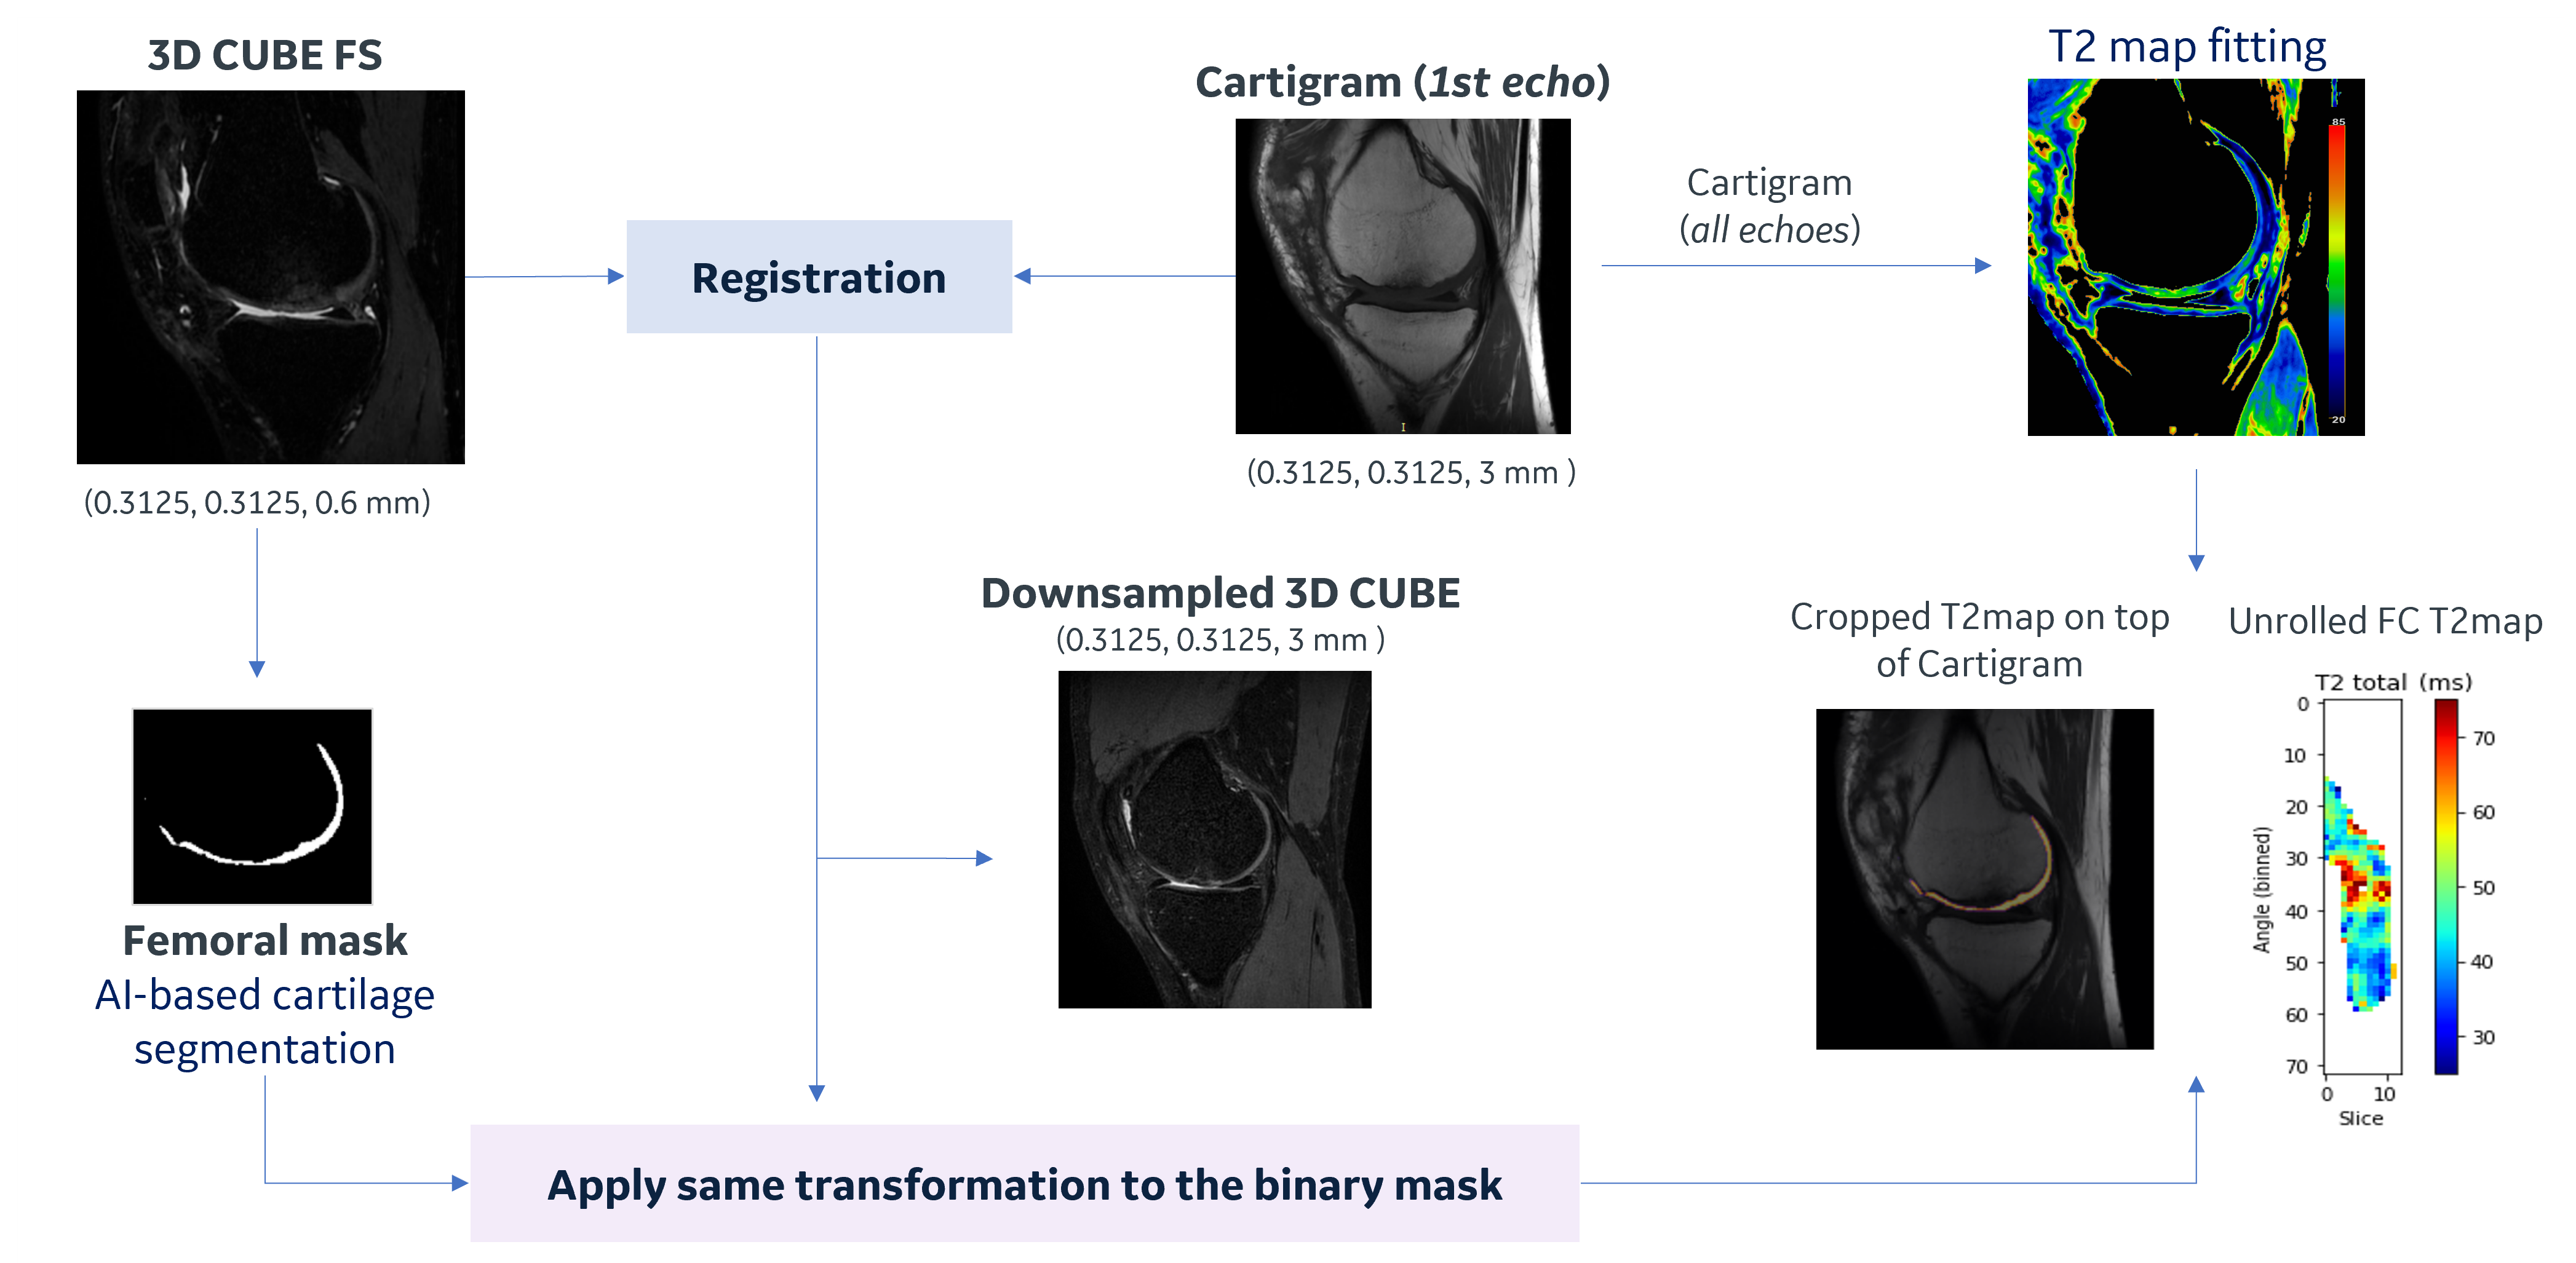
Figure 1. Proposed workflow flowchart. Cartilage segmentation was performed on CUBE scans using an external AI-based model. CUBE, conv. and DL Cartigram were sequentially scanned keeping the same FOV, this likely explains no shearing was needed during registration and a similarity transformation was enough to align the images. Mattes’s Mutual Information metric was used for this multimodality registration. When applying the resulting transformation to the femoral mask, the final BSpline interpolation order was set to 0 to keep the deformed segmentation as a binary label image.
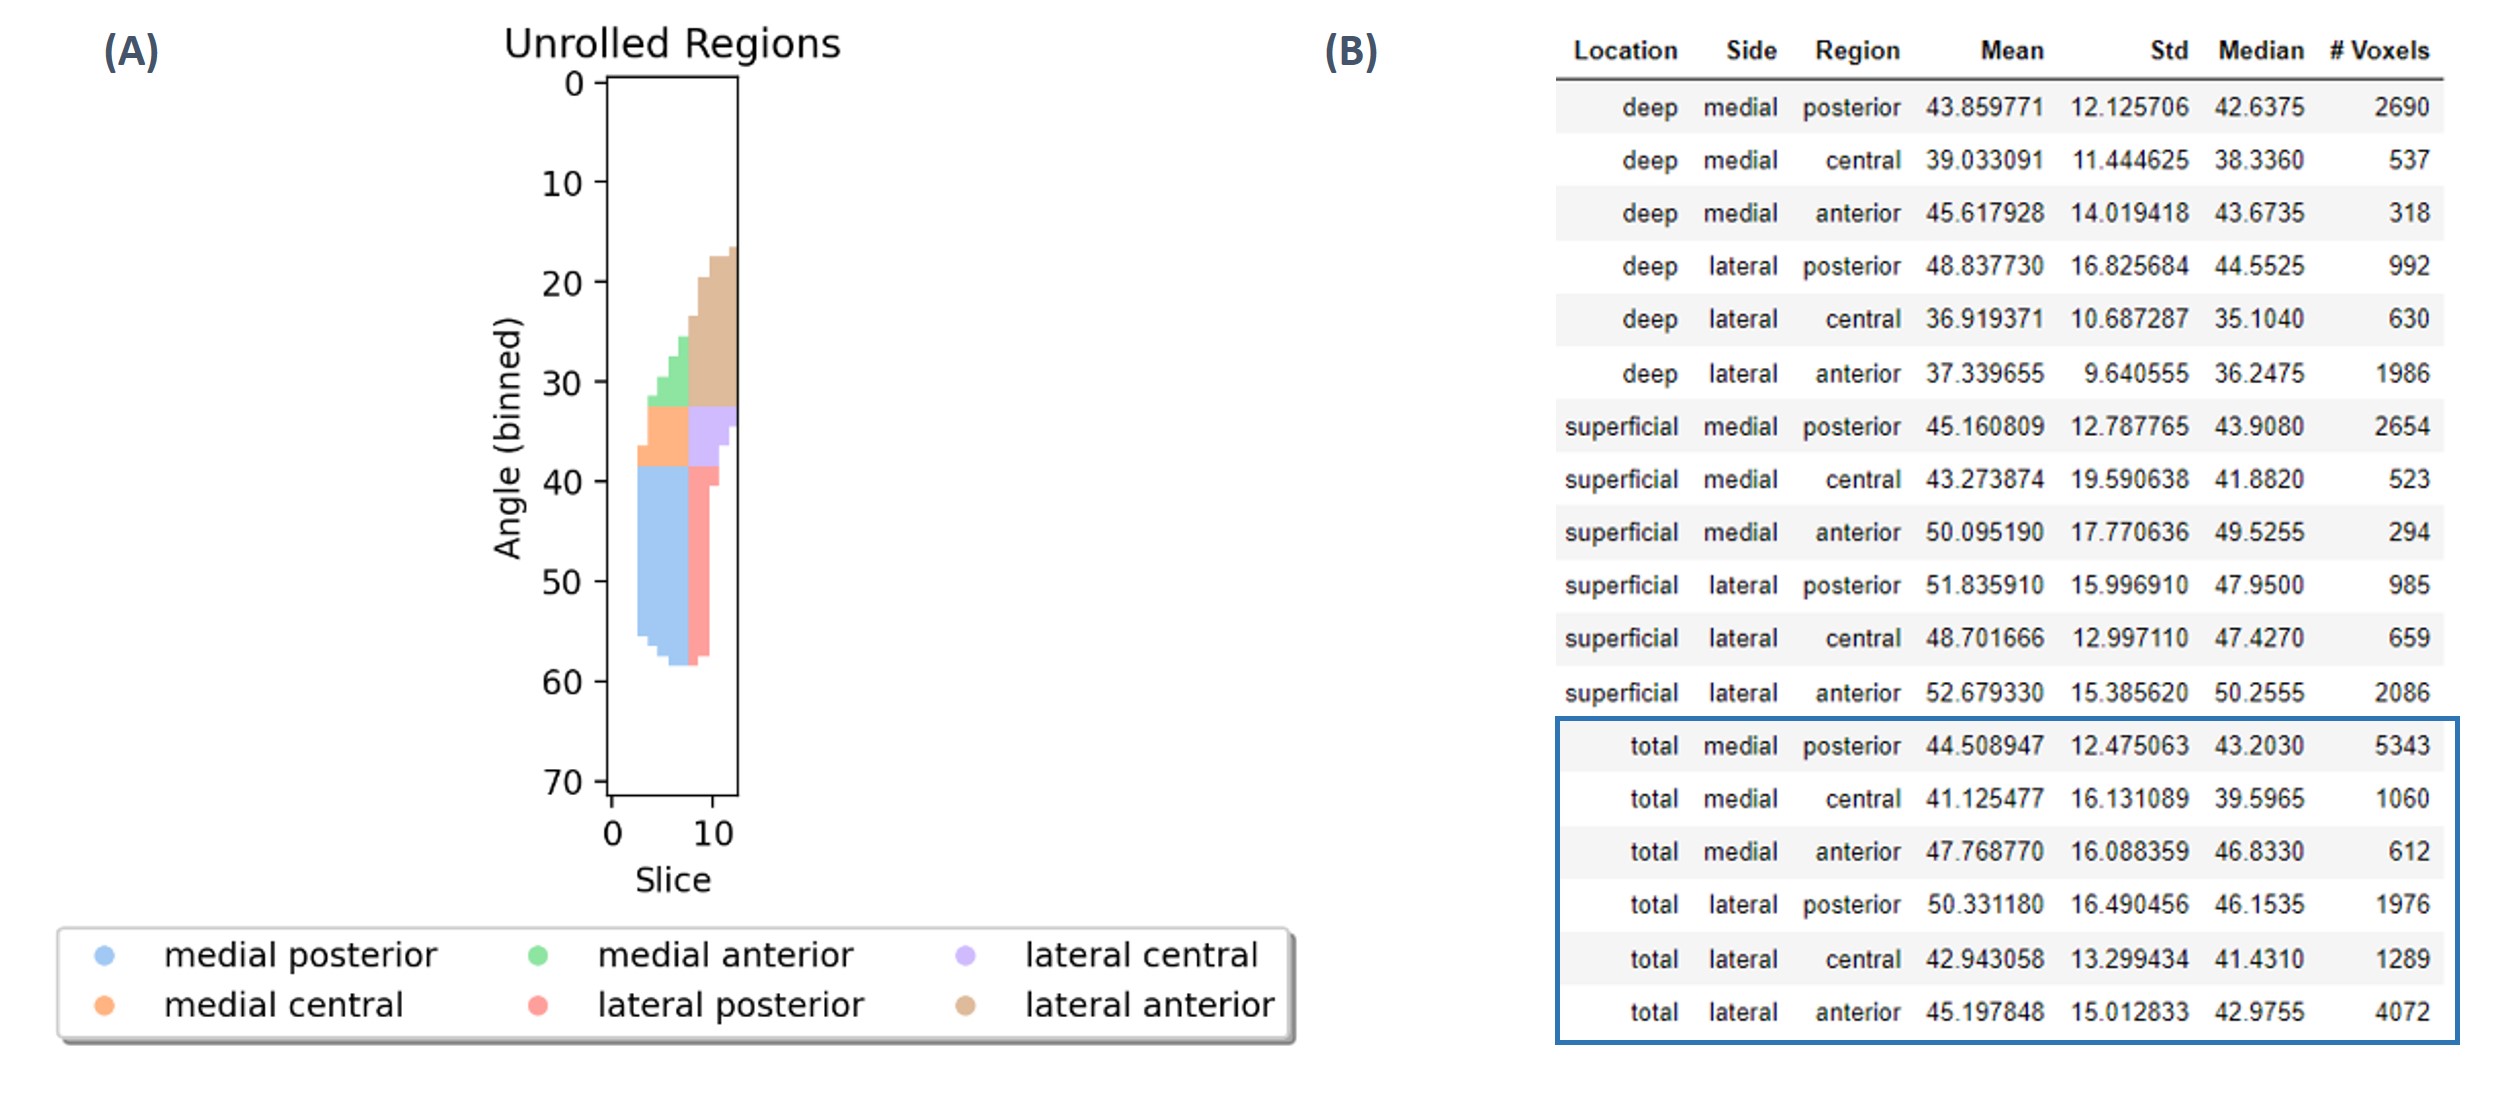
Figure 2. DOSMA regional assessment (A) Automatic subregion division. The laterality of the T2 mapping technique must be specified for this visualization feature. (B) T2 regional analysis. Only total layer was considered for the statistical analysis.
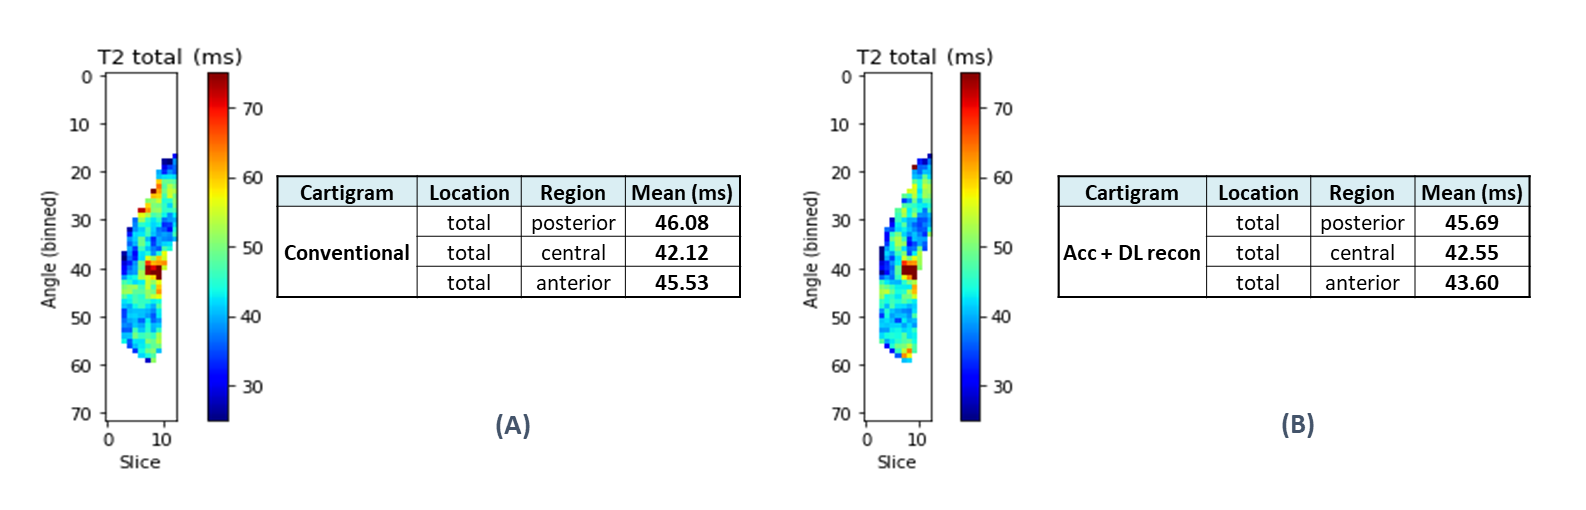
Figure 3. Visual comparison of the unrolled T2 maps (A) Conventional vs (B) DL reconstructed Cartigram acquisitions. Since we were assessing just one condyle, medial and lateral estimated T2 values were averaged for each region accounting for the number of voxels measured at each side.
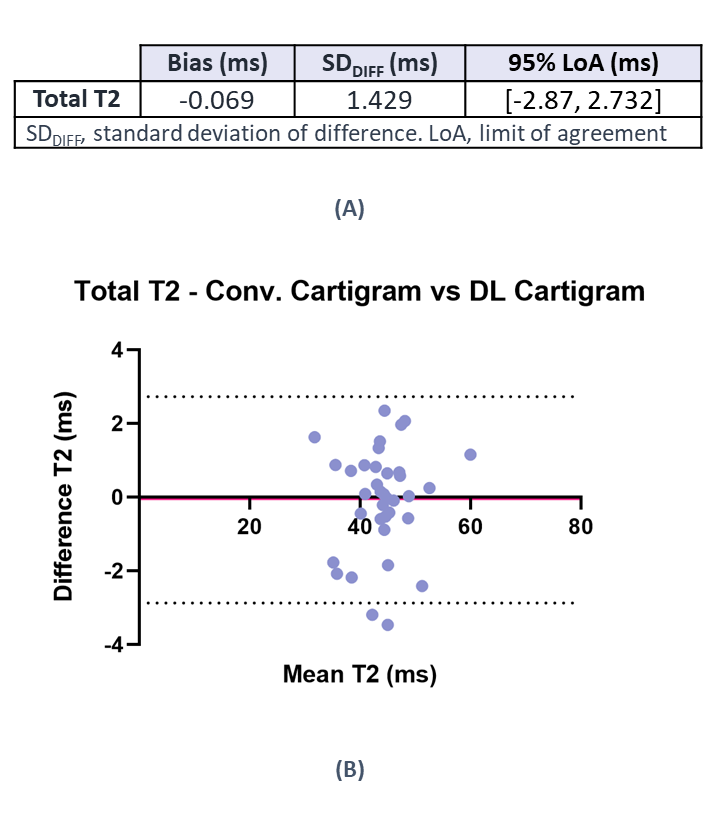
Figure 4. (A) Bland-Altman Analysis results (B) Bland-Altman plot of differences between conventional Cartigram and DL recon Cartigram for total T2 estimated at posterior, central and anterior condyle regions. The solid line represents the mean difference (bias), and the dashed line indicate the 95% limits of agreement. It is expected that the limits include 95% of differences between the 2 acquisition methods. Each of the three regions for each subject is represented by an individual point.
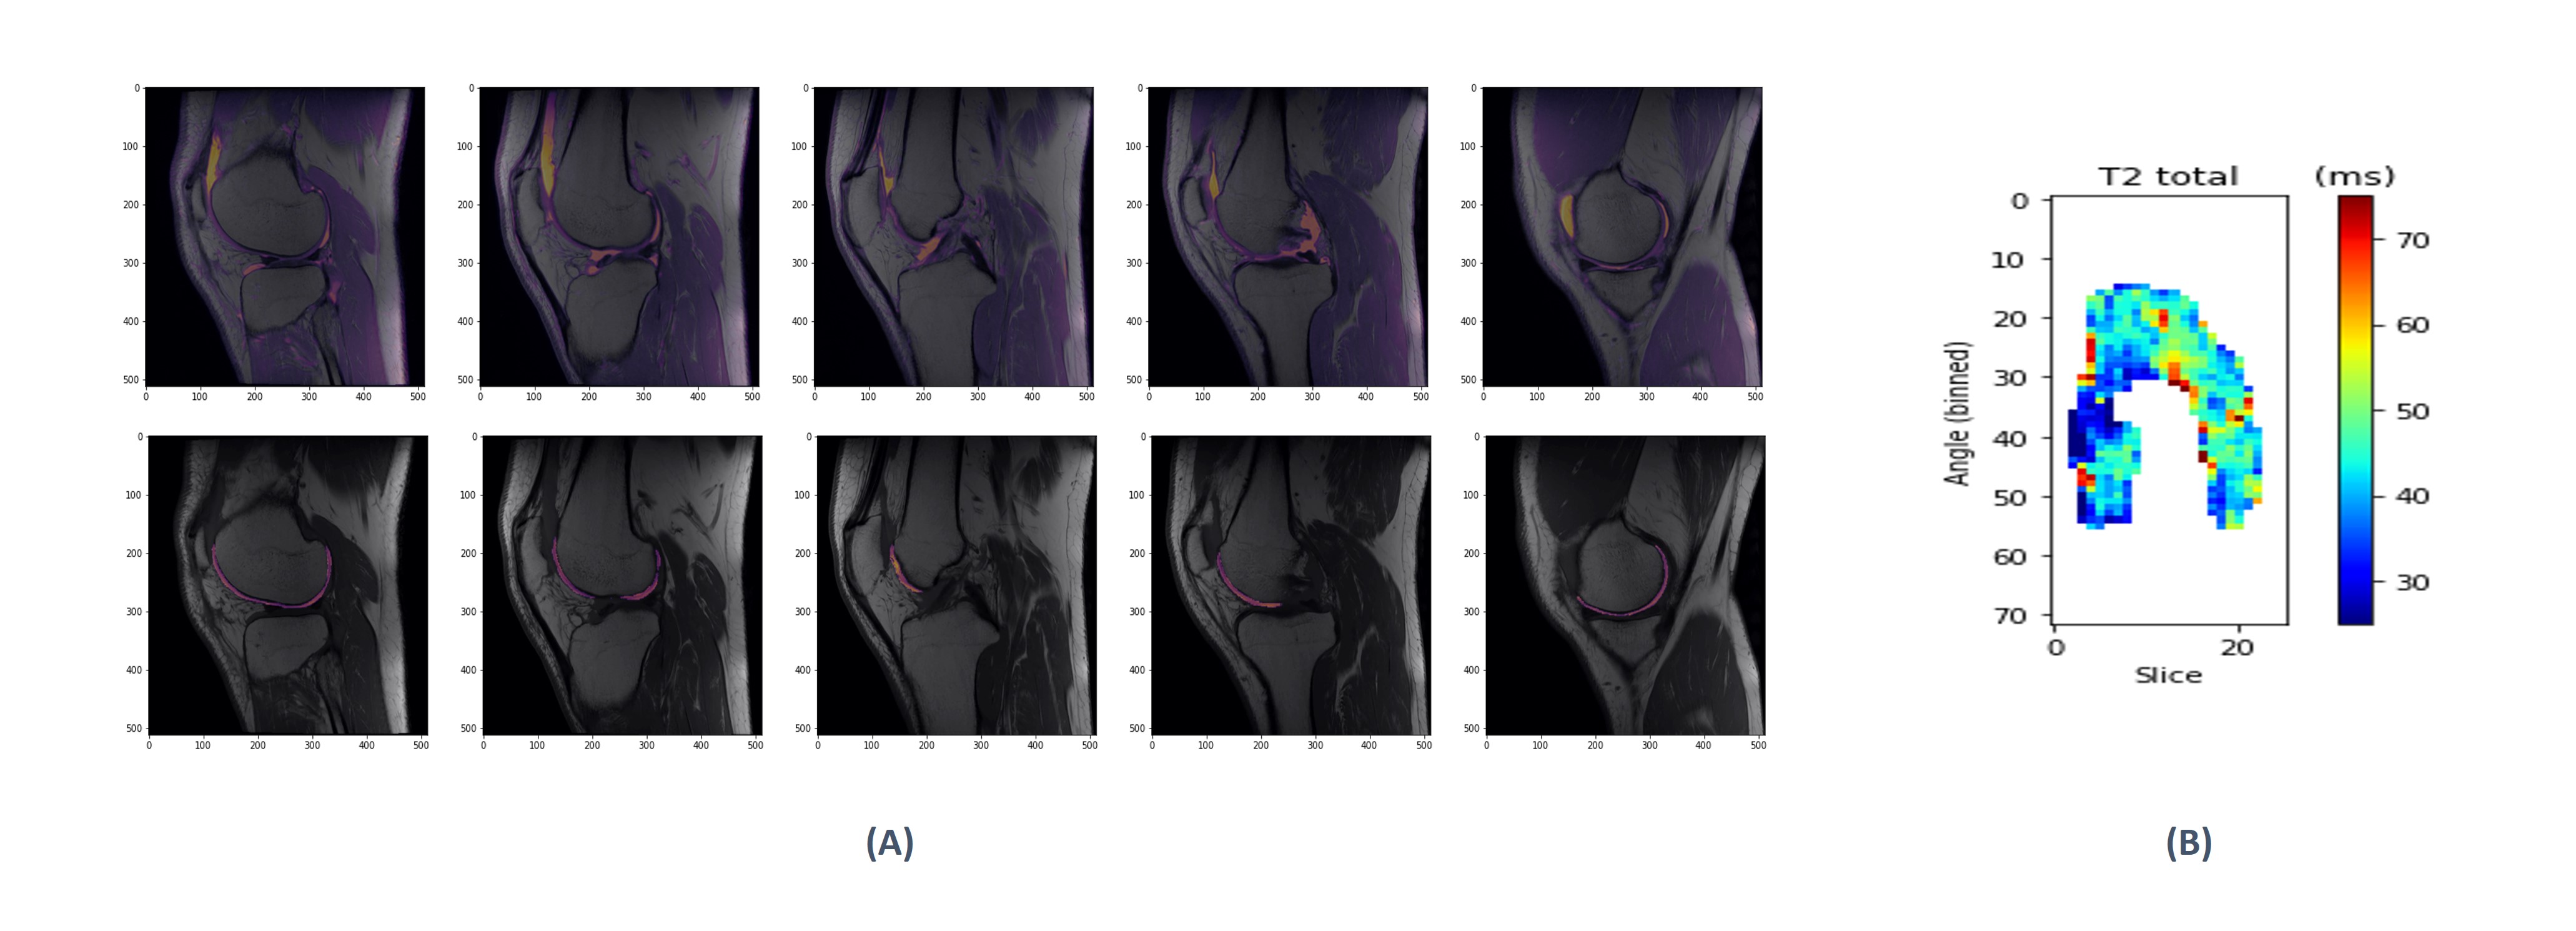
Figure 5. Example of bilateral DL Cartigram analysis (A) Registered CUBE (top row) and cropped T2map from FC (bottom row) fused on DL Cartigram. (B) Unrolled T2 map from the whole FC.