0624
High-resolution and rapidly-acquired T2 mapping using deep-learning reconstruction and parallel imaging in evaluation of knee cartilage
Weiyin Vivian Liu1, Xiaxia Wu2, and Yunfei Zha2
1GE Healthcare, Beijing, China, 2Department of Radiology, Renmin Hospital of Wuhan University, Wuhan, China
1GE Healthcare, Beijing, China, 2Department of Radiology, Renmin Hospital of Wuhan University, Wuhan, China
Synopsis
Keywords: MSK, Quantitative Imaging
T2 mapping reflects biochemical composition of tissues such as cartilage, tendon, ligament, meniscus without requirement for a contrast injection or special MRI imaging hardware, and there are numerous available techniques for post-processing of T2 images. However, scan time and signal-to-noise ratio are critical factors in clinical implementation. With the development of parallel imaging in combination of deep-learning based reconstruction algorithm, high-resolution and reproducible T2 mapping was potentially achieved to identify cartilage injury or degeneration in spite that T2 relaxation time cannot directly refer to previous studies but showed high consistency with the same acceleration factor for T2 mapping.Introduction
Several researchers have proposed a variety of deep learning (DL) based reconstruction methods that rely heavily on sampling patterns. DL reconstruction performs poorly on uniform sampling patterns, but sparsity and sharable information can improve DL reconstruction quality. Most convolution-based networks are trained in image domain to minimize Euclidean distance between predicted and ground truth pixels but produces blurry images. [1] Integrating the PI techniques such as k-space-based (i.e., ARC, GRAPPA) into DL-based methods has the potential to improve the reconstruction quality of accelerated MRI scans. A multisection multiecho spin-echo (MESE) sequence is often used to acquire data to estimate quantitative T2 relaxation time but takes long acquisition times, usually between 5 and 10 minutes, hindering the spread of these sequences in the clinical setting. [2] Our study aimed to exam the feasibility of ROI-based T2 relaxation time retrieved on deep-learning (DL) or non-DL T2 mapping with different acceleration factors and the consistency of diagnostic performance.Materials and methods
We prospectively recruited 20 subjects in the hospital from June to September 2022. All subjects underwent the multi-echo spine echo sequence (TE =8.464-67.712 ms with an interval of 3.96 ms, in-plane resolution = 0.3125×0.3125, thickness =3 mm) with acceleration factor of 2 and 3 on 3.0 T MRI (Signa Architect, GE Healthcare) with 18-channel transmitter and receiver coil. Original T2 maps with Auto-calibrating Reconstruction for Cartesian sampling (ARC) of 2 (T2ori-ARC=2), 3 (T2ori-ARC=3) and simultaneously inline DL (commercial product AIRTM Recon DL, GE Healthcare; hereafter abbreviated as ARDL) reconstructed T2 maps (T2ARDL-ARC=2), (T2ARDL-ARC=3) were generated. ROIs of the patellar and femoral cartilages were delineated on the selected slice with the largest cross-section of both cartilages and its upper and lower slices and then averaged by a radiologist with at least 5-year experience in musculoskeletal imaging diagnosis. Outerbridge grading system was also applied to classify included patients with knee osteoarthritis. All data were presented in mean±standard deviation (xˉ±s). The reproducibility of quantitative values between scans were analyzed using the root-mean-square coefficient-of-variation (RMS CV%). Paired sample t-test or Wilcoxon signed test was used for comparison between groups according normality and equality-of-variances respectively examined by Kolmogorov-Smirnov test and Levene's-Test. In addition, receiver operating characteristic curve (ROC) analysis was used to exam the diagnostic performance of T2 mapping on differentiation of patients with Grade 0 and 1 from those with Grade 2, 3 and 4. P<0.05 was considered statistically significant.Results
T2 values of patellar, femoral and tibia cartilage measured on T2 maps with different acceleration factors were shown in Table 1. Representative colored T2 maps with different acceleration factors and w/o ARDL were shown in Figure 1. RSM CV% of each two T2 maps were shown in Table 2. RMS CV% of patellar, femoral and tibial cartilage betweenT2ARDL+ARC=2 and T2ori-ARC=2 varied the least (range: 1.549-5.597) while that of patellar, femoral and tibial cartilage betweenT2ARDL+ARC=2 and T2ARDL+ARC=3 and between T2ARDL+ARC=3 and T2ori-ARC=2 varied the top most (range: 6.645-18.133, 7.103-17.541).T2 values of internal and external patella and femoral cartilage between each two T2 maps showed no difference. However, there were significant differences of T2 values in the internal tibial cartilage between T2Ori-ARC=2 and T2ARDL+ARC=2 (P=0.048), between T2Ori-ARC=2 and T2ARDL+ARC=3 (P=0.047) and between T2ARDL+ARC=2 and T2ARDL+ARC=3 (P=0.045) as well in the external tibial cartilage between T2Ori-ARC=2 and T2Ori-ARC=3 (P=0.042), between T2Ori-ARC=2 and T2ARDL+ARC=2 (P=0.035), between T2Ori-ARC=2 and T2ARDL+ARC=3 (P=0.041) and between T2ARDL+ARC=2 and T2ARDL+ARC=3 (P=0.029). Moreover, ROC curve analysis showed T2ARDL+ARC=2 had the highest diagnostic performance on differentiation of two patient groups with AUC, sensitivity and specificity of 0.883, 1 and 0.667 and the cutoff T2 value was 50.851 ms (Table 3, Figure 2).Discussion and conclusions
ARDL- or non-ARDL based construction T2 values acquired with different acceleration factors for k-space undersampling in phase direction showed significantly different in tibial cartilage and T2ARDL+ARC=2 had slightly higher diagnostic performance on grading KOA than T2ori-ARC=2. The transverse relaxation time T2 measures the decay in phase coherence between spins and is sensitive to the composition and orientation of the matrix components in connective tissues, which affect mechanical properties. [3] We found significant different T2 values of tibia only despite tibial and femoral cartilages with the lowest RMS-CV% between scan protocols, suggesting that T2 values cannot be directly referred to the previous KOA studies, especially tibial cartilage. Relatively higher T2 values in our study may attribute to different grading system used for KOA patients and most patients were diagnosed being grade 2 KOA. The strongly depth-dependent T2 anisotropy in articular cartilage causes the laminar appearance, and thus is used to study the degenerative joint diseases such as osteoarthritis that affect a significant portion of the adult population. High-resolution T2 mapping can better offer information on superficial or deep cartilage degradation to early intervention; however, noise enhancement and increasing residual aliasing often occurs when parallel imaging techniques are used.[4] A joint of deep learning reconstruction and parallel imaging is desired for clinical applications for the pros of being processed right after acquiring sufficient k-space data and would be real-time for diagnosis. [5] Overall, we demonstrated that ARDL-based reconstructed T2 mapping with acceleration factor of 2 had great potential in clinical knee application.Acknowledgements
No acknowledgement found.References
- Ryu K, Lee JH, Nam Y, et al. Accelerated multicontrast reconstruction for synthetic MRI using joint parallel imaging and variable splitting networks. Med Phys. 2021 Jun;48(6):2939-2950. doi: 10.1002/mp.14848.
- Roux M, Hilbert T, Hussami M, et al. MRI T2 Mapping of the Knee Providing Synthetic Morphologic Images: Comparison to Conventional Turbo Spin-Echo MRI. Radiology. 2019 Dec;293(3):620-630. doi: 10.1148/radiol.2019182843.
- Hu J, Zhang Y, Duan C, et al. Feasibility study for evaluating early lumbar facet joint degeneration using axial T1 ρ, T2 , and T2* mapping in cartilage. J Magn Reson Imaging. 2017 Aug;46(2):468-475. doi: 10.1002/jmri.25596.
- Eijgenraam SM, Chaudhari AS, Reijman M,et al. Time-saving opportunities in knee osteoarthritis: T2 mapping and structural imaging of the knee using a single 5-min MRI scan. Eur Radiol. 2020 Apr;30(4):2231-2240. doi: 10.1007/s00330-019-06542-9.
- Chen Y, Fang Z, Hung SC, et al. High-resolution 3D MR Fingerprinting using parallel imaging and deep learning. Neuroimage. 2020 Feb 1;206:116329. doi: 10.1016/j.neuroimage.2019.116329.
Figures
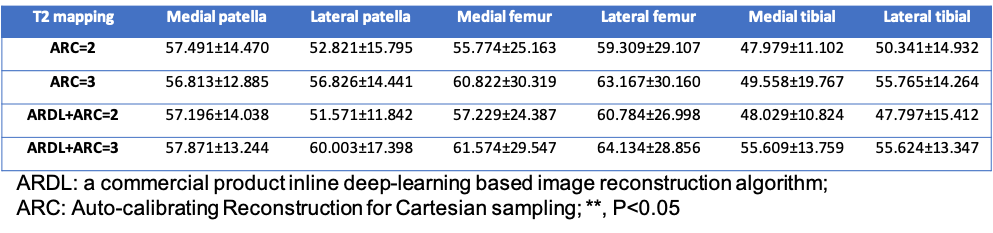
Table 1 T2 values in different cartilage subregions were retrieved on T2 mapping with acceleration factor = 2 and 3 with and without ARDL
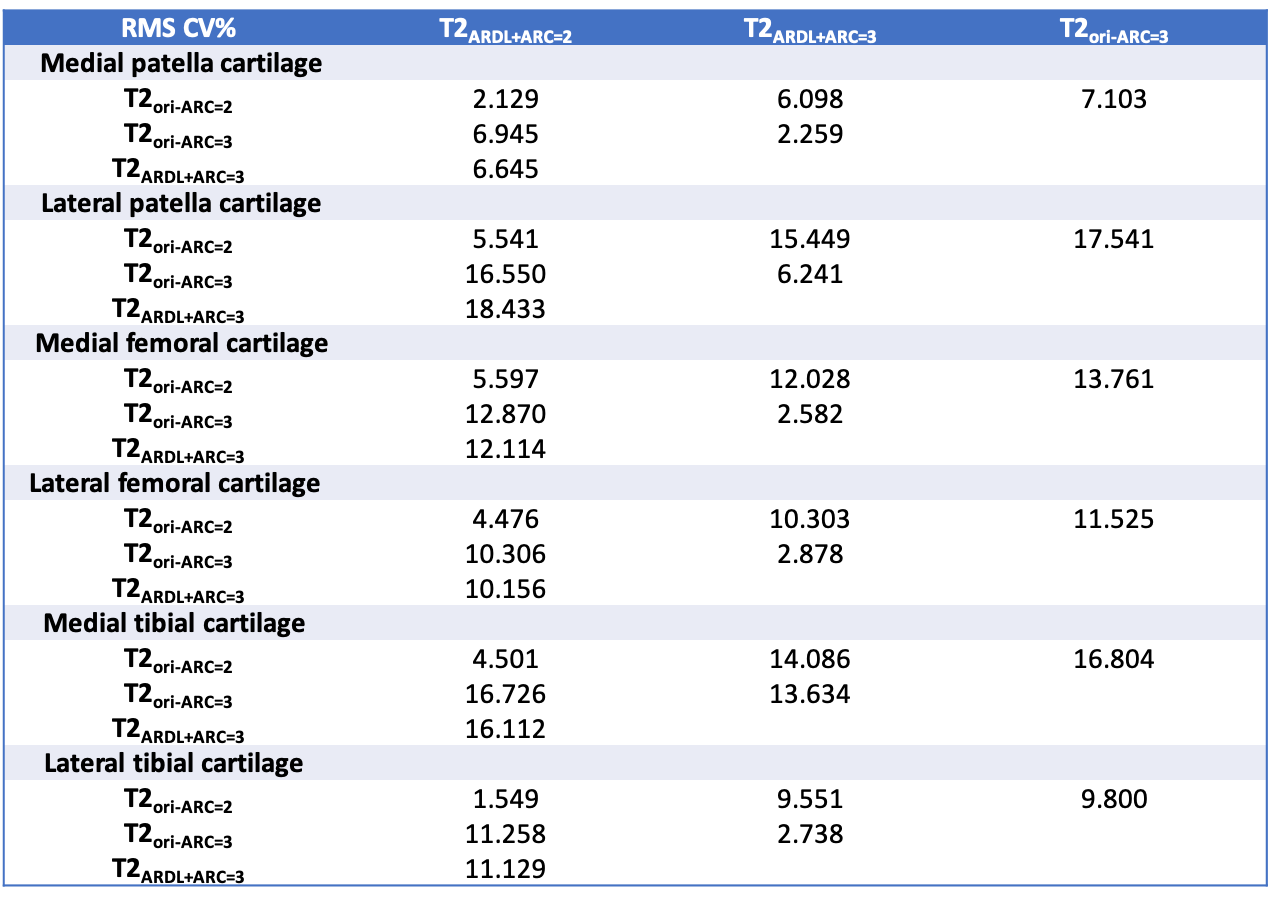
Table 2 RMS CV% of inter-map ROI-based T2 relaxation time
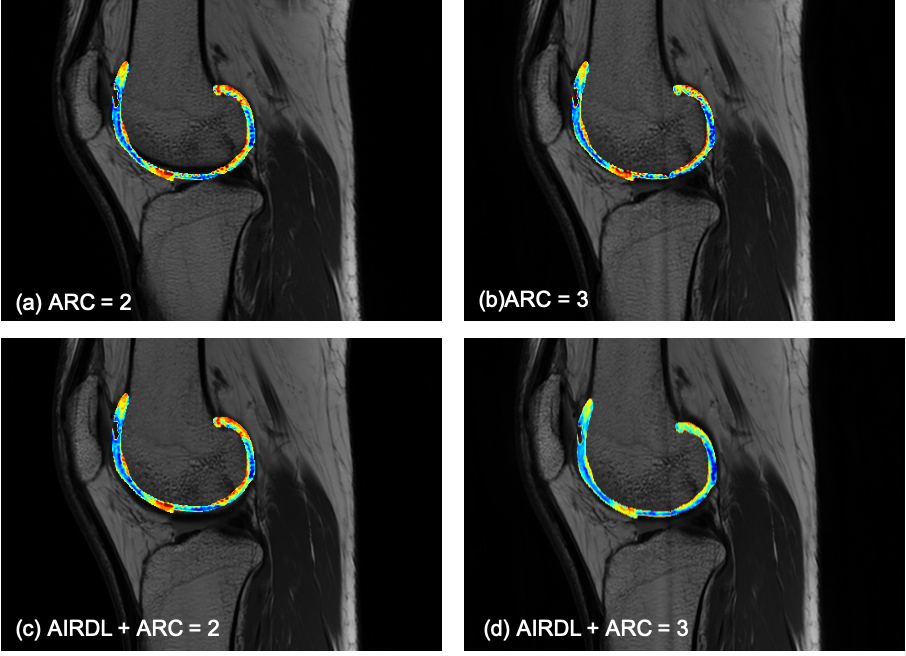
Figure 1 Representative T2 maps with (a) ARC =2, (b) ARC=3, (c) ARDL+ARC=2, and (d) ARDL+ARC=3.
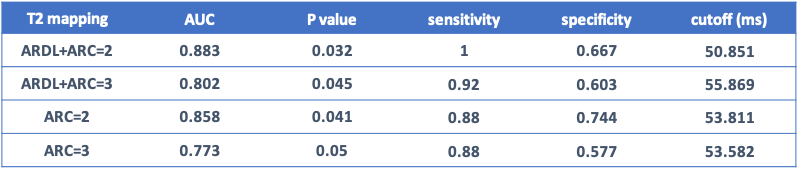
Table 3 Area under the curves, sensitivity, specificity and diagnosis cutoff of T2 values retrieved on T2 mapping with acceleration factor = 2 and 3 as well as with and without ARDL
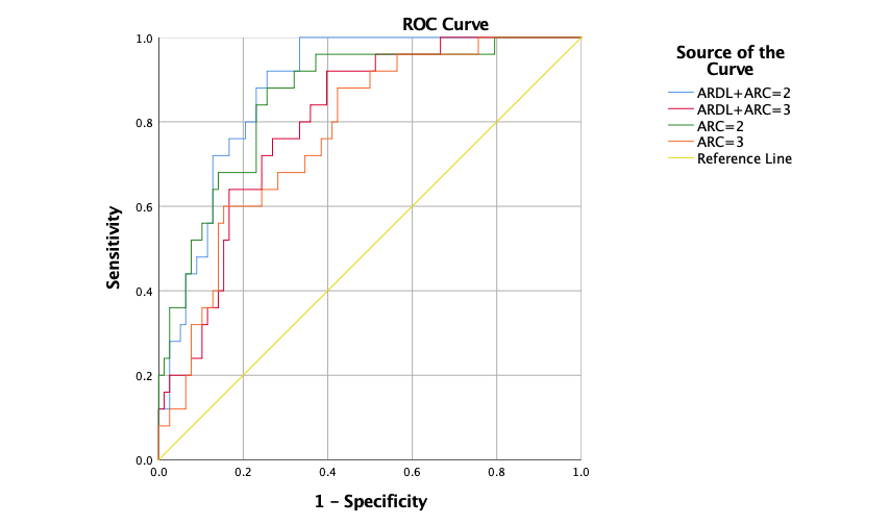
Figure 3 ROC curve analysis for T2 maps with ARC =2 and 3 with and without ARDL. T2ARDL+ARC=2 had the highest diagnostic performance on differentiation of two patient groups with AUC, sensitivity and specificity of 0.883, 1 and 0.667 and the cutoff T2 value was 50.851 ms.
DOI: https://doi.org/10.58530/2023/0624