0622
Depth Dependent Signal from Human Ocular Dominance Columns with VASO fMRI at 7T1Centre for Functional and Metabolic Mapping, Robarts Research Institute, The University of Western Ontario, London, ON, Canada, 2Department of Medical Biophysics, The University of Western Ontario, London, ON, Canada
Synopsis
Keywords: fMRI (task based), High-Field MRI, VASO, laminar fMRI
In this study, we measured the monocular and binocular responses of ocular dominance columns across cortical depths in human V1 using vascular-space-occupancy (VASO) fMRI at 7T. BOLD and VASO images were acquired from five participants using the DZNE sequence with an isotropic resolution of 0.8 mm. Our results indicate that VASO better differentiates the monocular responses between adjacent columns compared to GRE BOLD. In addition, the binocular modulation of the monocular neurons in V1 could possibly be revealed with VASO contrast.Introduction
The neurons located in the striate cortex preferentially respond to the input from one eye or another, forming a stripy pattern (columns) called the ocular dominance columns (ODCs) 1. These structures have been imaged previously in-vivo using the gradient-echo (GRE) and spin-echo blood-oxygenation-level-dependent (BOLD) contrast at different magnetic fields and spatial resolutions 2–5. The feasibility of imaging ODCs using less sensitive techniques such as vascular-space-occupancy (VASO) fMRI 6,7 has also been shown previously at 7T 8. In this study, we examined the depth dependence of the ODC monocular and binocular responses measured with BOLD and VASO contrasts.Method
Imaging: VASO and BOLD images were acquired using the DZNE sequence 9 with a 3D EPI readout 10 on a head-only 7T scanner (MAGNETOM 7T Plus, Siemens Healthineers AG) with an 8-channel Tx, 32-channel Rx radiofrequency coil optimized for occipital-parietal imaging11. The imaging slab was positioned parallel to the calcarine sulcus, and eighteen slices were acquired with the following image parameters: TR2/TE/TI2 = 3294/21.8/2379 ms, inversion delay = 650 ms, CAIPIRINHA acceleration factor = 3, and isotropic resolution = 0.8 mm. Five functional runs (200 volumes of each contrast in each run) were acquired at each imaging session.MP2RAGE images 12 were acquired with 0.75 mm isotropic resolution using a 7T head coil with 8-channel transmit dipoles and 32-channel receive loops 13.
Participants: Five participants with normal or corrected-to-normal vision participated in this study after giving a written consent form approved by the Human Subjects Research Ethics Board at the University of Western Ontario.
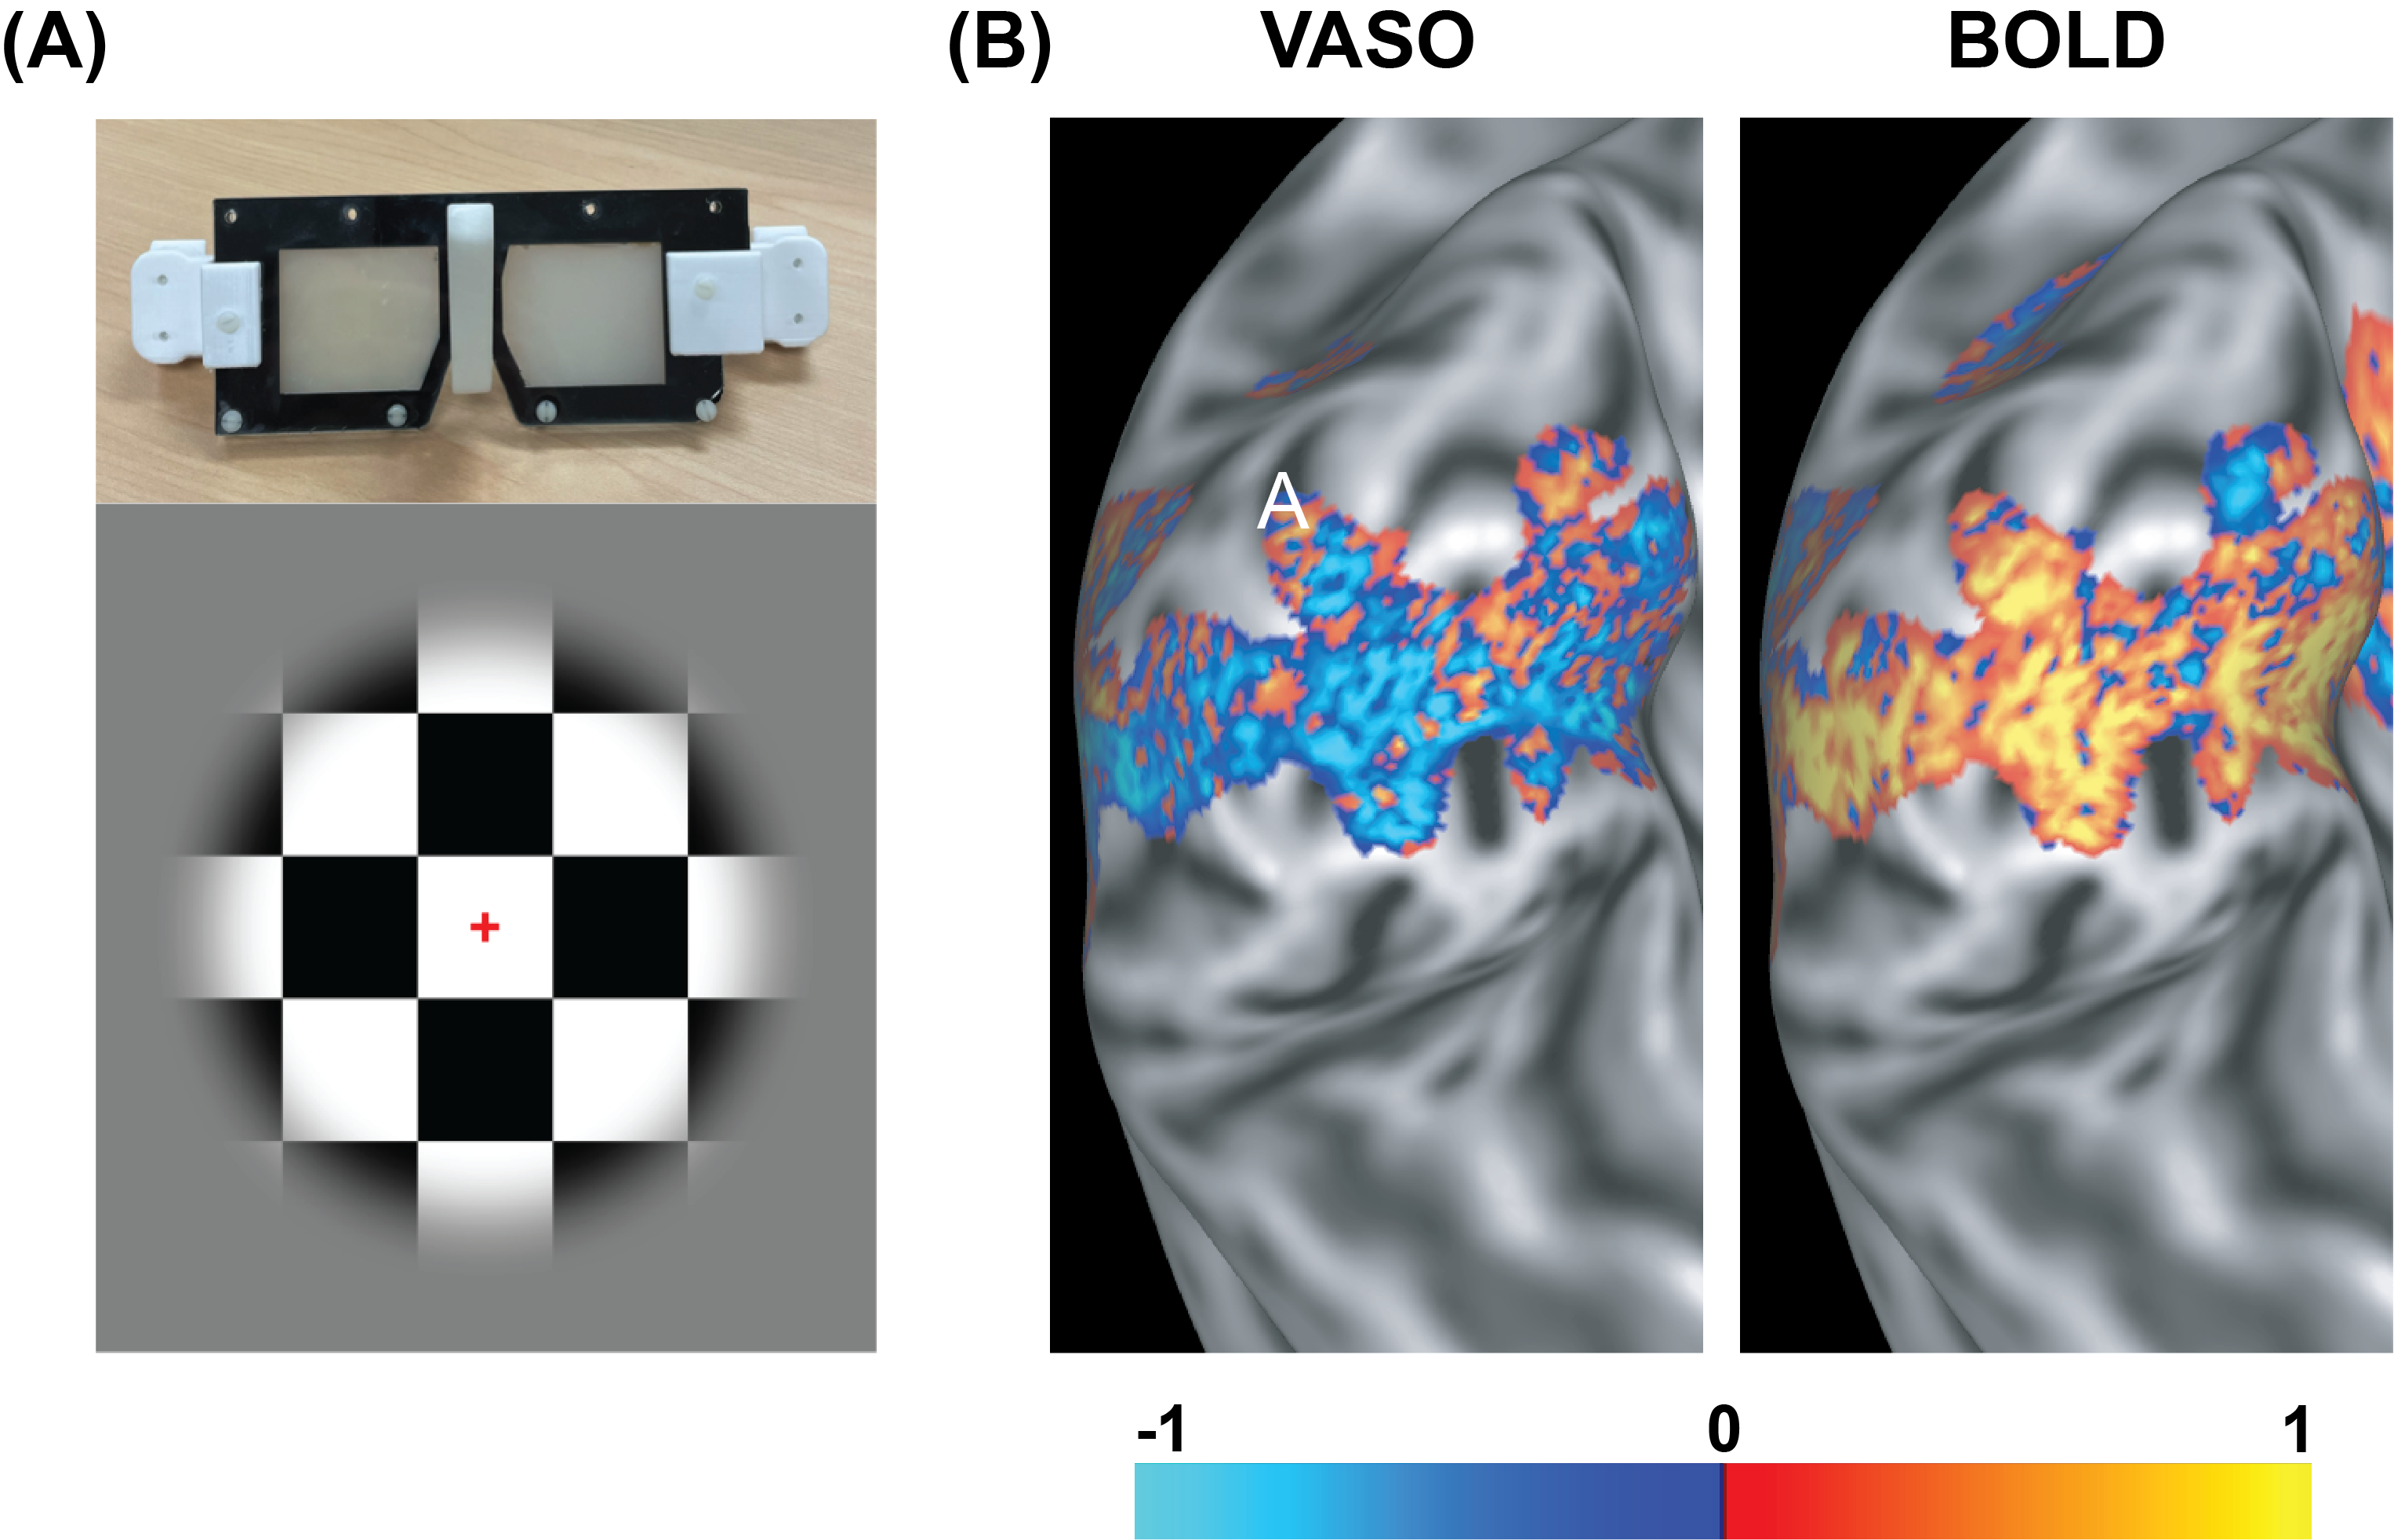
Visual stimulus: A house-made MR-compatible LCD goggle with the ability of viewing the visual stimulus monocularly and binocularly was used to present the stimulus to the participant's eyes. The visual stimulus was a flickering checkerboard (10 Hz, ON) interleaved with a grey screen (OFF), presented in 22 blocks each 30 seconds long. When presented monocularly, the non-stimulated eye viewed an opaque grey lens (see Fig. 1 A) with the same contrast as the screen presented during the OFF condition. Participants were asked to fixate on the red fixation cross at the center of the stimulus during the scan.
Image analysis: VASO and BOLD images were motion-corrected separately using SPM12. BOLD T2* decay correction during the EPI readout was performed using LAYNII (LN_BOCO) 14. NORDIC 15 was applied for thermal noise removal and then GLM statistics were performed using SPM12. Voxels with t-values above 3.1 corresponding to an uncorrected significance level of p<0.001 were identified as the activated regions in both BOLD and VASO contrasts. Presurfer 16 was used for bias field correction and skull stripping, and then the MPRAGEIZED image was registered to the T1-EPI image using ANTs. Freesurfer (recon-all) was then supplied with the MPRAGEIZED image for cortical surface reconstruction. For display purposes, we used the human connectome workbench to register the activation maps on an inflated cortical surface.
A region-of-interest (ROI) was manually defined on V1 using FSL and ten equidistance layers were created in the ROI using LAYNII (LN2_LAYERS).
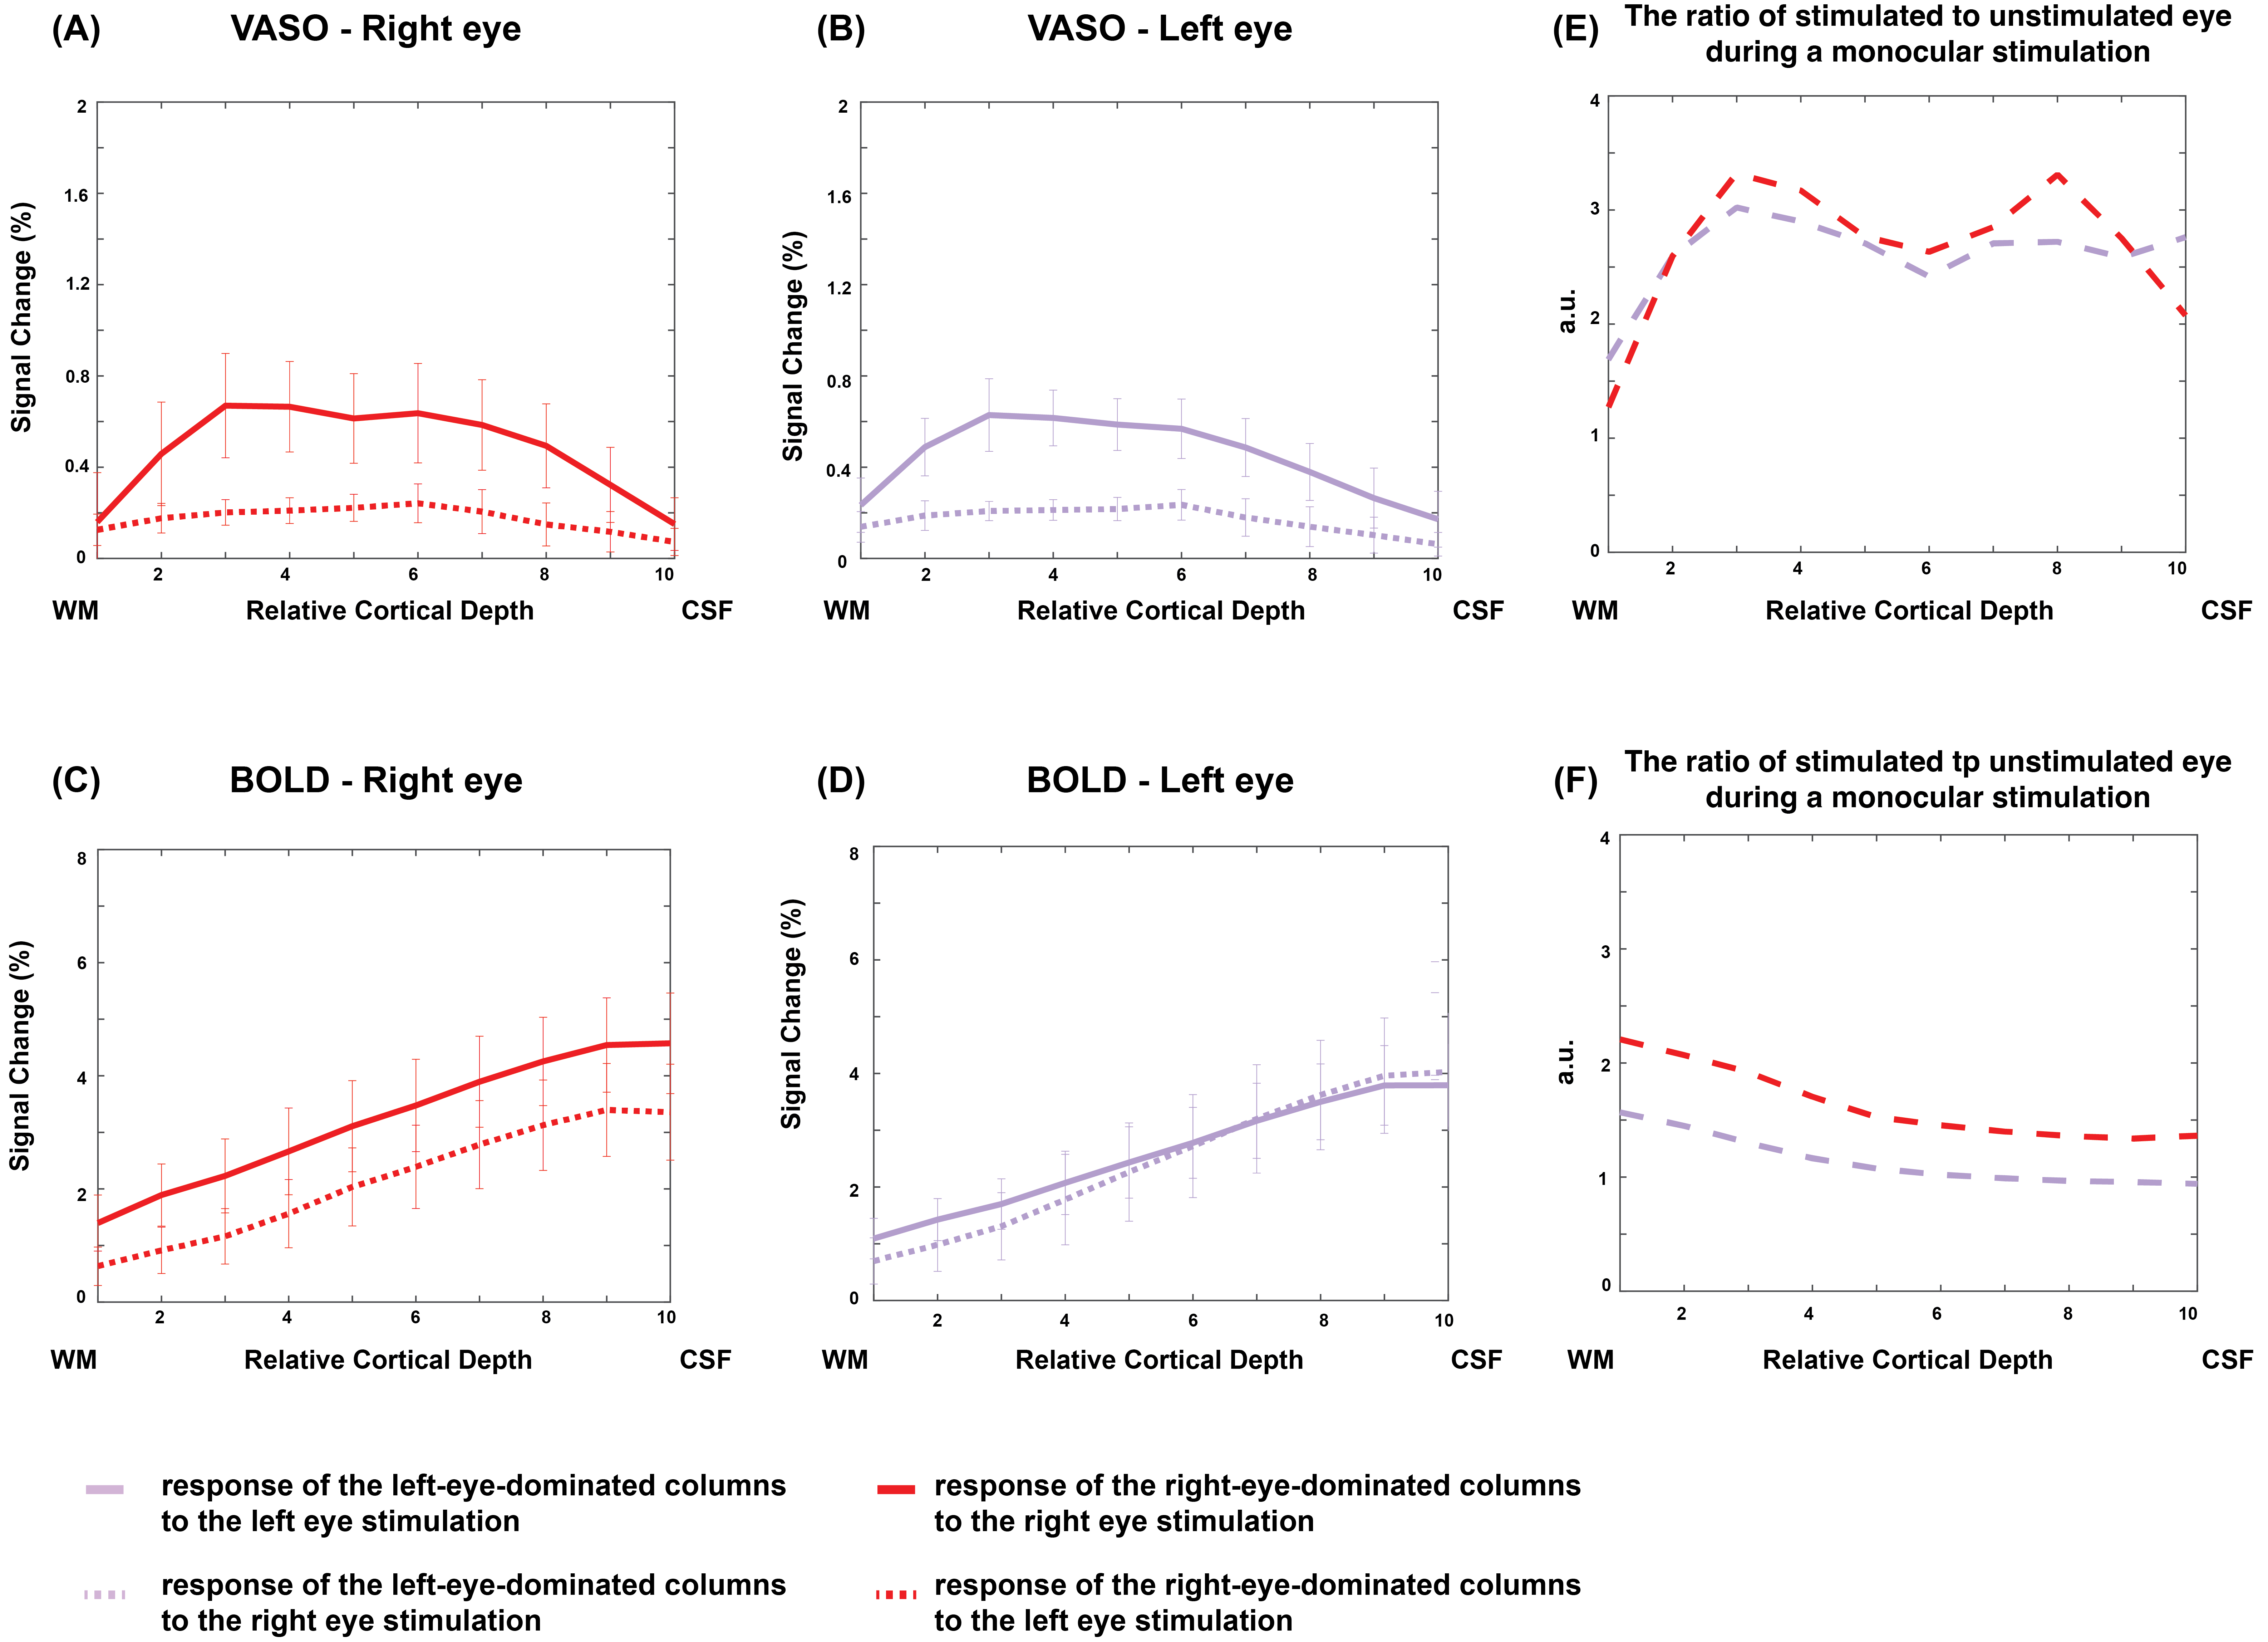
To identify the monocular columns, voxels from the right eye and left eye t-maps with t-values > 2.3 were identified as the right-eye-dominated and left-eye-dominated columns respectively. These binary masks were then multiplied by the both-eyes t-map to determine the monocular responses under binocular viewing. These binary masks containing the monocular columns were also used to determine the response of the unstimulated eye to the stimulation of the other eye. Finally, the ratio of the stimulated eye to unstimulated eye responses during a monocular viewing was calculated for each of the VASO and BOLD contrasts.
Results
Figure 1 shows the BOLD and VASO fMRI maps of ODCs in one subject. Hot (cool) color represents image voxels whose fMRI response was greater in magnitude during right (left) eye stimulation than during left (right) eye stimulation.Figure 2 depicts the fMRI responses to a monocular stimulation as a function of cortical depth. With VASO, the response of the unstimulated eye is smaller than that of the stimulated eye during a monocular stimulation. However, with BOLD, both responses are similar in amplitude and trend across the cortical depths and columns.
The ratio of the stimulated to unstimulated eye responses during monocular stimulation is higher in superficial and deep cortical depths in VASO, however, in BOLD, this ratio is higher at deep cortical depths and decreases as the surface is reached.
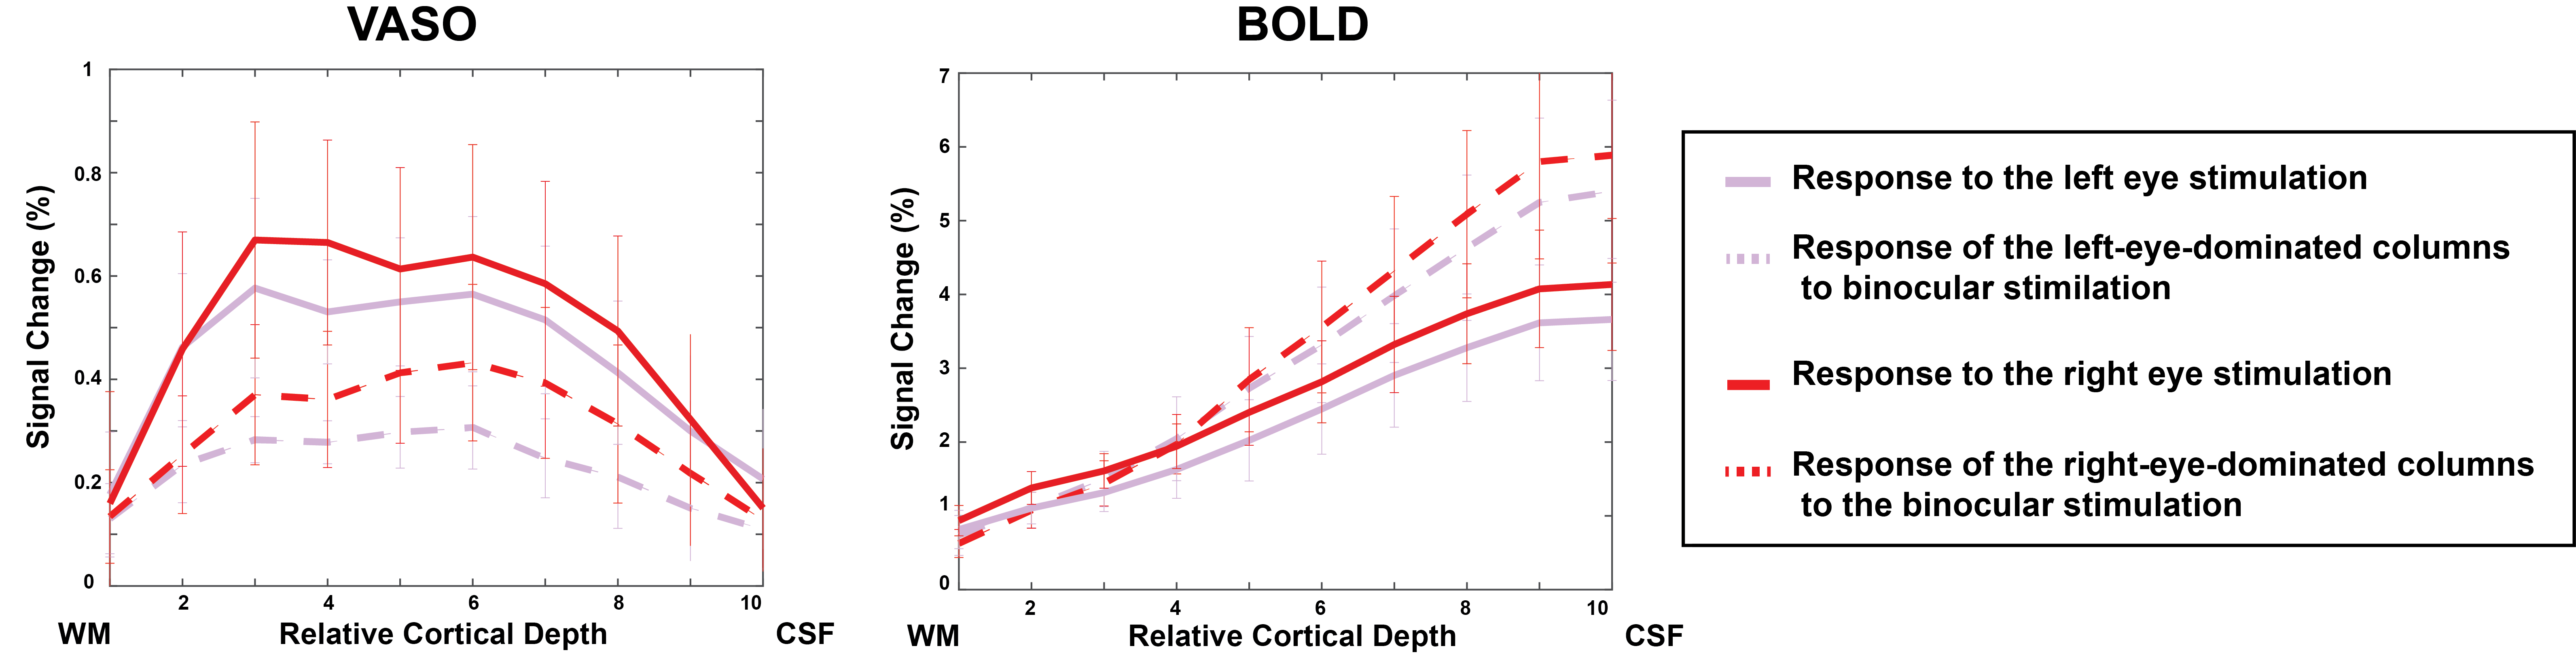
Figure 3 compares the response of the stimulated eye to both monocular and binocular stimulation. Interestingly, the monocular responses in VASO were suppressed during binocular viewing. While in BOLD, binocular viewing increased the monocular responses. This can be explained by the higher point spread of the BOLD monocular responses (see Figure 2) that leads to a higher response during binocular viewing.
Discussion and Conclusion
In this study, we investigated the ocular dominance columns responses during monocular and binocular viewing as a function of cortical depths. Our results show that VASO better distinguishes the ODCs monocular responses compared to GRE BOLD, likely due to its smaller cortical point spread. In addition, we showed that the binocular modulation of the monocular neurons in V1 17 could possibly be revealed with the VASO contrast.Acknowledgements
The authors would like to thank Trevor Szekeres and Scott Charlton for their assistance with data acquisition. This work was supported by a CIHR Foundation grant, BrainsCAN-Canada First Research Excellence Fund, and a Brain Canada Platform Support Grant.References
1. Hubel DH, Wiesel TN. Receptive fields and functional architecture of monkey striate cortex. J Physiology. 1968;195:215–43.
2. Goodyear BG, Menon RS. Brief visual stimulation allows mapping of ocular dominance in visual cortex using fMRI. Hum Brain Mapp. 2001;14:210–7.
3. Yacoub E, Shmuel A, Logothetis N, Uğurbil K. Robust detection of ocular dominance columns in humans using Hahn Spin Echo BOLD functional MRI at 7 Tesla. Neuroimage. 2007;37:1161–77.
4. Hollander G de, Zwaag W van der, Qian C, Zhang P, Knapen T. Ultra-high field fMRI reveals origins of feedforward and feedback activity within laminae of human ocular dominance columns. Neuroimage. 2021;228:117683.
5. Zaretskaya N, Bause J, Polimeni JR, Grassi PR, Scheffler K, Bartels A. Eye-selective fMRI activity in human primary visual cortex: Comparison between 3 T and 9.4 T, and effects across cortical depth. Neuroimage. 2020;220:117078.
6. Lu H, Golay X, Pekar JJ, Zijl P van. Functional magnetic resonance imaging based on changes in vascular space occupancy. Magnetic Resonance in Medicine. 2003;50:263–74.
7. Huber L, Ivanov D, Krieger SN, Streicher MN, Mildner T, Poser BA, et al. Slab‐selective, BOLD‐corrected VASO at 7 Tesla provides measures of cerebral blood volume reactivity with high signal‐to‐noise ratio. Magnetic Resonance in Medicine. 2014;72:137–48.
8. Haenelt D, Weiskopf N, Vaculciakova L, Mueller R, Nasr S, Polimeni J, et al. Mapping ocular dominance columns in humans using GE-EPI, SE-EPI and SS-SI-VASO at 7 T. In: ISMRM. 2020.
9. Stirnberg R, Stöcker T. Segmented K‐space blipped‐controlled aliasing in parallel imaging for high spatiotemporal resolution EPI. Magnet Reson Med. 2021;85:1540–51.
10. Poser BA, Koopmans PJ, Witzel T, Wald LL, Barth M. Three dimensional echo-planar imaging at 7 Tesla. Neuroimage. 2010;51:261–6.
11. Gilbert KM, Gati JS, Menon RS. Occipital-Parietal Coil with variable-density element distribution for 7T functional imaging. In 2017.
12. Marques JP, Kober T, Krueger G, Zwaag W van der, Moortele PFV de, Gruetter R. MP2RAGE, a self bias-field corrected sequence for improved segmentation and T1-mapping at high field. Neuroimage. 2010;49:1271–81.
13. Gilbert KM, Klassen LM, Mashkovtsev A, Zeman P, Menon RS, Gati JS. Radiofrequency coil for routine ultra‐high‐field imaging with an unobstructed visual field. Nmr Biomed. 2021;34:e4457.
14. Huber LR, Poser BA, Bandettini PA, Arora K, Wagstyl K, Cho S, et al. LAYNII: a software suite for layer-fMRI. Neuroimage. 2021;237:118091.
15. Vizioli L, Moeller S, Dowdle L, Akçakaya M, Martino FD, Yacoub E, et al. Lowering the thermal noise barrier in functional brain mapping with magnetic resonance imaging. Nat Commun. 2021;12:5181.
16. Kashyap S. Presurfer [Internet]. Available from: https://zenodo.org/badge/latestdoi/307506444
17. Dougherty K, Cox MA, Westerberg JA, Maier A. Binocular Modulation of Monocular V1 Neurons. Curr Biol. 2019;29:381-391.e4.
Figures