0619
Optimized signal saturation for fast functional line-scanning of cortical layers1School of Psychology & Neuroscience, University of Glasgow, Glasgow, United Kingdom, 2NIH, Bethesda, MD, United States, 3Beckman Institute for Advanced Science and Technology, Urbana, IL, United States, 4Department of Psychology, University of Illinois at Urbana-Champaign, Champaign, IL, United States, 5Department of Bioengineering, University of Illinois at Urbana-Champaign, Urbana, IL, United States
Synopsis
Keywords: fMRI, High-Field MRI, High Resolution fMRI
Layer-dependent fMRI is typically performed at sampling rates below 1 Hz and voxel sizes of 0.7-0.9 mm3 containing signal from multiple anatomical layers. Line-scanning can enhance spatial resolution to 0.2-0.4 mm while maintaining sub-second TR. It is therefore an ideal method to study temporal evolution of BOLD responses across cortical layers. However, current saturation schemes for human line-scanning suffer from broad saturation profiles that lead to signal contamination of BOLD responses from adjacent areas. We implemented line-scanning in humans with sharp line-profiles of 3 mm. Using this method, we show that cortical layers of M1 have unique BOLD time courses.Introduction
A limitation of current layer-dependent fMRI methods at ultra-high-field is that they sample at rates lower than 1 Hz, which leads to decreased laminar temporal information. Furthermore, their spatial resolution is typically in the range of 0.7-0.9 mm containing signal from multiple adjacent anatomical layers. Line-scanning fMRI work in animals (Yu et al., 2014) has demonstrated that sub-second layer-specific recordings at very high spatial resolution can be obtained by reducing the FoV to a single line through the cortex. However, due to SAR constraints in humans, a direct translation of this approach to humans has not been achieved without compromising either saturation efficiency or line sharpness. We developed a signal saturation scheme that complies with SAR constraints while delivering very thin and sharp line profiles. We demonstrate the capability of this sequence to study differences in the temporal evolution of BOLD signals across cortical layers in the human motor cortex.Methods
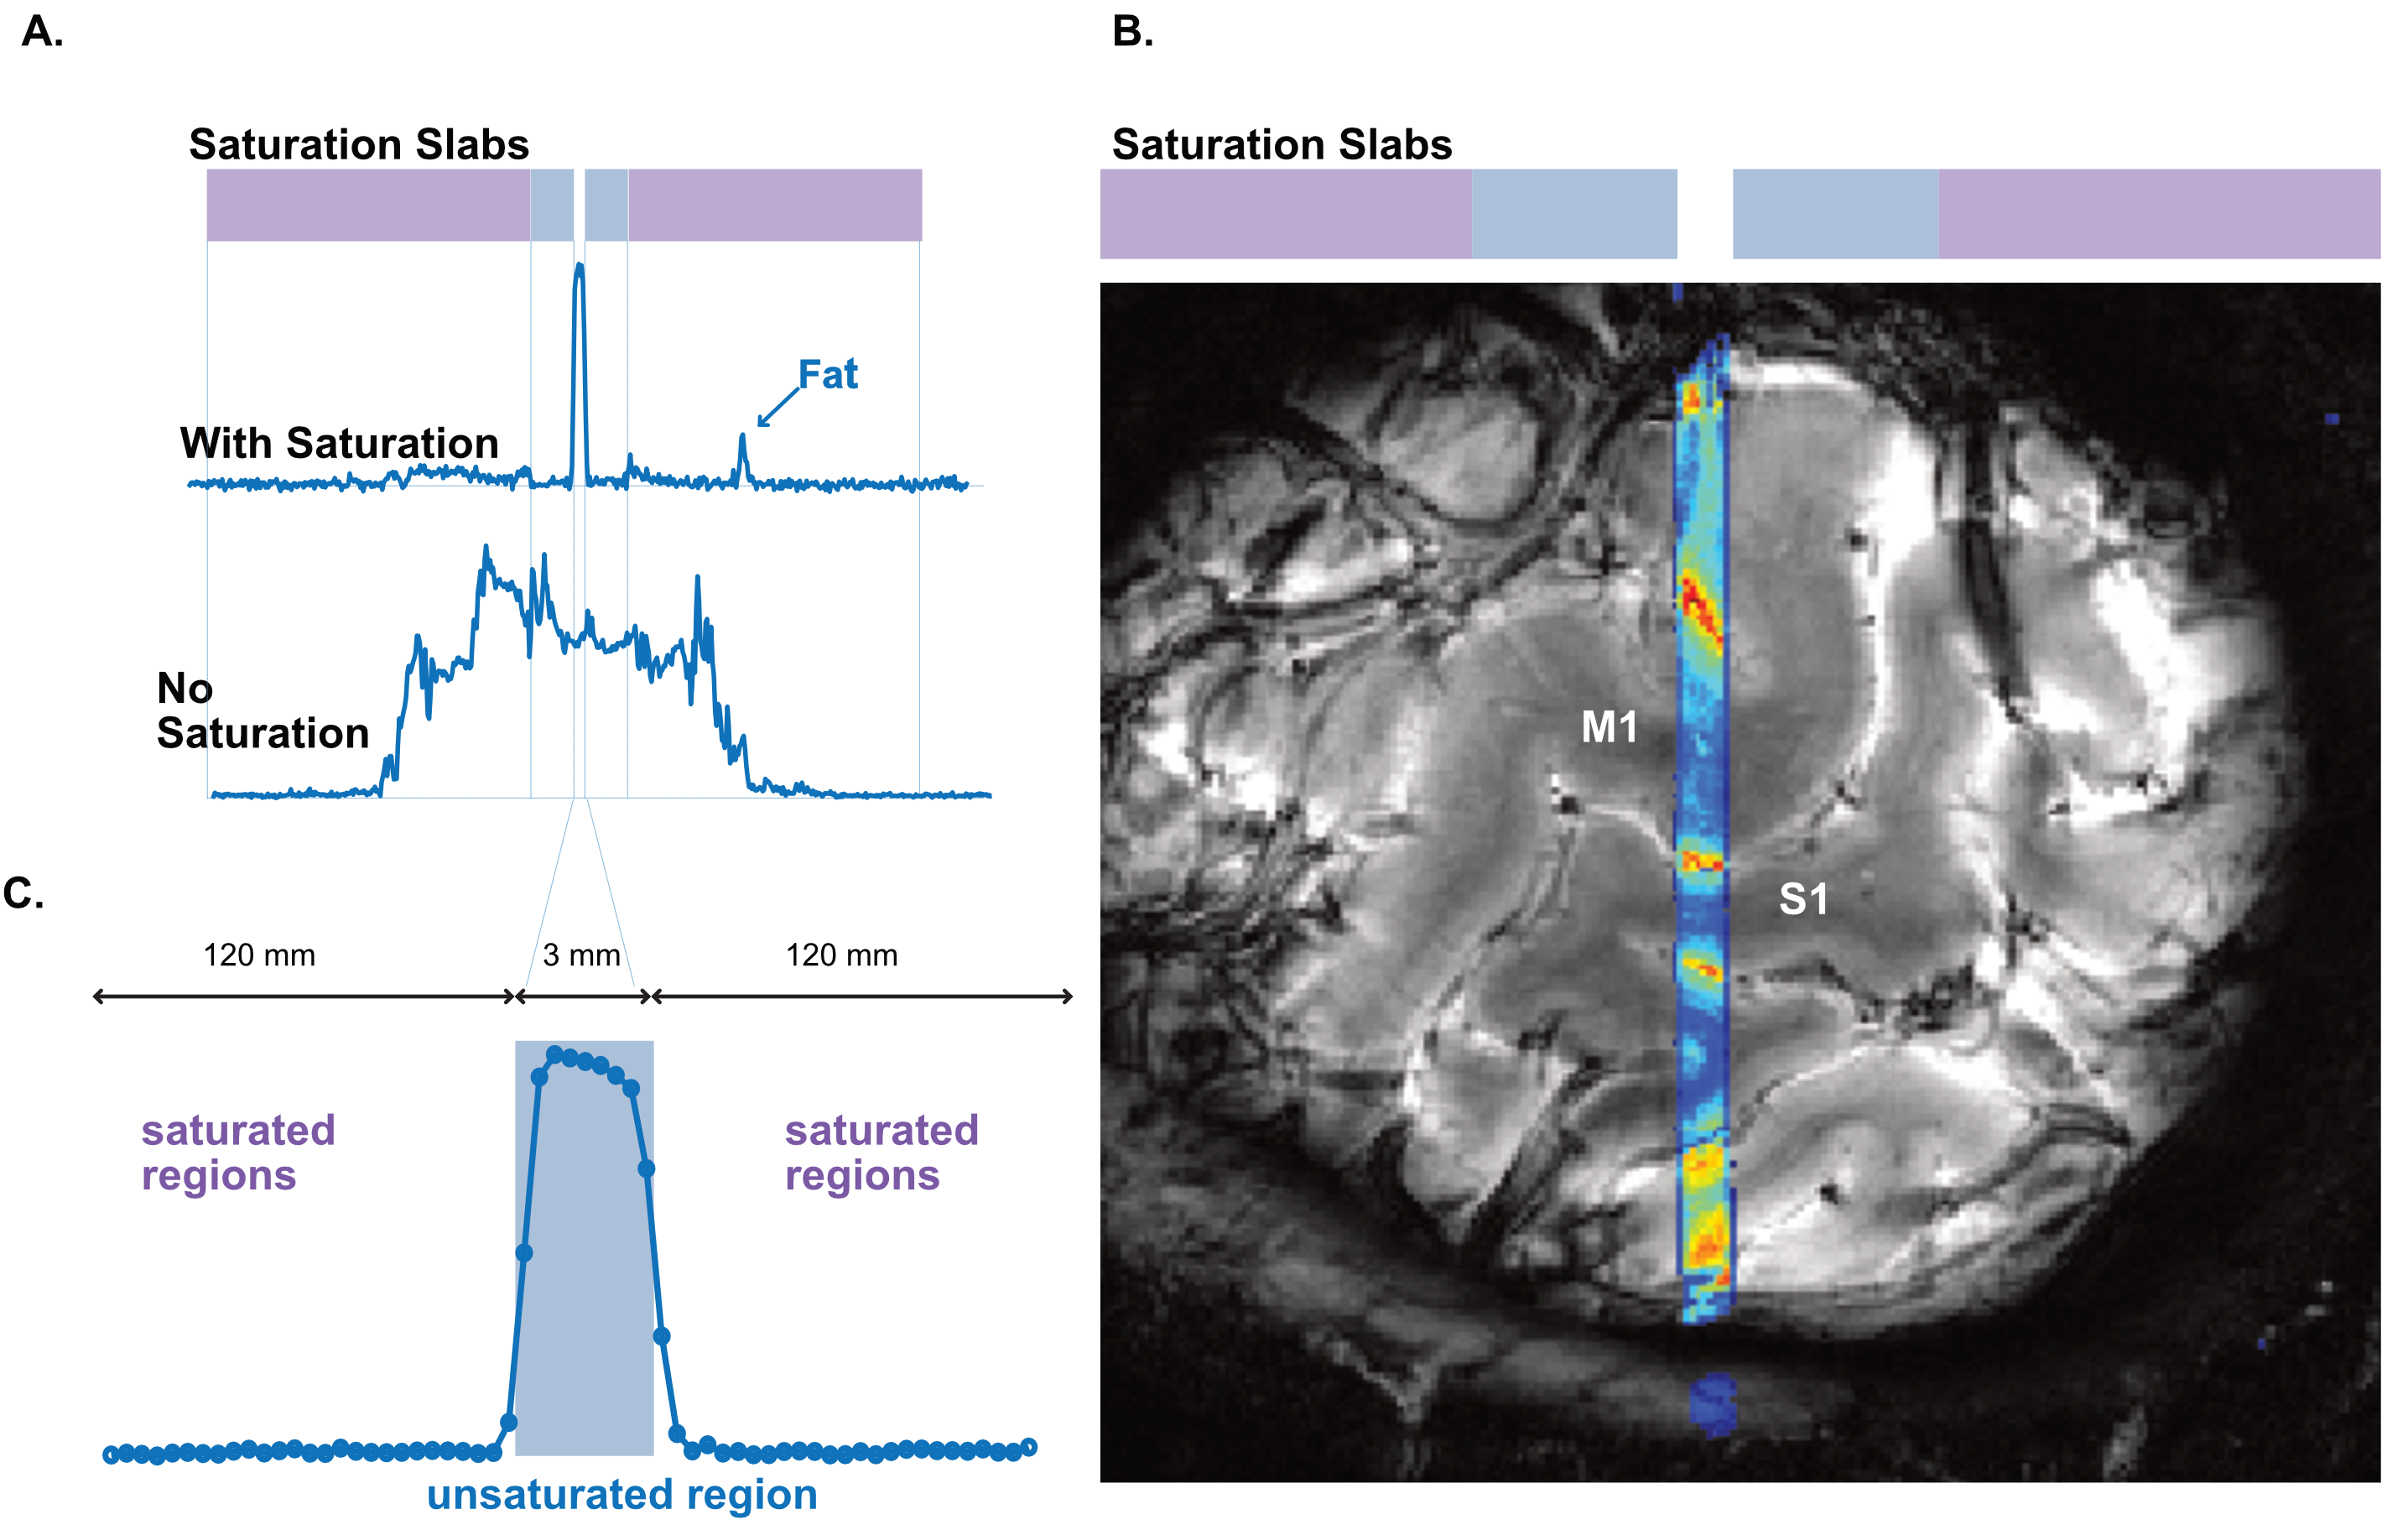
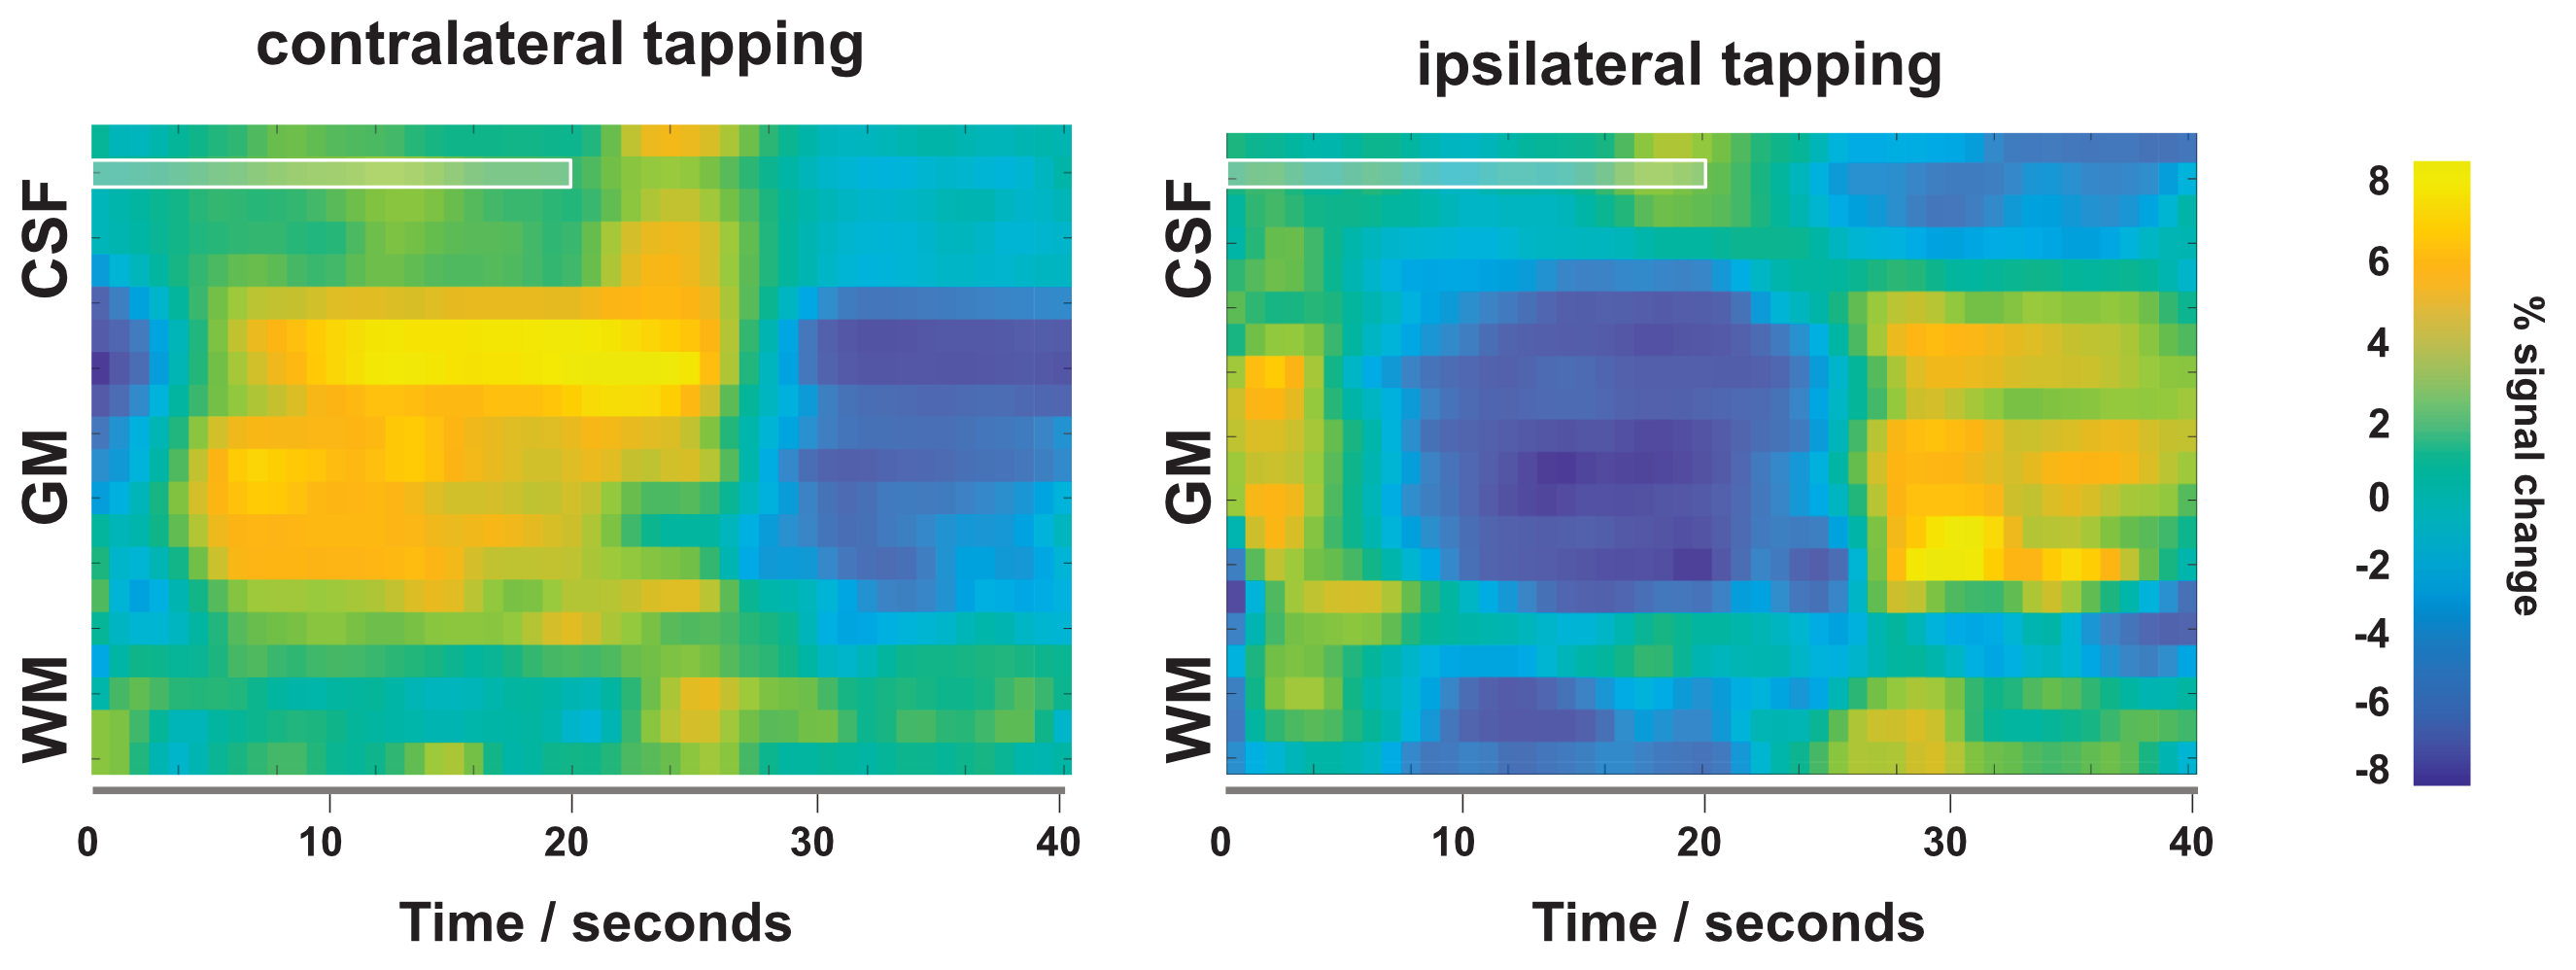
We performed functional line-scanning in 8 healthy volunteers using a 7T Terra scanner (Siemens Healthineers, Erlangen, Germany) equipped with a 32-channel head coil (Nova Technologies). The line-scanning sequence was based on a FLASH readout (TR/TE 250 ms/25 ms, voxel size 0.39 x 3.0 x 3.0 mm3, readout bandwidth 120 Hz/px, FA 23º) with two important modifications. First, we suppressed signal originating outside of the line by adding saturation pre-pulses (see Fig. 1A) around the cortical patch of interest. We divided signal saturation in two parts: line generation and bulk saturation. Two saturation pulses created a sharply defined line profile using a root-flipped high BW-time product SLR pulse (1) (FA 110˚, thickness 15 mm, BW-time product 19, 7800 µs). Two additional root-flipped saturation RF pulses suppressed the remaining signal (FA 120˚, thickness 120 mm, BW-time product 2.7, 3800 µs). To examine signal suppression outside the line, we recorded profile scans with and without saturation regions. We then acquired functional scans with matching sequence parameters but omitted the phase-encoding loop to record the line as one k-space readout per excitation. Data were then exported offline where we applied a custom reconstruction including a coil sensitivity-weighted channel combination (Raimondo et al., 2021) and signal denoising. Because the gyrified human cortex poses additional challenges to line placement, we placed the line through a 3 x 3 mm2 flat patch in the hand knob of the human motor cortex using an automated line placement method (Morgan et al., 2020). We then recorded functional data using a 20s on/off block design during finger tapping of the contralateral and ipsilateral index finger.Results
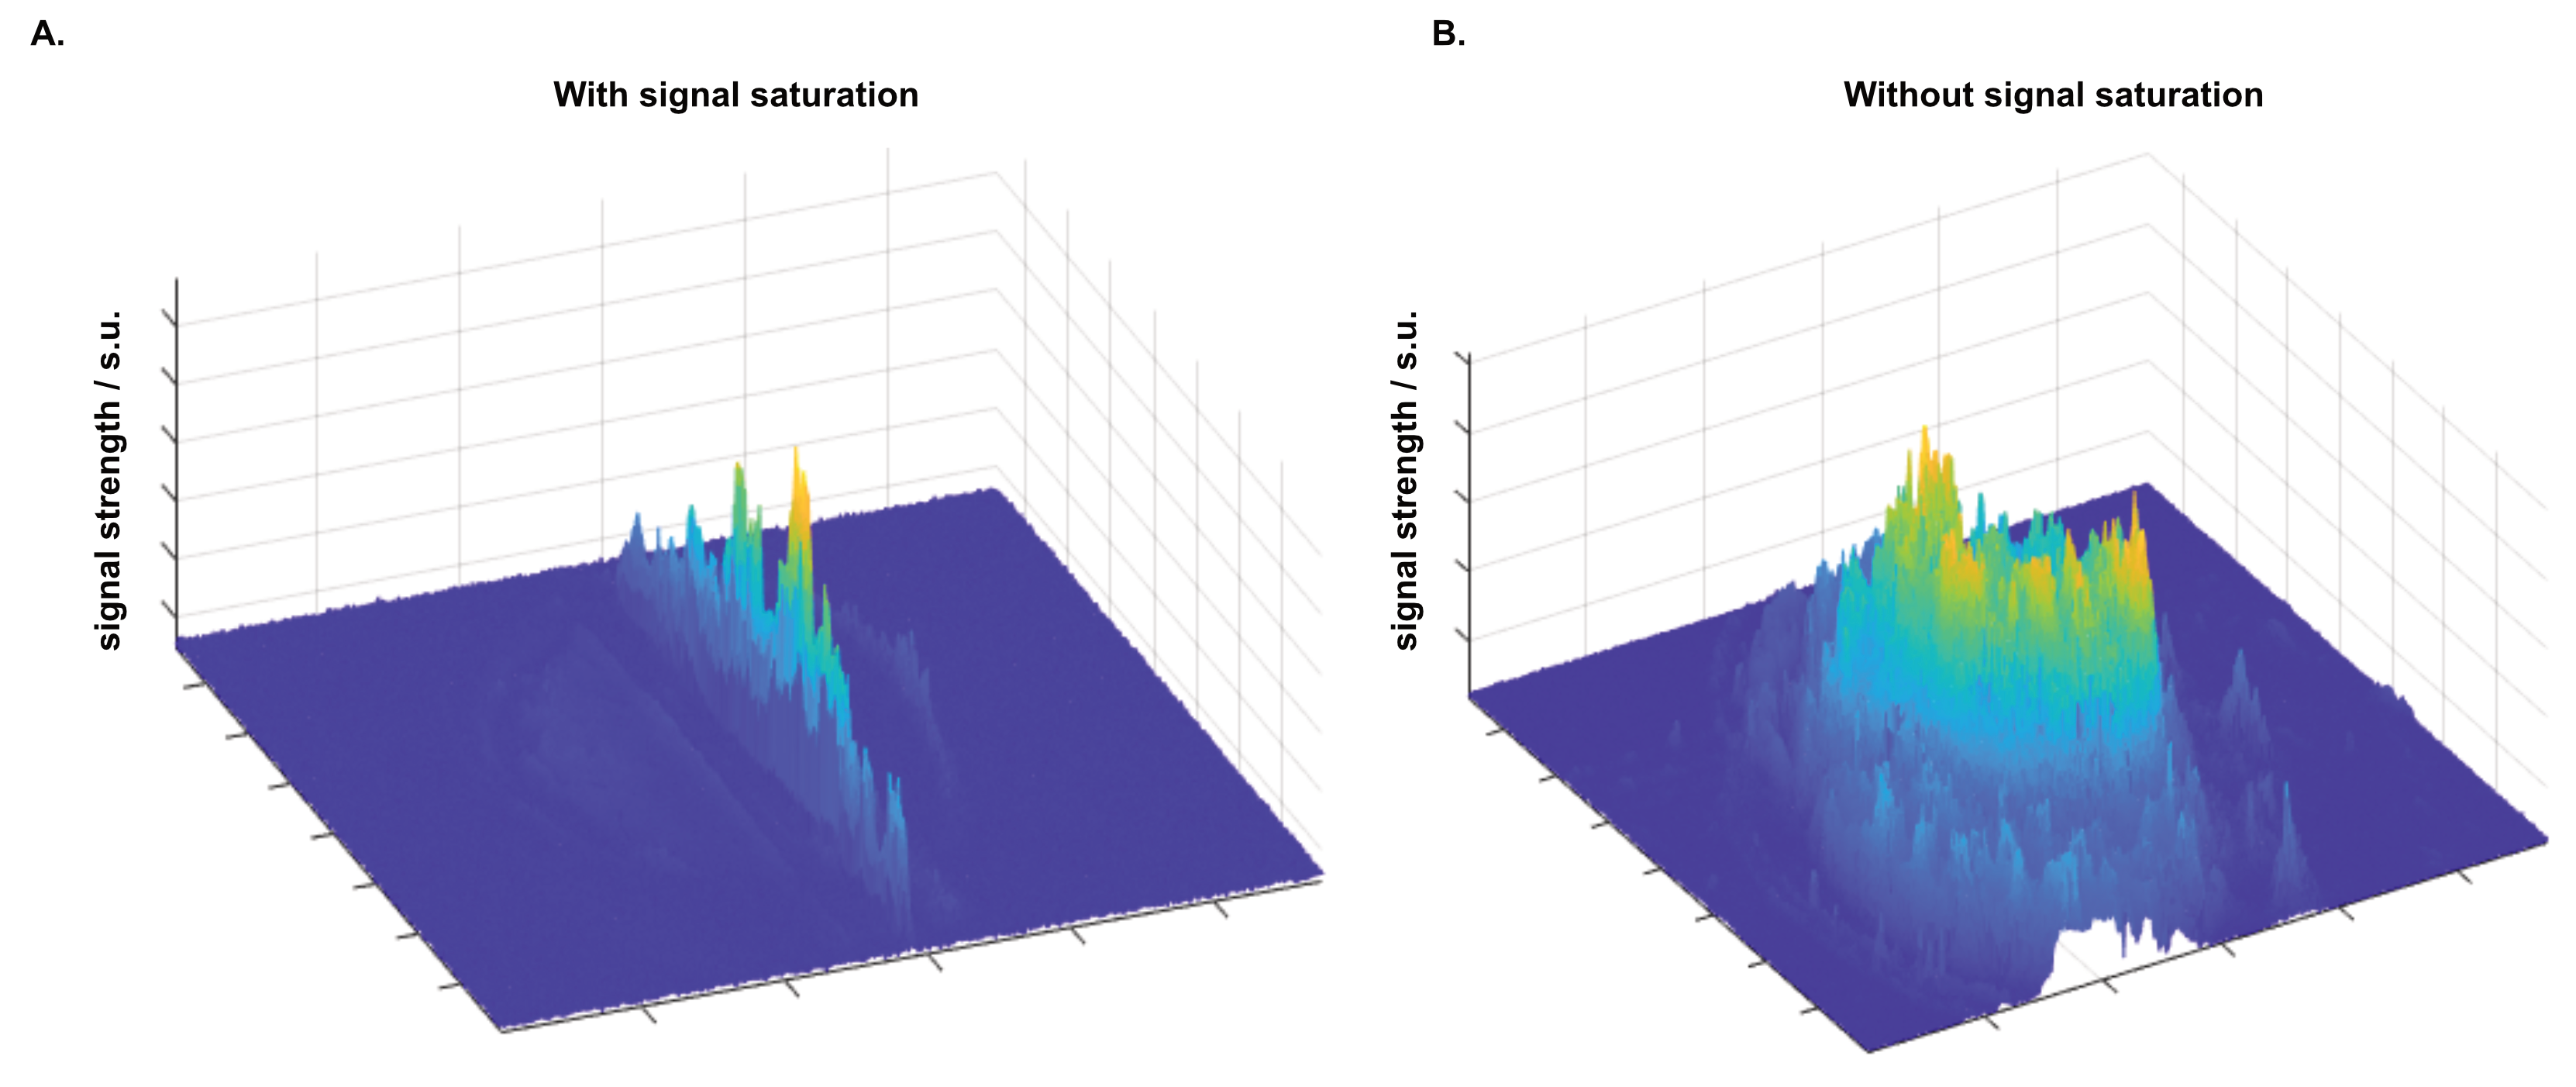
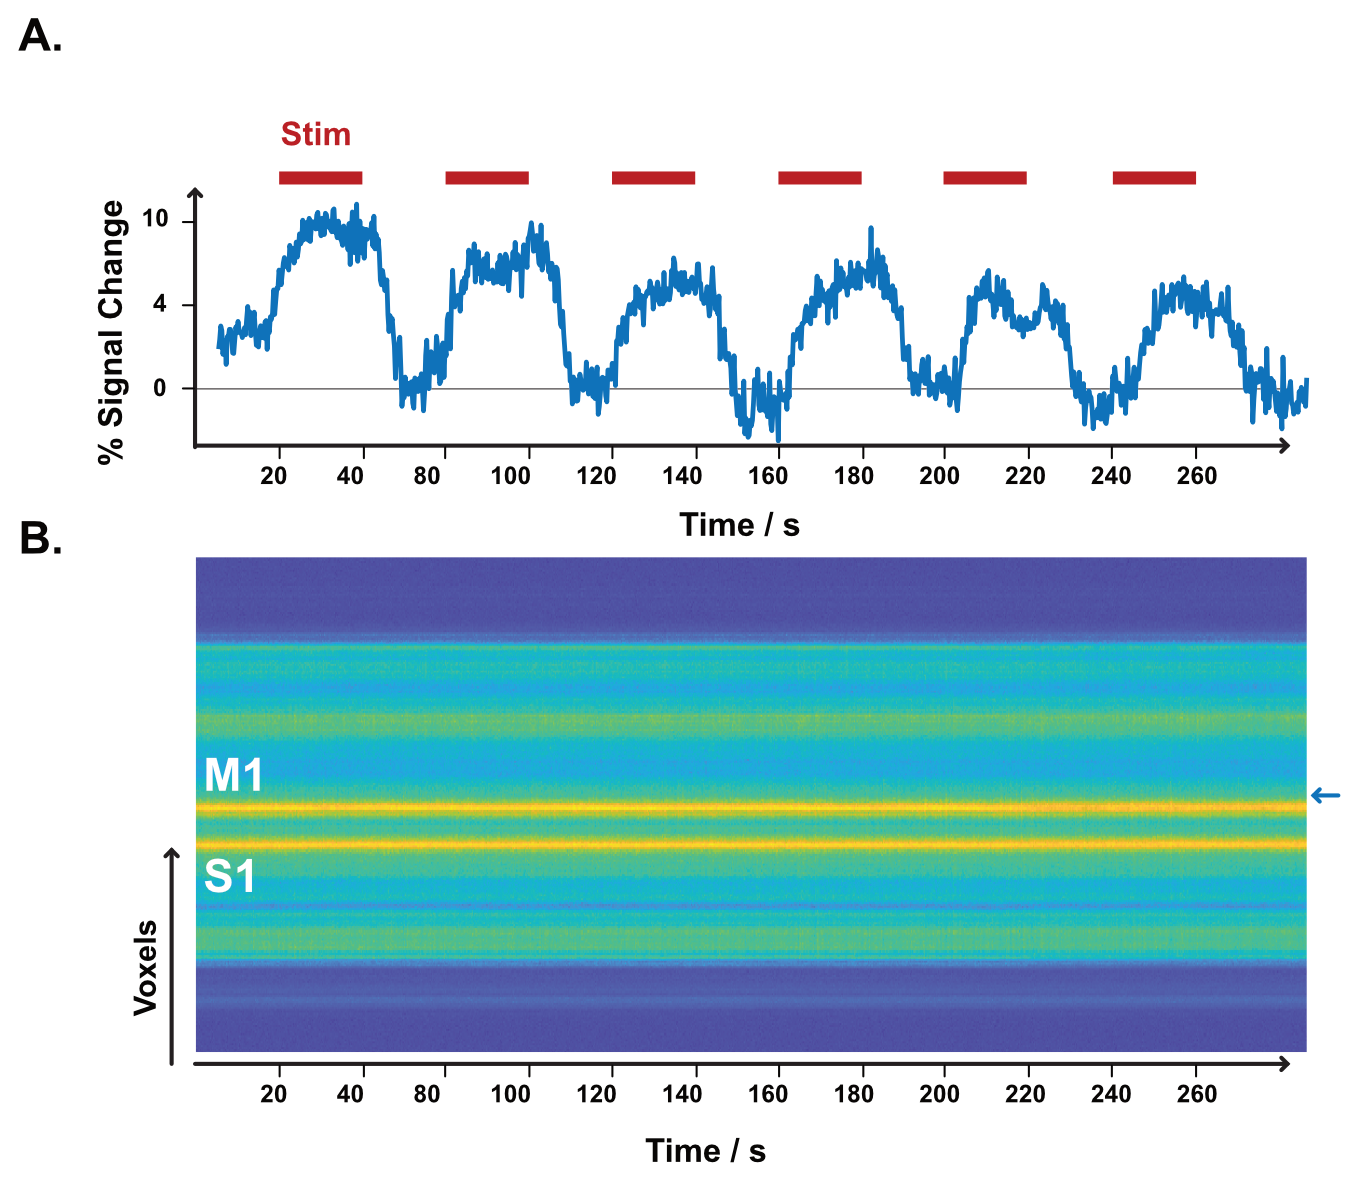
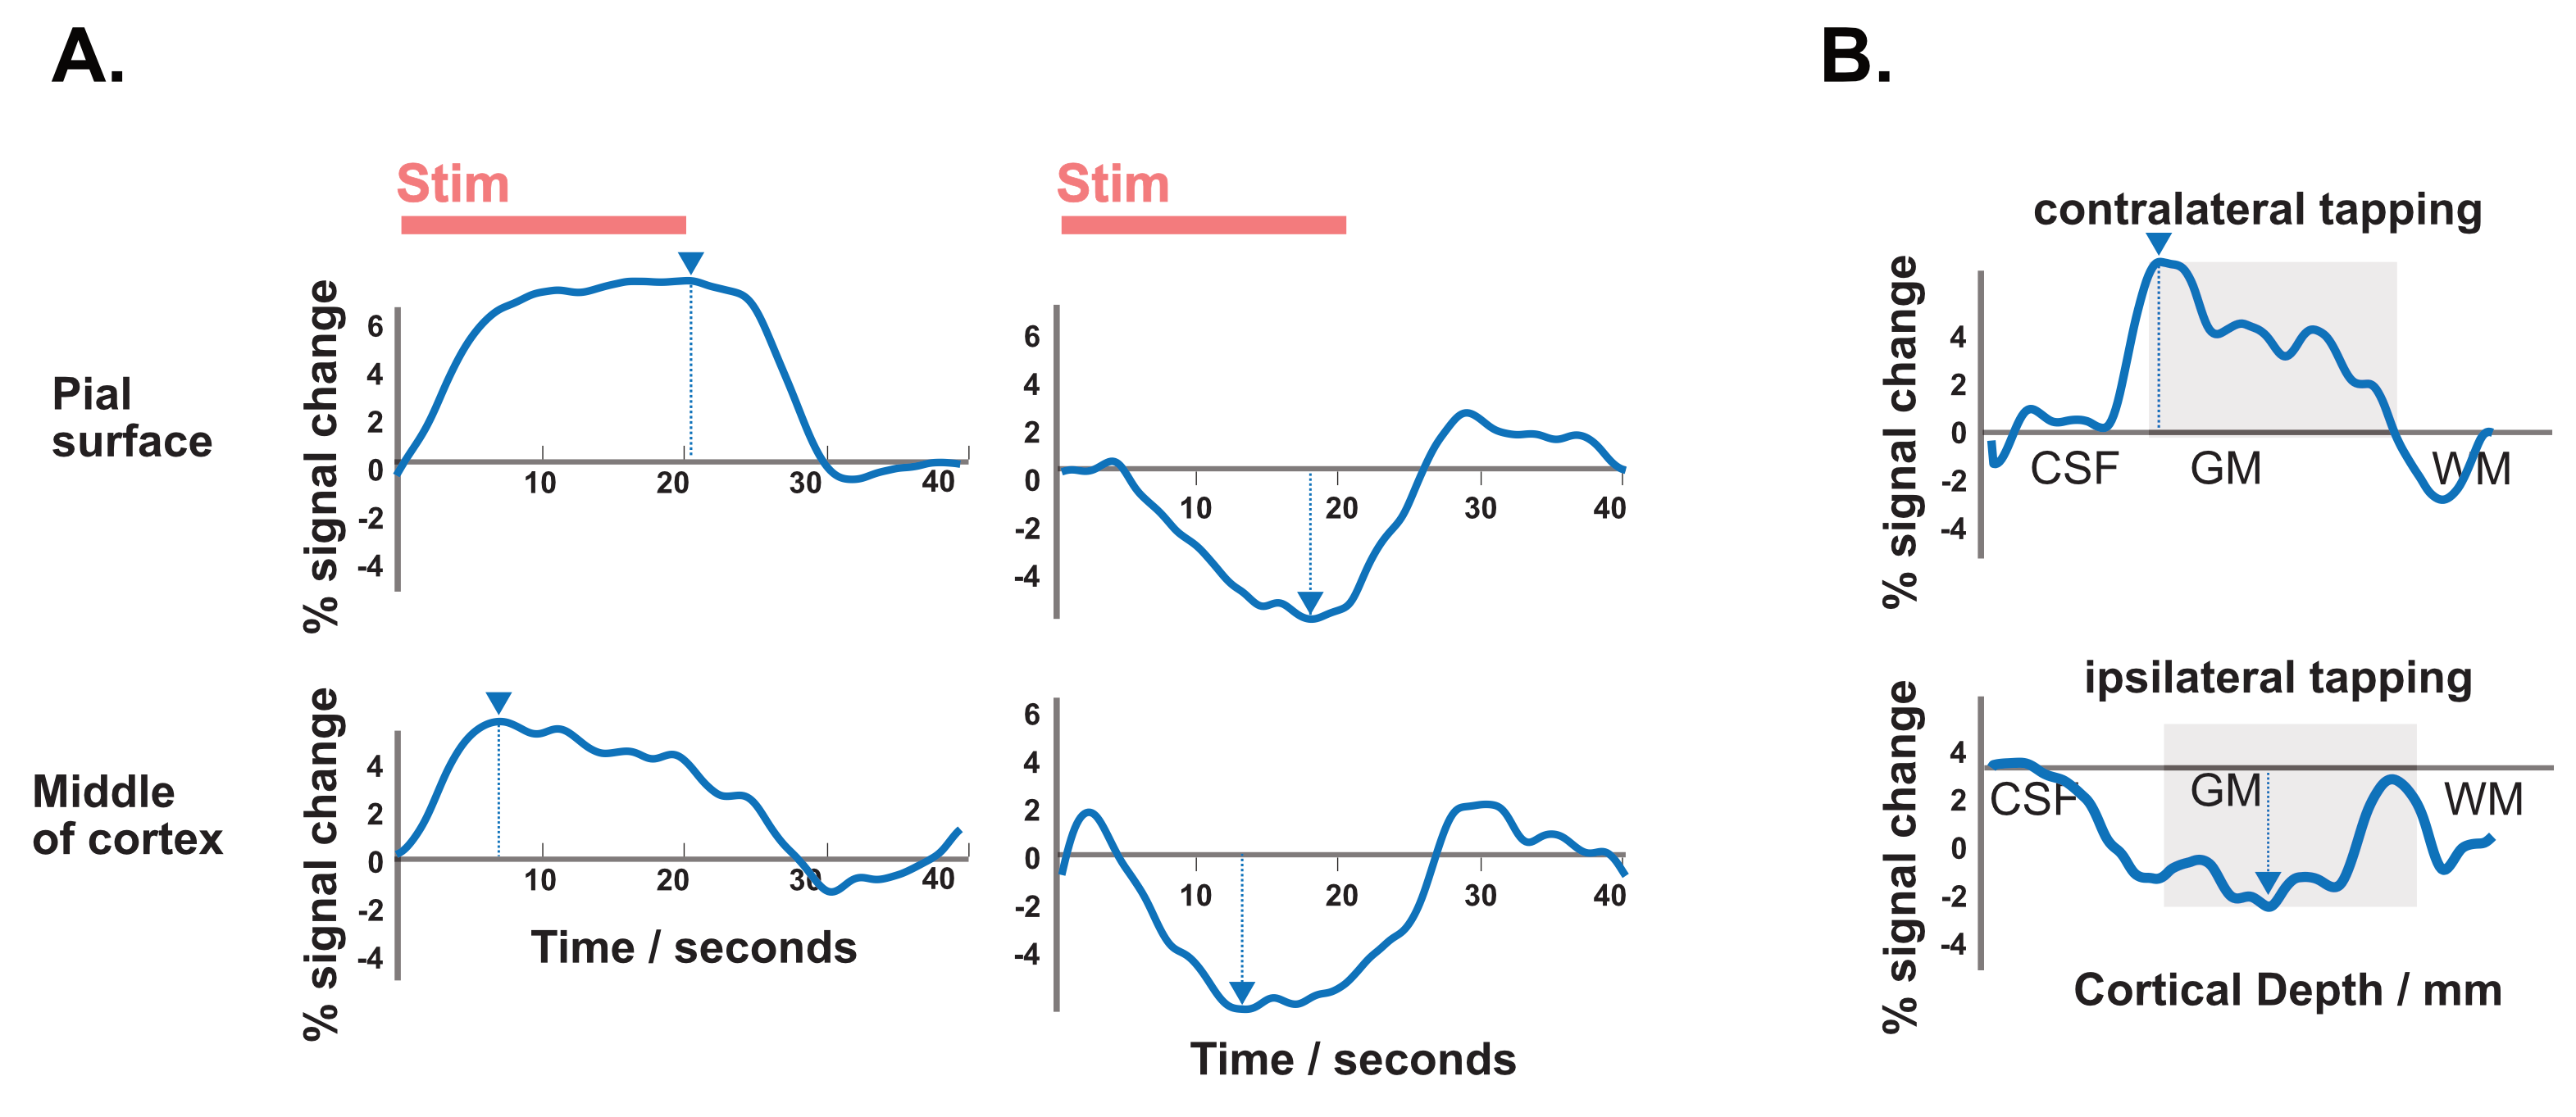
The resulting signal saturation of our line-scanning sequence in a single participant is illustrated in Figures 1-3. Figure 1A visualizes the signal suppression in a line perpendicular to the readout direction. Four saturation slabs suppressed the MR signal in all voxels except a sharp, defined targeted line of 3 mm width. The signal drops to zero within less than a millimetre outside the targeted line (Fig. 1C). When omitting signal saturation pulses, signal is generated of the entire slice and not just from the line region (Fig. 2) demonstrating highly efficient suppression outside the targeted line. Figure 3A shows the functional signal of a voxel located at the pial surface of M1 and Figure 3B shows the signal of the line during the functional run, showing high stability within the run (Fig. 3).The depth-dependent time courses of the functional profiles averaged across all subjects (N=8) can be seen in Figures 4 and 5. The mean SAR level during all line scans was 70.83 ± 9.5 (N=8). Positive and negative BOLD signals are visible across the grey matter ribbon of the motor cortex at a spatial resolution of 0.39 mm and temporal resolution of 250 ms (Fig. 4). The positive BOLD response was maximal at the cortical surface, while middle layers reached their maximum amplitude faster than superficial layers, in agreement with earlier findings in animals (Yu et al., 2014). Signal in the middle layers exhibited a less pronounced initial dip and a less prolonged post-stimulation undershoot. The positive BOLD signals peaked earliest in the middle layers (T=8.7s±3.7s), after which it decreased in amplitude, in contrast to superficial layers which built up in amplitude and peaked later (T=21.6s±1.6s). The negative BOLD peaked also in middle layers first (T=15.9±2.8s) and shortly afterwards in superficial layers (T=17.6±0.4s), see Fig. 5.Discussion
We present a line-scanning method suitable for highly localized functional recordings in humans at 7T. The high spatiotemporal resolution of our measurements enabled us to distinguish subtle differences in laminar time courses. Our approach complies with human restrictions for SAR while at the same time delivering very sharp and thin profiles with minimal signal contamination from outside the line region. We show that our line-scanning procedure is highly suitable for laminar and temporal separation of BOLD signals from different cortical layers. This is a powerful method that can be used in future research to characterize the mechanistic nature of the BOLD effect also in humans.Acknowledgements
We thank Frances Crabbe for her support during data acquisition of anatomical scans at the 3T used during line planning.
N.N. and J. G. are funded by the Medical Research Council (MR/R005745/1). T.M. and L.M. received funding from the Medical Research Council (MR/N008537/1) and the European Union’s Horizon 2020 Framework Programme for Research and Innovation under the Specific Grant Agreement No. 785907 and 945539 (Human Brain Project SGA2 and SGA3).
References
Yu, X., Qian, C., Chen, D.Y., Dodd, S.J., Koretsky, A.P., 2014. Deciphering laminar-specific neural inputs with line-scanning fMRI. Nat Methods 11. https://doi.org/10.1038/nmeth.2730
Raimondo, L., Knapen, T., Oliveira, ĺcaro A.F., Yu, X., Dumoulin, S.O., van der Zwaag, W., Siero, J.C.W., 2021. A line through the brain: implementation of human line-scanning at 7T for ultra-high spatiotemporal resolution fMRI. Journal of Cerebral Blood Flow and Metabolism 41.
Morgan, A.T., Nothnagel, N., Petro, L.S., Goense, J., Muckli, L., 2020. High-resolution line-scanning reveals distinct visual response properties across human cortical layers. bioRxiv.
Figures