0617
Characterisation of laminar spatiotemporal dynamics of CBV and BOLD signals using fast sampling at 7T fMRI in humans1Department of Cognitive Neuroscience, Faculty of Psychology and Neuroscience, Maastricht University, Maastricht, Netherlands, 2Department of Neurophysics, Max-Planck-Institut for Human Cognitive and Brain Science, Leipzig, Germany, 3National institute of Health, Bethesda, DC, United States, 4Brain Innovation B.V., Maastricht, Netherlands, 5Felix Bloch Institute for Solid State Physics, Faculty of Physics and Earth Sciences, Leipzig University, Leipzig, Germany
Synopsis
Keywords: fMRI, Neuroscience
Characterisation of cortical laminar activity requires detailed knowledge of the spatiotemporal haemodynamic response across vascular compartments. Additionally, laminar models of the BOLD-response are dependent on CBF and CBV responses to neural activity. Therefore, we characterised the depth-dependent CBV- and BOLD-haemodynamic responses across varying stimulus durations with 0.9mm spatial, 0.785s effective temporal resolution. Furthermore, we obtained fine-scale vascular details using ME-GRE data at 0.35mm to investigate signal contributions from different vascular compartments. Our results contribute to the understanding of the laminar VASO response, provide guidance for neuroscientific applications, and support modelling of the laminar haemodynamic responses in humans.Purpose
A key feature of mesoscopic scale (<0.5 mm3) brain organization is cortical layers. Recent developments in fMRI techniques have enabled the approximation of activation in distinct layer-compartments (Dumoulin 2018). For the characterization of these layer-dependent fMRI signal changes, detailed knowledge of the underlying spatiotemporal haemodynamic response across vascular compartments is crucial.Vascular Space Occupancy (VASO, Lu 2003; Huber 2014) is the main non-invasive cerebral blood volume (CBV)-sensitive signal available in humans. It has also been used to study cortical depth-dependent signal changes due to its high specificity to the microvasculature. However, the vascular basis of the human VASO signal across a wide range of stimulus durations has not been established on the laminar scale. Furthermore, laminar models of the blood oxygenation level dependent (BOLD) response (e.g. Havlicek 2020) are highly dependent on multi-modal (cerebral blood flow, CBV and BOLD) data to elucidate the complex interplay of vascular responses with neural activity.
Therefore, the purpose of this project is to
- characterise the canonical haemodynamic response function of the layer-dependent VASO signal at high spatiotemporal resolution in humans
- investigate the contribution of arterial and venous compartments to VASO and BOLD responses over time and across cortical depth
- measure how the relative contribution of these compartments depends on stimulus duration
Methods
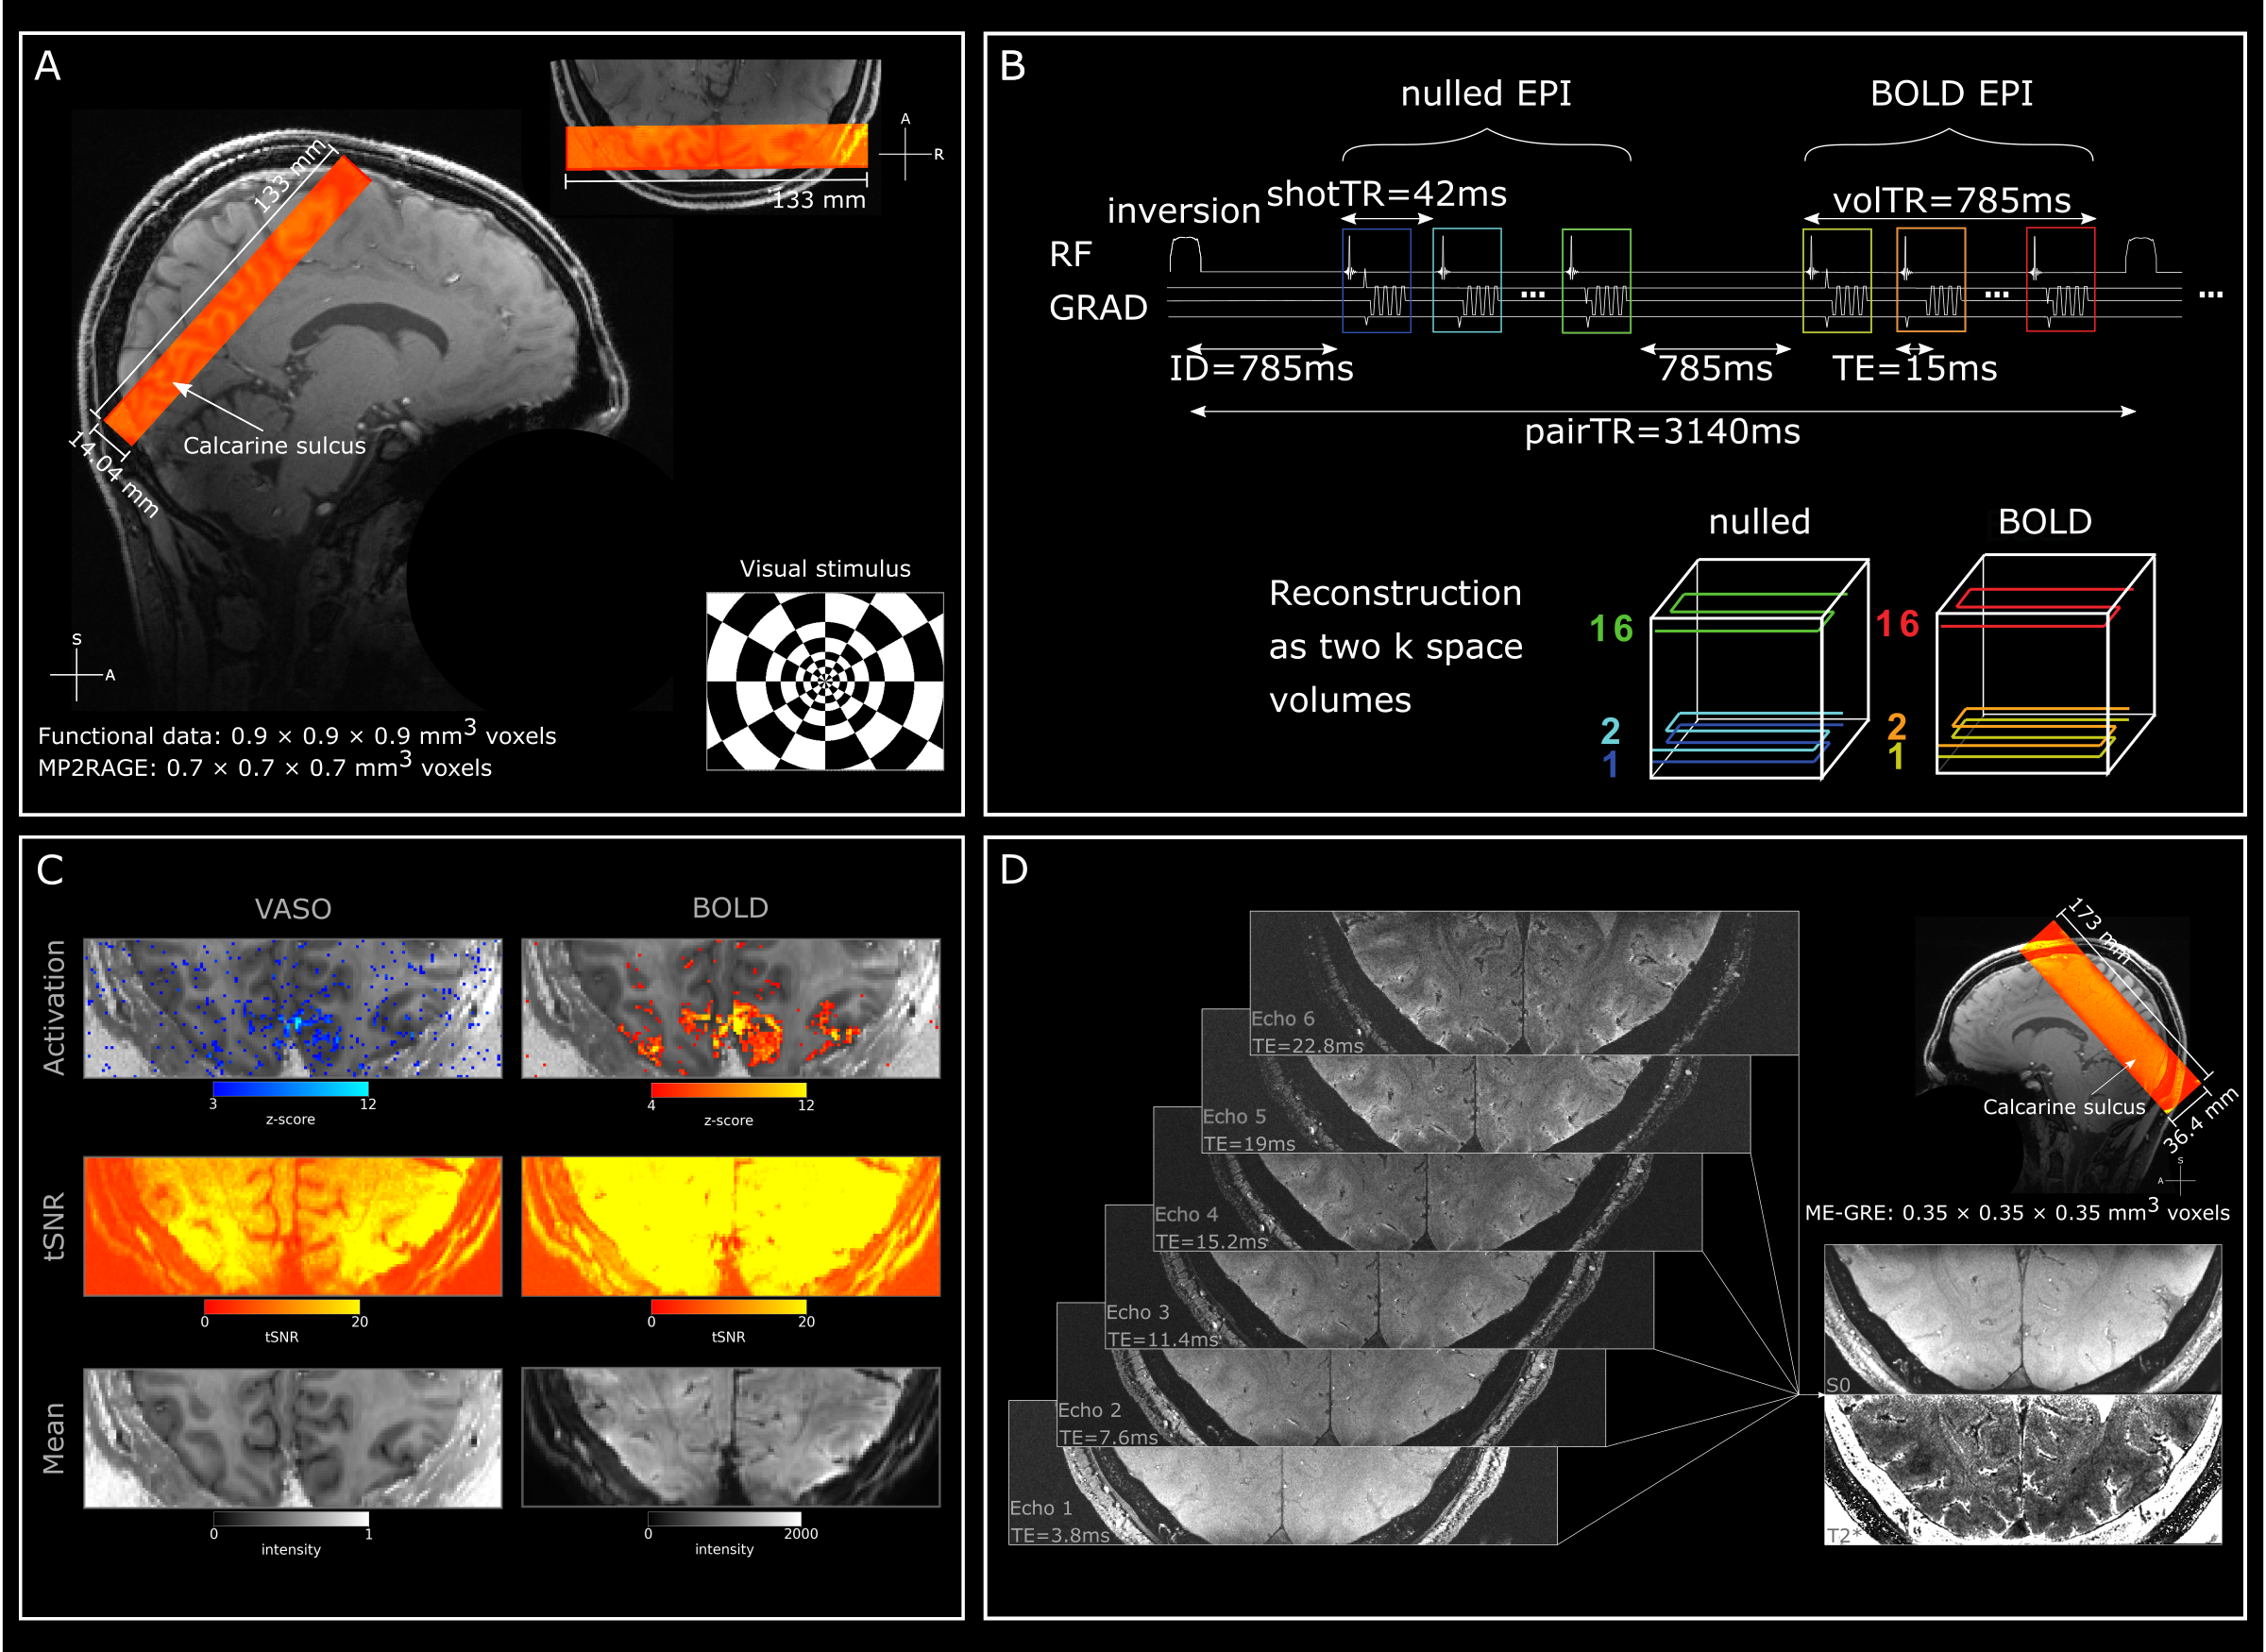
Data-acquisition: 4 neurologically healthy participants (2 female, age range: 22-35 mean: 25.75) underwent 3-5 scanning sessions (~90 min, each) using a 7T MRI scanner (Magnetom Terra, Siemens Healthineers, Erlangen, Germany), equipped with a 8Tx, 32Rx RF head coil. Functional scans were performed in 4 sessions with a 3D-EPI sequence (Stirnberg and Stöcker, 2021), slice-selective slab-inversion (SS-SI) VASO preparation (Huber, 2021; version26dc5a59) and a nominal resolution of 0.9mm isotropic (16 slices TI1/TI2/TR1/TE = 1047/2462/42/15ms (see F1B), partial Fourier factor=6/8, reference flip angle=33°, 3-fold CAIPIRINHA acceleration in z-direction (shift=1), bandwidth=1126Hz/Px, FoV=133mm; Fig1A&B). Slice position and orientation were chosen individually and covered the calcarine sulci (Fig1A). In a fifth session, we acquired 4 ME-GRE images at 0.35mm isotropic resolution (104 slices; TEs=3.8, 7.6, 11.4, 15.2, 19, 22.8ms; TR=30ms, no partial Fourier, flip angle=12°, GRAPPA factor for in-plane phase encoding=2; bandwidth=310Hz/Px, FoV=173mm, matrix=496x496; volume acquisition time=13 min, Fig1D). Here, we rotated the phase-encoding orientation by 90° between acquisitions for blood motion artifact mitigation (Gulban 2022). Finally, whole-brain images (0.7mm isotropic) were acquired in 2 of the sessions using MP2RAGE (Marques, 2010).Paradigm: In a total of 15-24 runs in 3-4 sessions per participant, flickering checkerboards (Fig1A) were presented (8Hz) for 1, 2, 4, 12 and 24 seconds. Stimulus onset was jittered 4 fold with respect to the TR, resulting in an effective stimulus sampling of 0.785s. Each stimulus duration was presented once per jitter and run. In 2 sessions, rest durations were 10, 12, 14, 20, and 24 seconds. In 2 other sessions, rest durations were 20, 22, 24, 30, and 40 seconds.
Data-processing: Motion-correction was performed in antsPy (Avants 2008; v0.3.3), initial tissue segmentation using FSL FAST (Zhang 2001; v6.0.5), manual edits of tissue segmentation in ITK-SNAP (Yushkevich 2006; v3.8.0), GLM in nilearn (Abraham 2014; v0.9.1), layering using LayNii LN2_LAYERS program (Huber, 2021; v2.2.1). ROIs were generated at upsampled resolution (0.175mm isotropic) based on the anatomical location of the calcarine sulcus. Scripts are available at: https://tinyurl.com/57shv9sa
Results and discussion
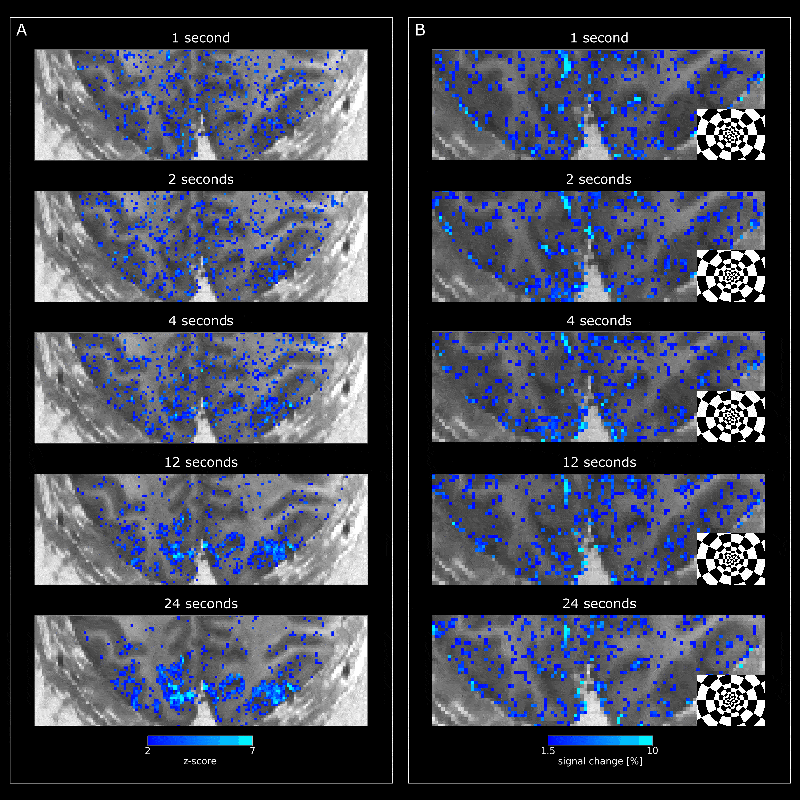
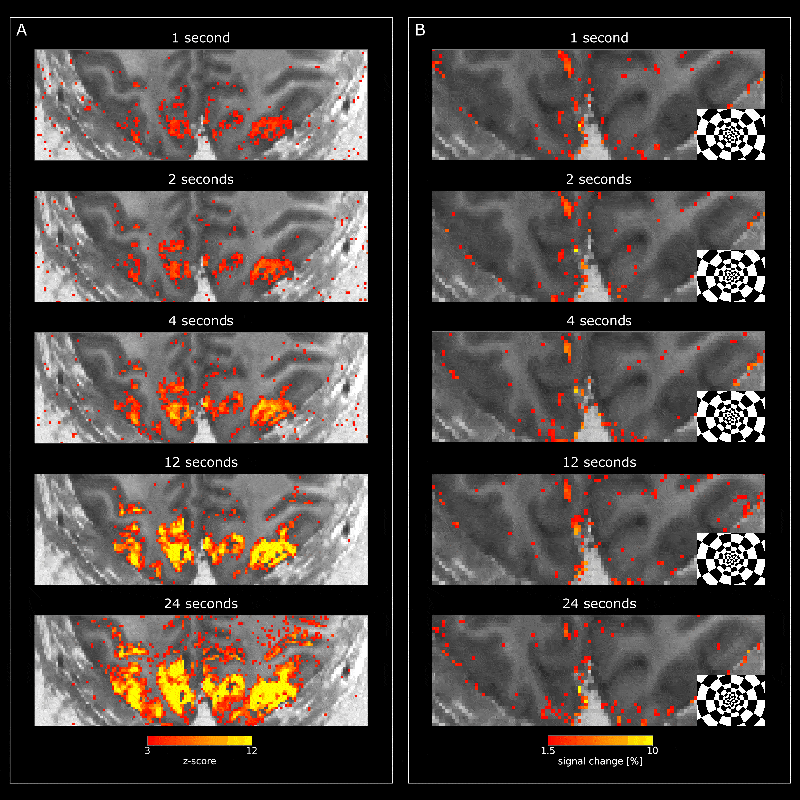
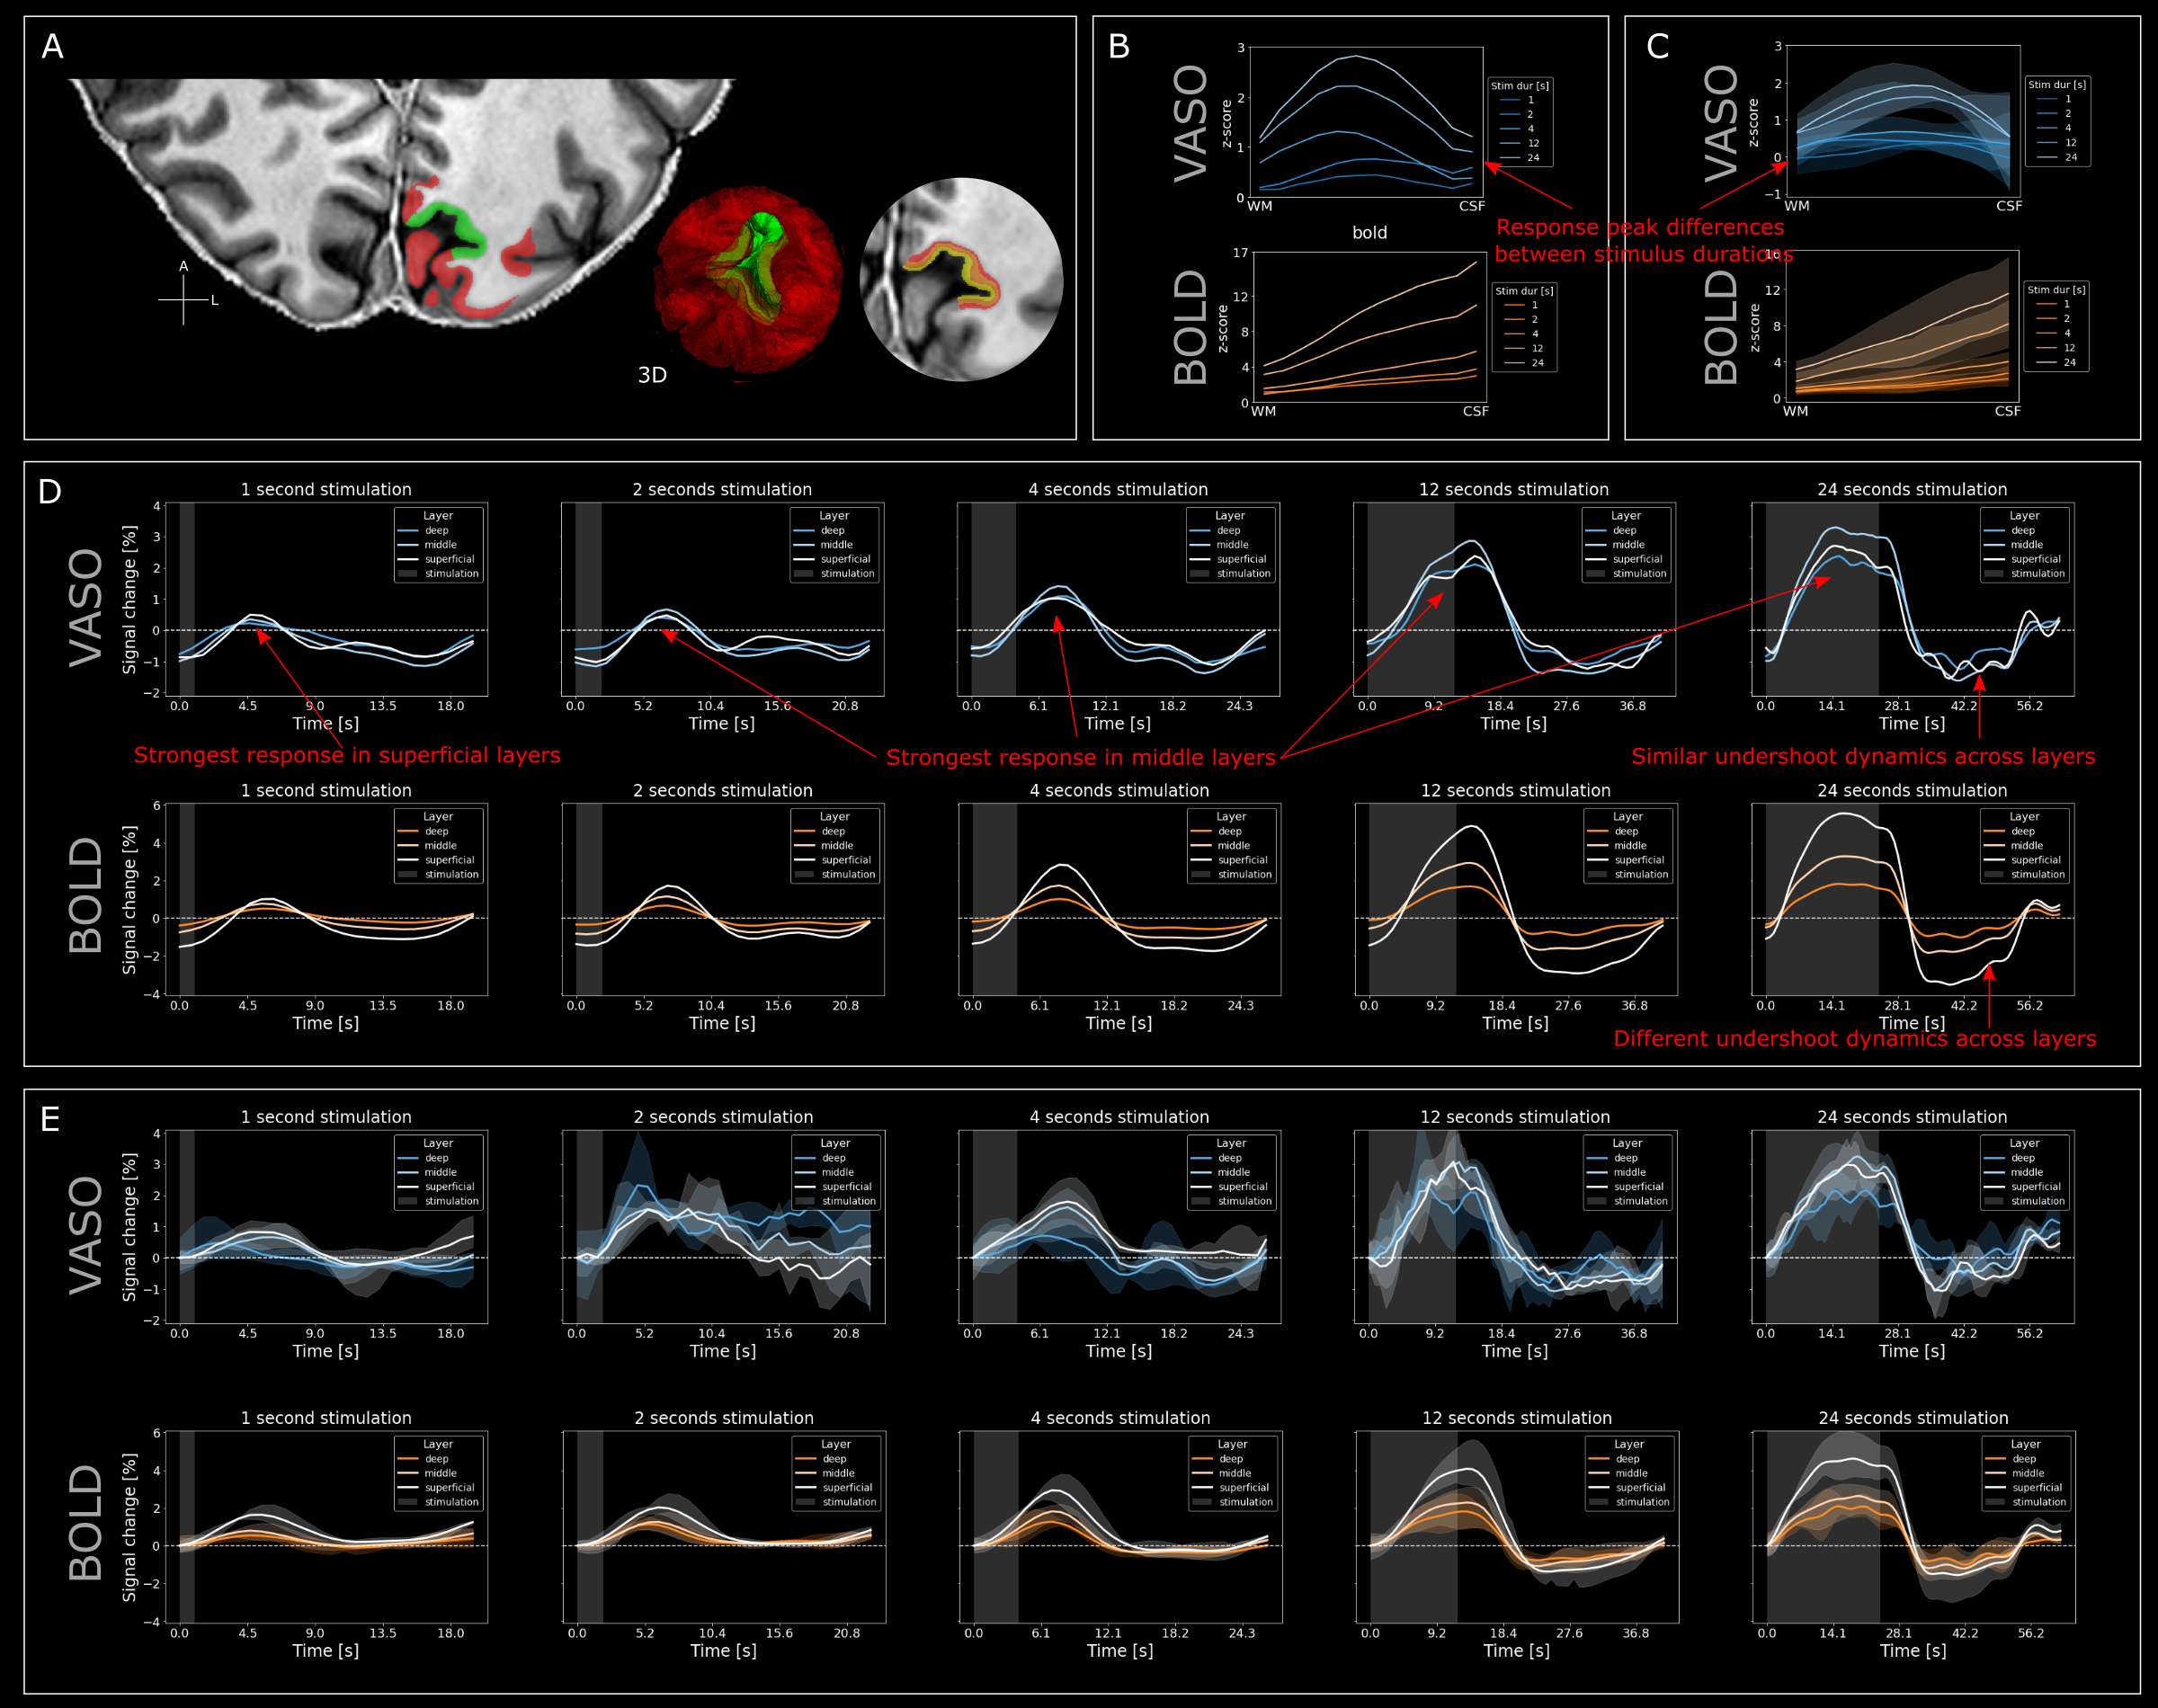
Visual stimulation evoked strong responses in visual cortices for VASO (Fig2) and BOLD (Fig3). Activation amplitudes increased with stimulus duration for both modalities, as expected. While the VASO signal dynamics for short stimulation durations show mostly changes in vessel-like structures (elongated clusters of voxels in CSF), longer stimulation periods evoke responses mainly centered in gray matter (Fig2B). For BOLD, strong responses can be observed in CSF for all stimulus durations (Fig3).Similar features can be observed in the depth-resolved plots (Fig4). Layer profiles of activation scores (Fig4B&C) and event-related averages (Fig4D&E top row) show strongest VASO responses in the superficial layers for stimuli with a duration of <1-4s. This likely reflects a larger macrovascular contribution with short stimulation. Longer stimulus durations evoked strongest responses in middle layers, which became more pronounced with increasing stimulus duration.
Furthermore, the temporal dynamics of the BOLD post-stimulus undershoot were strongest in the superficial layers and decreased with cortical depth. On the other hand the VASO post-stimulus undershoot seems to be independent of cortical depth.
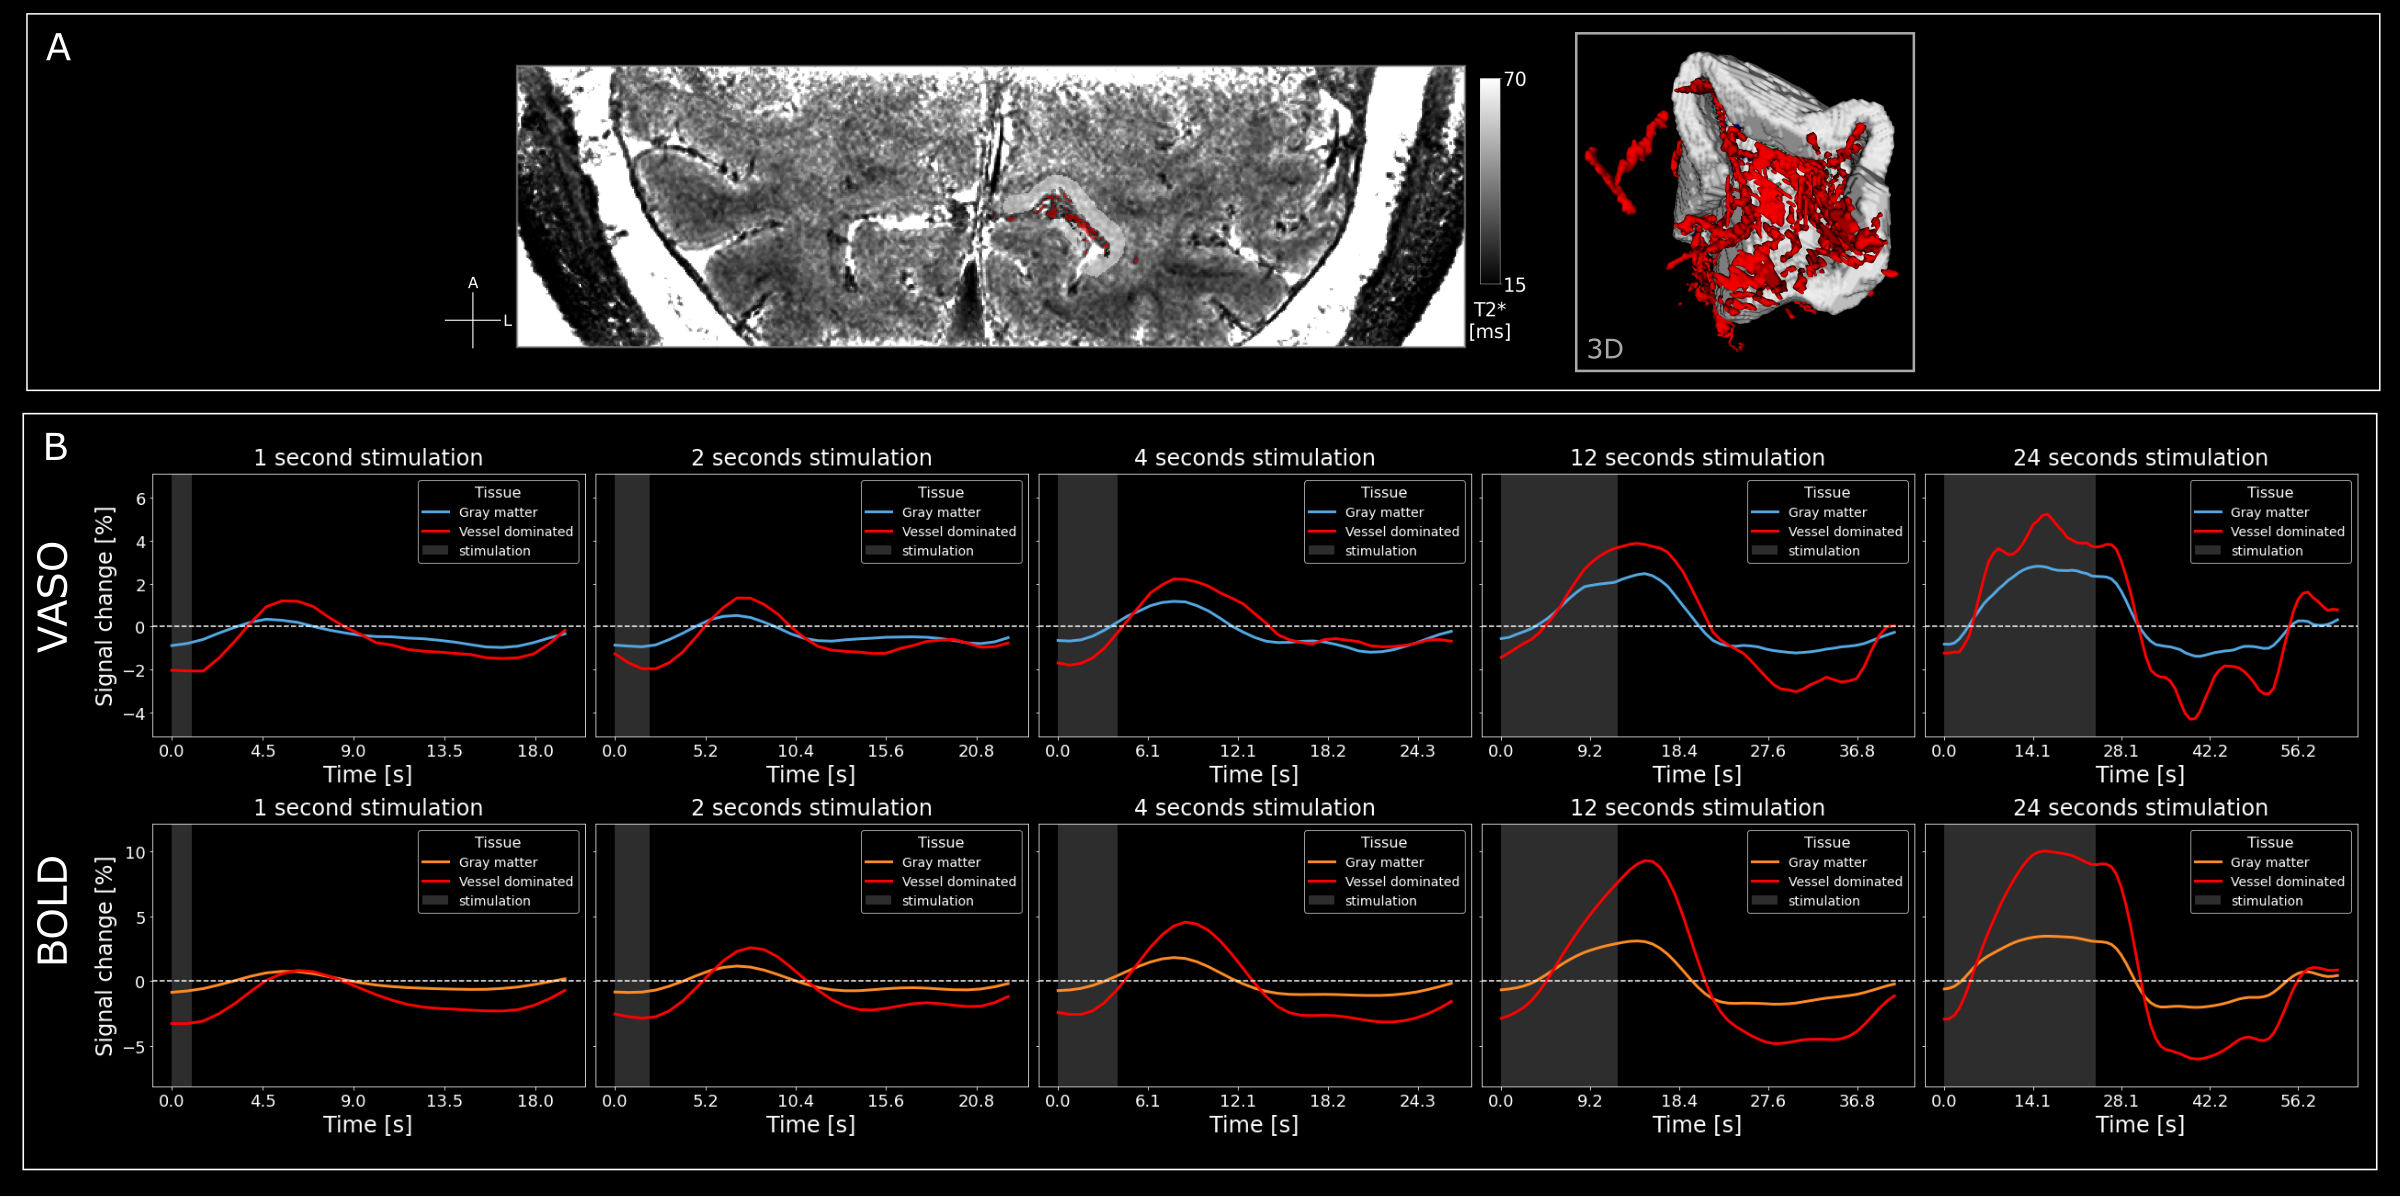
In order to investigate VASO and BOLD signal changes in different tissue types, we manually delineated vascular structures based on the ME-GRE data (Fig5A). Vessel-dominated signal changes show delayed onset and peak times compared to signals originating predominantly from gray matter (Fig5B).
Summary and Conclusion
We characterized the spatiotemporal dynamics of CBV and BOLD responses across cortical depth and vessel dominated voxels at 0.9mm spatial, 0.785s effective temporal resolution and up to 7.5h of scanning per participant. Crucially, we showed differences in vascular weighting of CBV signal changes for different stimulus durations, which is fundamental for future neuroscientific applications of VASO. Furthermore, we found differences in signal dynamics across time, space and stimulus duration for VASO and BOLD, which might inform laminar models of the haemodynamic response. Finally, we found strong VASO signal changes in superficial, vessel-dominated voxels, which gives fundamental insights into mechanisms of the VASO contrast.Acknowledgements
Sequence: We thank Rüdiger Stirnberg and Tony Stöcker from DZNE in Bonn for sharing, optimizing, and supporting us with the 3D-EPI VASO sequence used here.
Help with scanning: We would like to thank the medical technical assistants at the Max Planck Institute for Human Cognitive and Brain Sciences in Leipzig for their help with participant planning and handling.
Funding: SD is supported by the ‘Robin Hood’ fund of the Faculty of Psychology and Neuroscience and the department of Cognitive Neuroscience. RG is partly funded by the European Research Council Grant ERC-2010-AdG269853 and Human Brain Project Grant FP7-ICT-2013-FET-F/604102. OFG is funded by Brain Innovation. NW has received funding from the European Research Council under the European Union's Seventh Framework Programme (FP7/2007-2013) / ERC grant agreement n° 616905; from the European Union's Horizon 2020 research and innovation programme under the grant agreement No 681094; from the Deutsche Forschungsgemeinschaft (DFG, German Research Foundation) – project no. 347592254 (WE 5046/4-2); from the Federal Ministry of Education and Research (BMBF) under support code 01ED2210. AP is funded by the EU-project H2020-860563 euSNN
Ethics: The scanning procedures have been approved by the Ethics Committee of the Medical Faculty of Leipzig University.
References
- Abraham, A., Pedregosa, F., Eickenberg, M., Gervais, P., Mueller, A., Kossaifi, J., ... & Varoquaux, G. (2014). Machine learning for neuroimaging with scikit-learn. Frontiers in neuroinformatics, 14.
- Avants BB, Epstein CL, Grossman M, Gee JC. Symmetric diffeomorphic image registration with cross-correlation: Evaluating automated labeling of elderly and neurodegenerative brain. Med Image Anal. 2008;12(1):26-41.
- Dumoulin, S. O., Fracasso, A., van der Zwaag, W., Siero, J. C. W., & Petridou, N. (2018). Ultra-high field MRI: Advancing systems neuroscience towards mesoscopic human brain function. NeuroImage, 168(September 2016), 345–357.
- Gulban, O. F., Bollmann, S., Huber, R., Wagstyl, K., Goebel, R., Poser, B. A., ... & Ivanov, D. (2022). Mesoscopic in vivo human T2* dataset acquired using quantitative MRI at 7 Tesla. Neuroimage (in press).
- Havlicek, M., & Uludağ, K. (2020). A dynamical model of the laminar BOLD response. NeuroImage, 204, 116209.
- Huber, L., Ivanov, D., Krieger, S. N., Streicher, M. N., Mildner, T., Poser, B. A., ... & Turner, R. (2014). Slab‐selective, BOLD‐corrected VASO at 7 Tesla provides measures of cerebral blood volume reactivity with high signal‐to‐noise ratio. Magnetic resonance in medicine, 72(1), 137-148.ISO 690
- Kim, T., & Kim, S. G. (2011). Temporal dynamics and spatial specificity of arterial and venous blood volume changes during visual stimulation: implication for BOLD quantification. Journal of Cerebral Blood Flow & Metabolism, 31(5), 1211-1222.
- Lu, H., Golay, X., Pekar, J. J., & Van Zijl, P. C. (2003). Functional magnetic resonance imaging based on changes in vascular space occupancy. Magnetic Resonance in Medicine: An Official Journal of the International Society for Magnetic Resonance in Medicine, 50(2), 263-274.
- Marques, J. P., Kober, T., Krueger, G., van der Zwaag, W., Van de Moortele, P. F., & Gruetter, R. (2010). MP2RAGE, a self bias-field corrected sequence for improved segmentation and T1-mapping at high field. NeuroImage, 49(2), 1271–1281.
- Stirnberg, R., & Stöcker, T. (2021). Segmented K-space blipped-controlled aliasing in parallel imaging for high spatiotemporal resolution EPI. Magnetic resonance in medicine, 85(3), 1540-1551.
- Yushkevich, P. A., Piven, J., Hazlett, H. C., Smith, R. G., Ho, S., Gee, J. C., & Gerig, G. (2006). User-guided 3D active contour segmentation of anatomical structures: significantly improved efficiency and reliability. Neuroimage, 31(3), 1116-1128.
- Zhang, Y., Brady, M., & Smith, S. (2001). Segmentation of brain MR images through a hidden Markov random field model and the expectation-maximization algorithm. IEEE transactions on medical imaging, 20(1), 45-57.
Figures