0616
Investigating the origin of negative BOLD responses using laminar CBF, CBV, T2 BOLD and CMRO2 fMRI in human visual cortex at 7T1Laboratory of FMRI Technology (LOFT), Mark & Mary Stevens Neuroimaging and Informatics Institute, Keck School of Medicine, University of Southern California, Los Angeles, CA, United States, 2Department of Neuroscience, Baylor College of Medicine, Waco, TX, United States
Synopsis
Keywords: fMRI (task based), High-Field MRI, multi-contrast, ASL, VASO, T2 BOLD, CMRO2
We proposed a 7T laminar concurrent ASL, VASO and BOLD fMRI sequence to obtain quantitative CBF, CBV, T2-BOLD and CMRO2 measurements with high resolution and specificity to detect layer-dependent vascular and metabolic activities. Ipsilateral visual stimuli (eccentricity of 4°–6°) induced ring-shaped BOLD and CBF signal increase on cortical surface corresponding to the pattern of visual stimulus while decreased BOLD/CBF signals can be seen in adjacent fovea regions. In negative BOLD response (NBR) regions, moderate decrease in T2-BOLD and CBV signals and strong CBF and CMRO2 decreases especially in deep cortical layers were observed, suggesting suppressed neuronal activities in NBR regions.Background
The origin of the negative BOLD responses (NBR) remains controversial. NBR can either reflect the suppression of neuronal activity (1) or purely a vascular mechanism (‘blood steal’) (2). Concurrent measurement of cerebral blood flow (CBF), cerebral blood volume (CBV), blood-oxygenation-level-dependent (BOLD) and cerebral metabolic rate of oxygen (CMRO2) signals would be a valuable tool to investigate the underlying vascular variations and metabolic activities across cortical layers (3). Ultrahigh field arterial spin labeling (ASL) has the dual benefits of long tracer half-life determined by blood T1 (4) and high SNR (5). We developed a novel pulse sequence to simultaneously acquire ASL CBF, vascular space occupancy (VASO) (6) and T2 BOLD signals with high spatial resolution at 7T and detected ‘double-peak’ activations induced by finger-tapping in human primary motor cortex (M1) (7). In this study, we propose to characterize concurrent layer-dependent CBF, CBV, T2-BOLD and CMRO2 signal changes associated with NBR on the visual cortex.Method
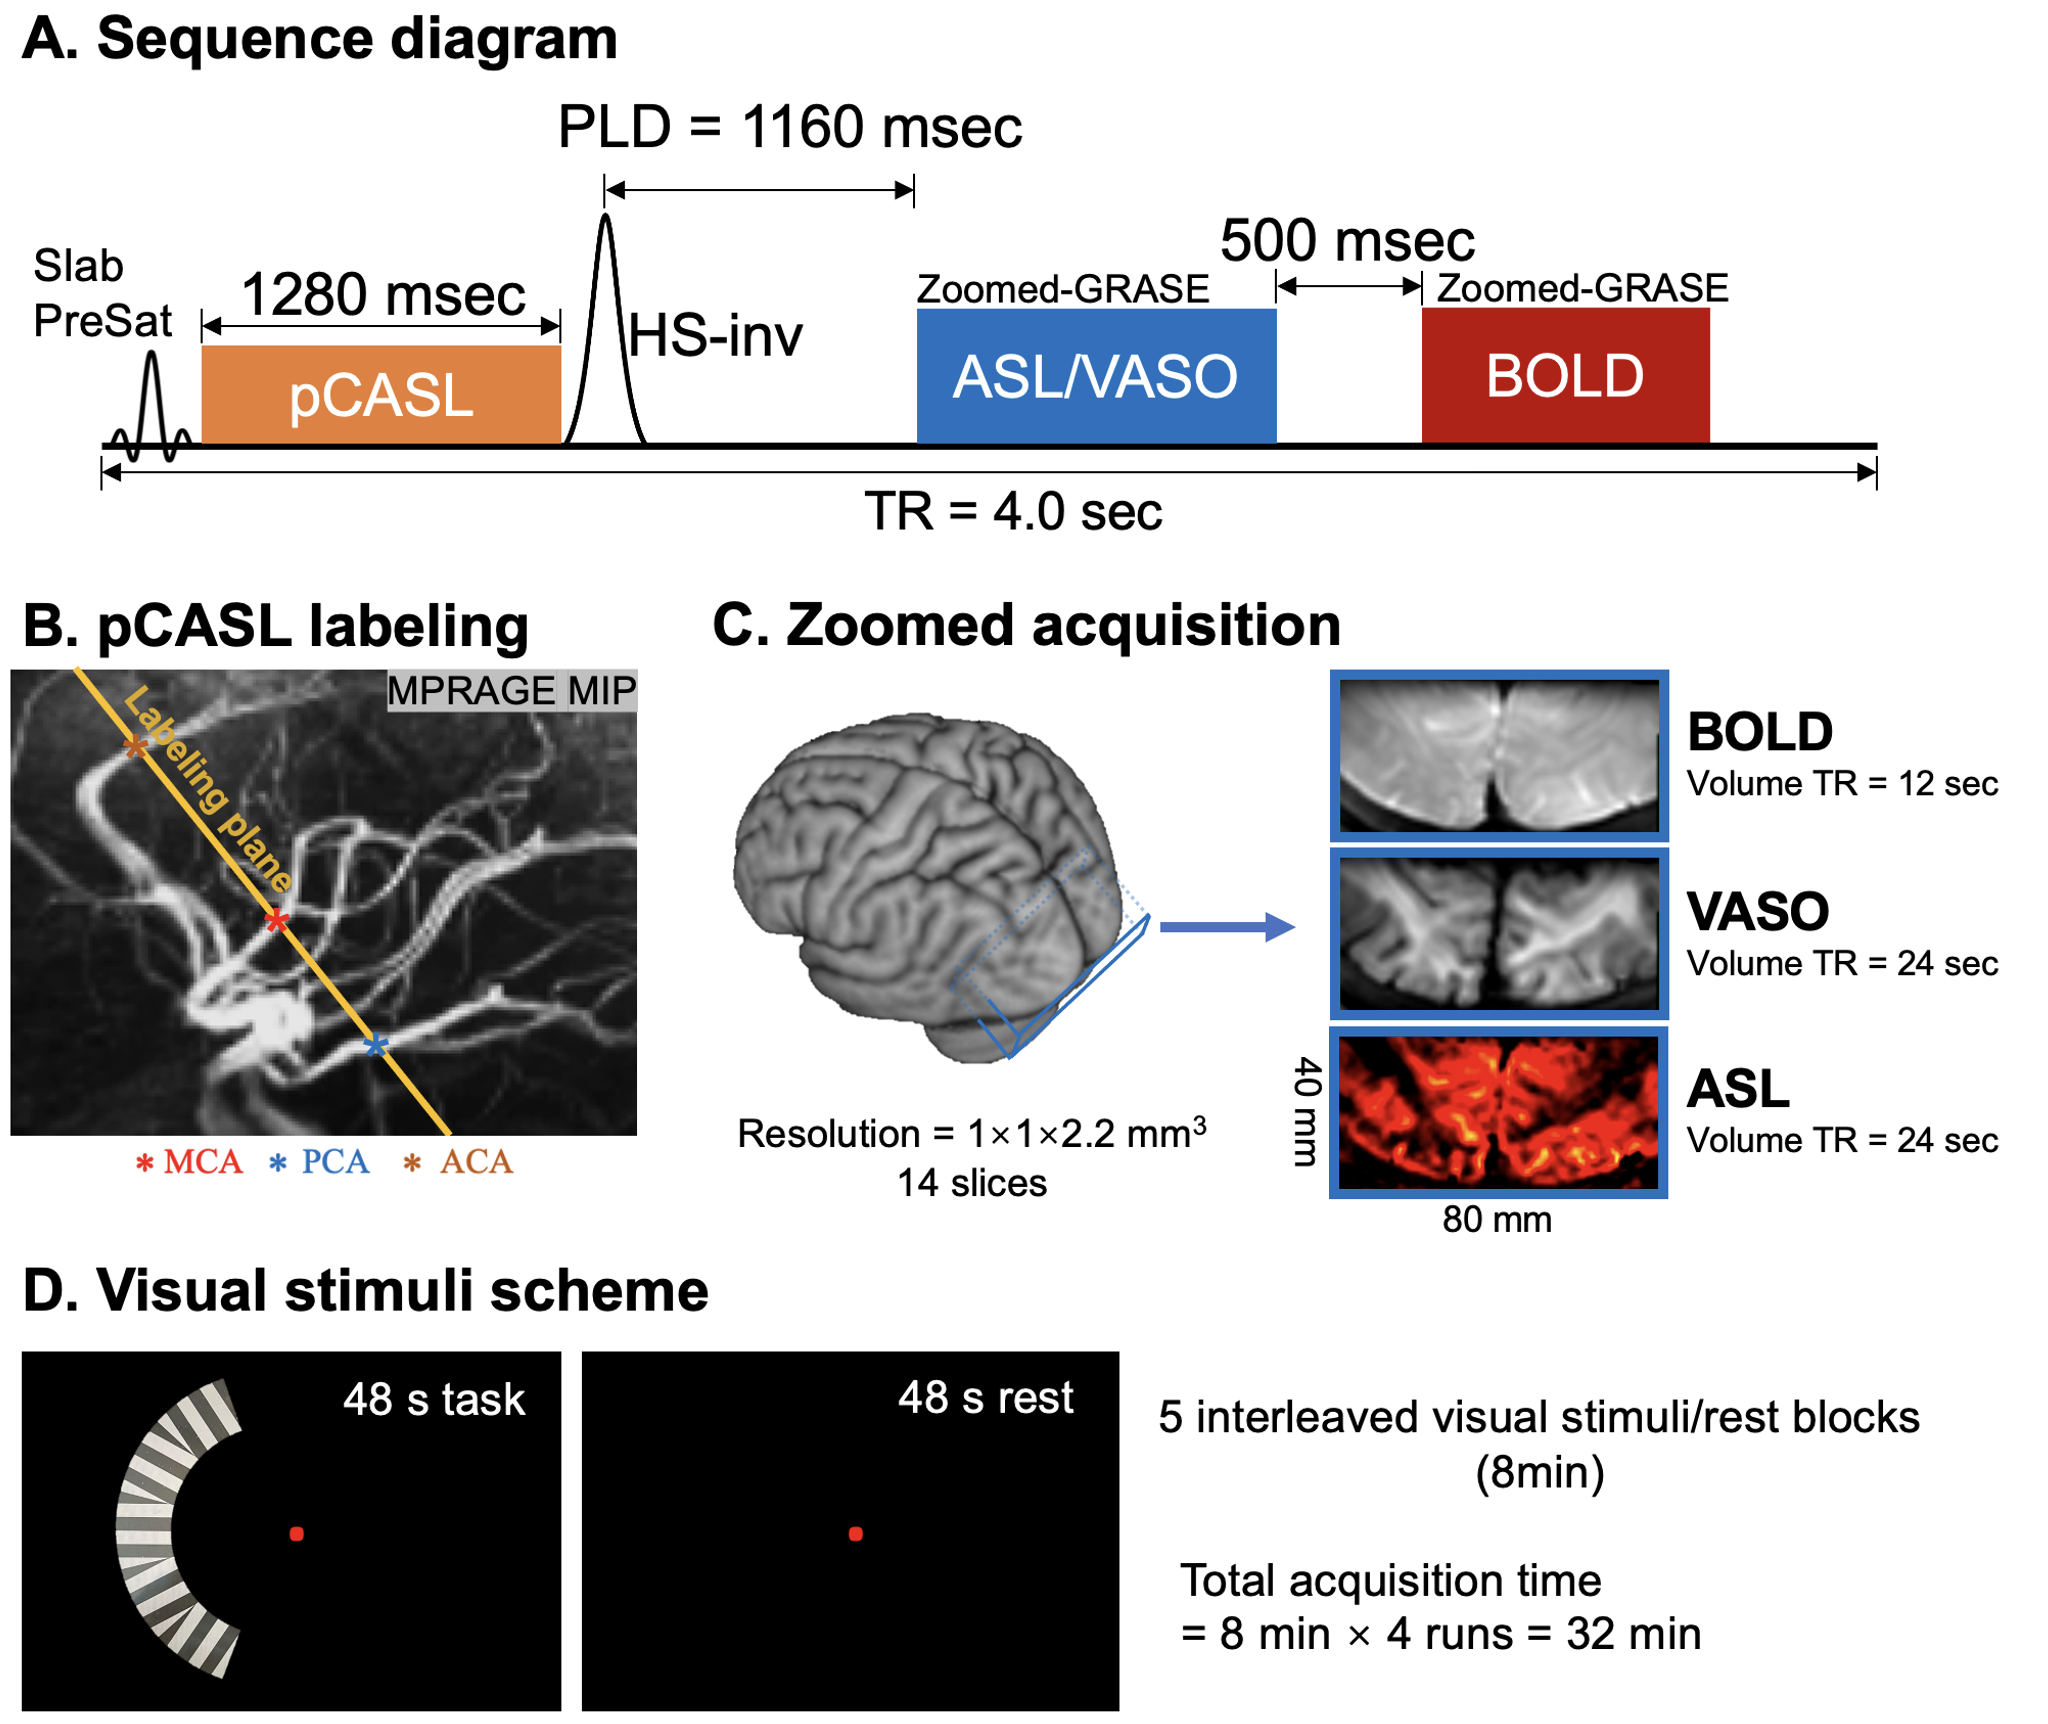
Three subjects (2 females, age=24±1.7years) underwent MRI scans on a Siemens 7T Terra scanner with a NOVA 1Tx/32Rx head coil. Sequence diagram for concurrent CBF/VASO/BOLD measurement is shown in Fig.1A. A non-selective HS-inversion pulse (efficiency=87% (8)) was added after pCASL pulse train to suppress background signal and generate VASO contrast. Control images acquired at post-labeling delay (PLD)=1160msec exhibit VASO contrast due to nulled in-flow blood signal (T1,blood=2.1s). T2-BOLD signals were acquired 500 msec after the ASL/VASO acquisition.The pCASL labeling plane was placed above the circle of Willis (CoW) and perpendicular to the posterior cerebral artery (PCA) (Fig.1B) with assist of intracranial vasculature revealed by maximal-intensity-projection (MIP) of the MP2RAGE (0.7mm3). Gradient-and-spin-echo (GRASE) readout with inner-volume excitation was used to acquire a zoomed imaging volume covering the visual cortex (Fig. 1C). Imaging parameters were: FOV=80×40mm2, 14 slices, 1-mm2 in-plane resolution, 2.2mm slice thickness, 3 segments along phase direction, TE=17.2ms, labeling duration=1280ms, TR=4000ms. Volume TR was 24s for one CBF and VASO image, and 12s for one BOLD image (Fig.1C).
Visual stimulus consisted of a mean-gray background and a unilateral sector subdivided into five subsectors covering an eccentricity of 4°–6° displayed in the left hemifield (Fig. 1D). Each subsector contained a high-contrast (100%) radial grating (1 cpd) that reversed contrast at 4Hz. Each run consisted of five blocks of 48s visual stimulus followed by 48s rest, and four runs were acquired in 32 mins.
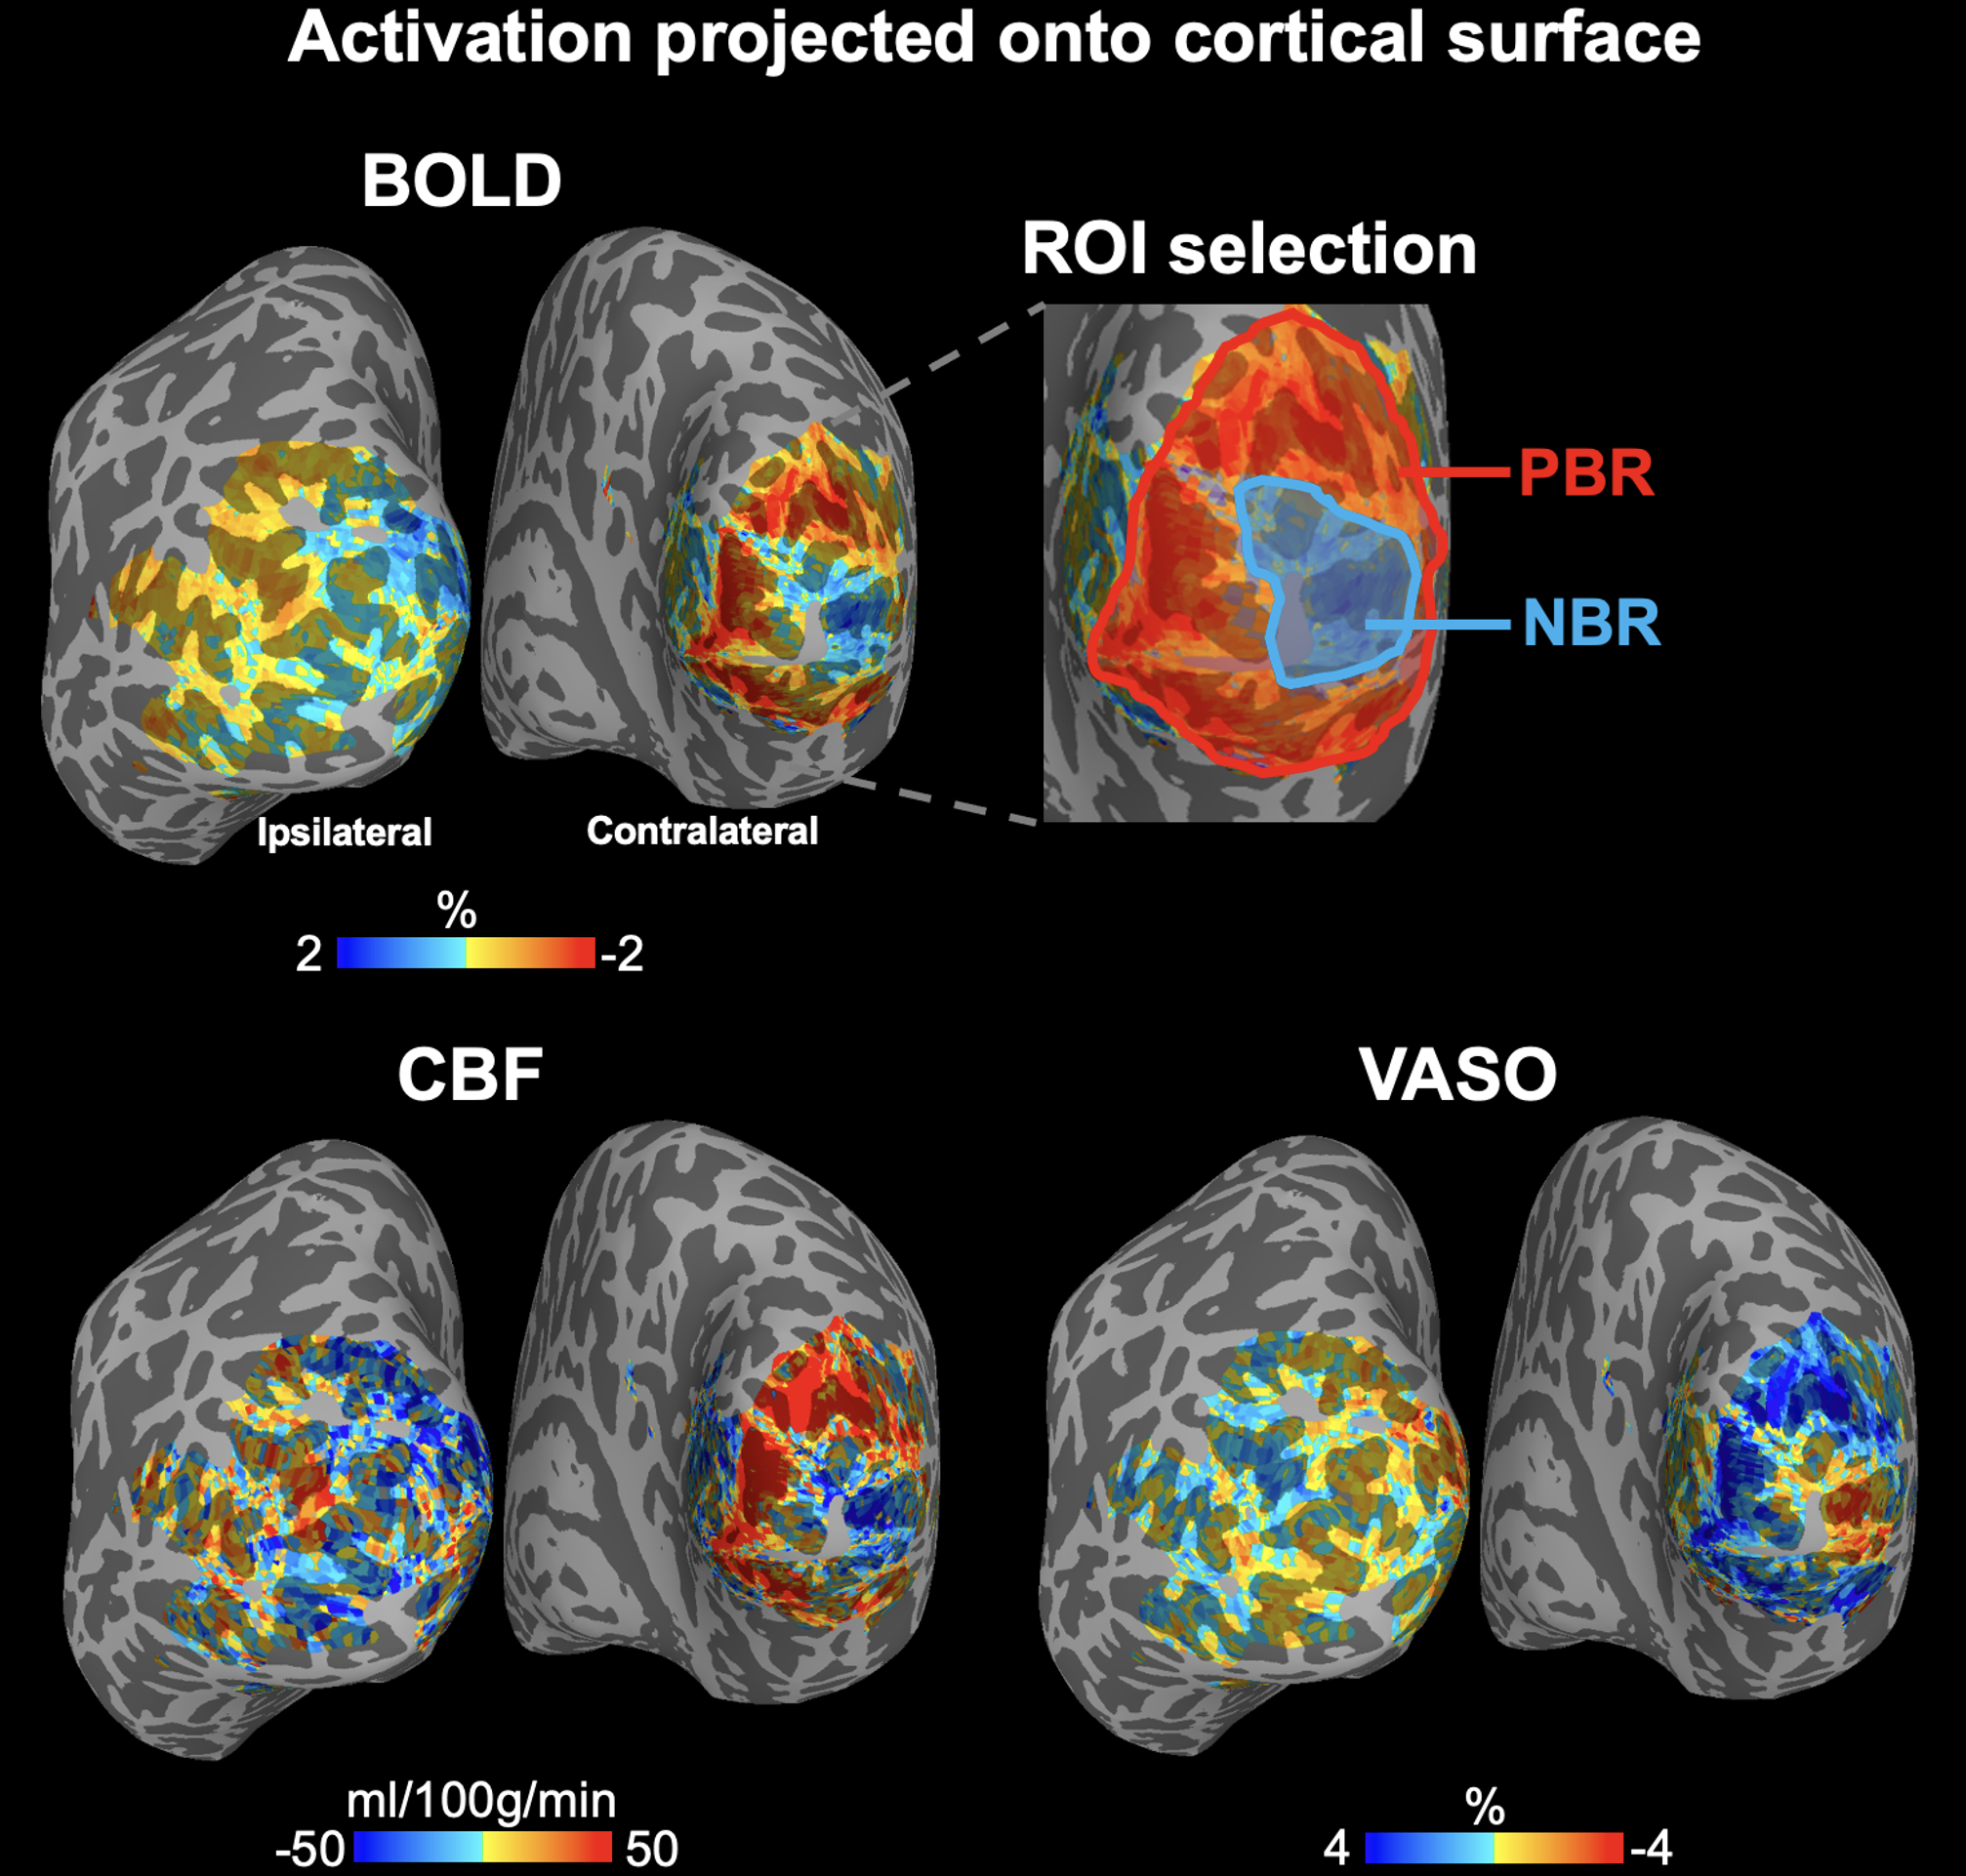
Control and label images were subtracted to obtain perfusion images and CBF was calculated according to (9) with labeling efficiency = 82.1% (10). VASO signals were divided by BOLD signals to minimize venous contamination (6). CBV and CMRO2 changes were calculated from ASL/VASO/BOLD signals according to Lu et al (11). MP2RAGE volume was skull stripped and segmented into WM, GM and CSF using FreeSurfer. AFNI/SUMA and custom python codes were used to generate the equi-volume surfaces (https://github.com/herrlich10/mripy) between WM and pial surfaces. 10 cortical layers were then projected back to volume space for analysis. ROIs of positive BOLD responses (PBR) and NBR were manually drawn on surface (Fig.3 top) based on BOLD signals.
Results and discussion
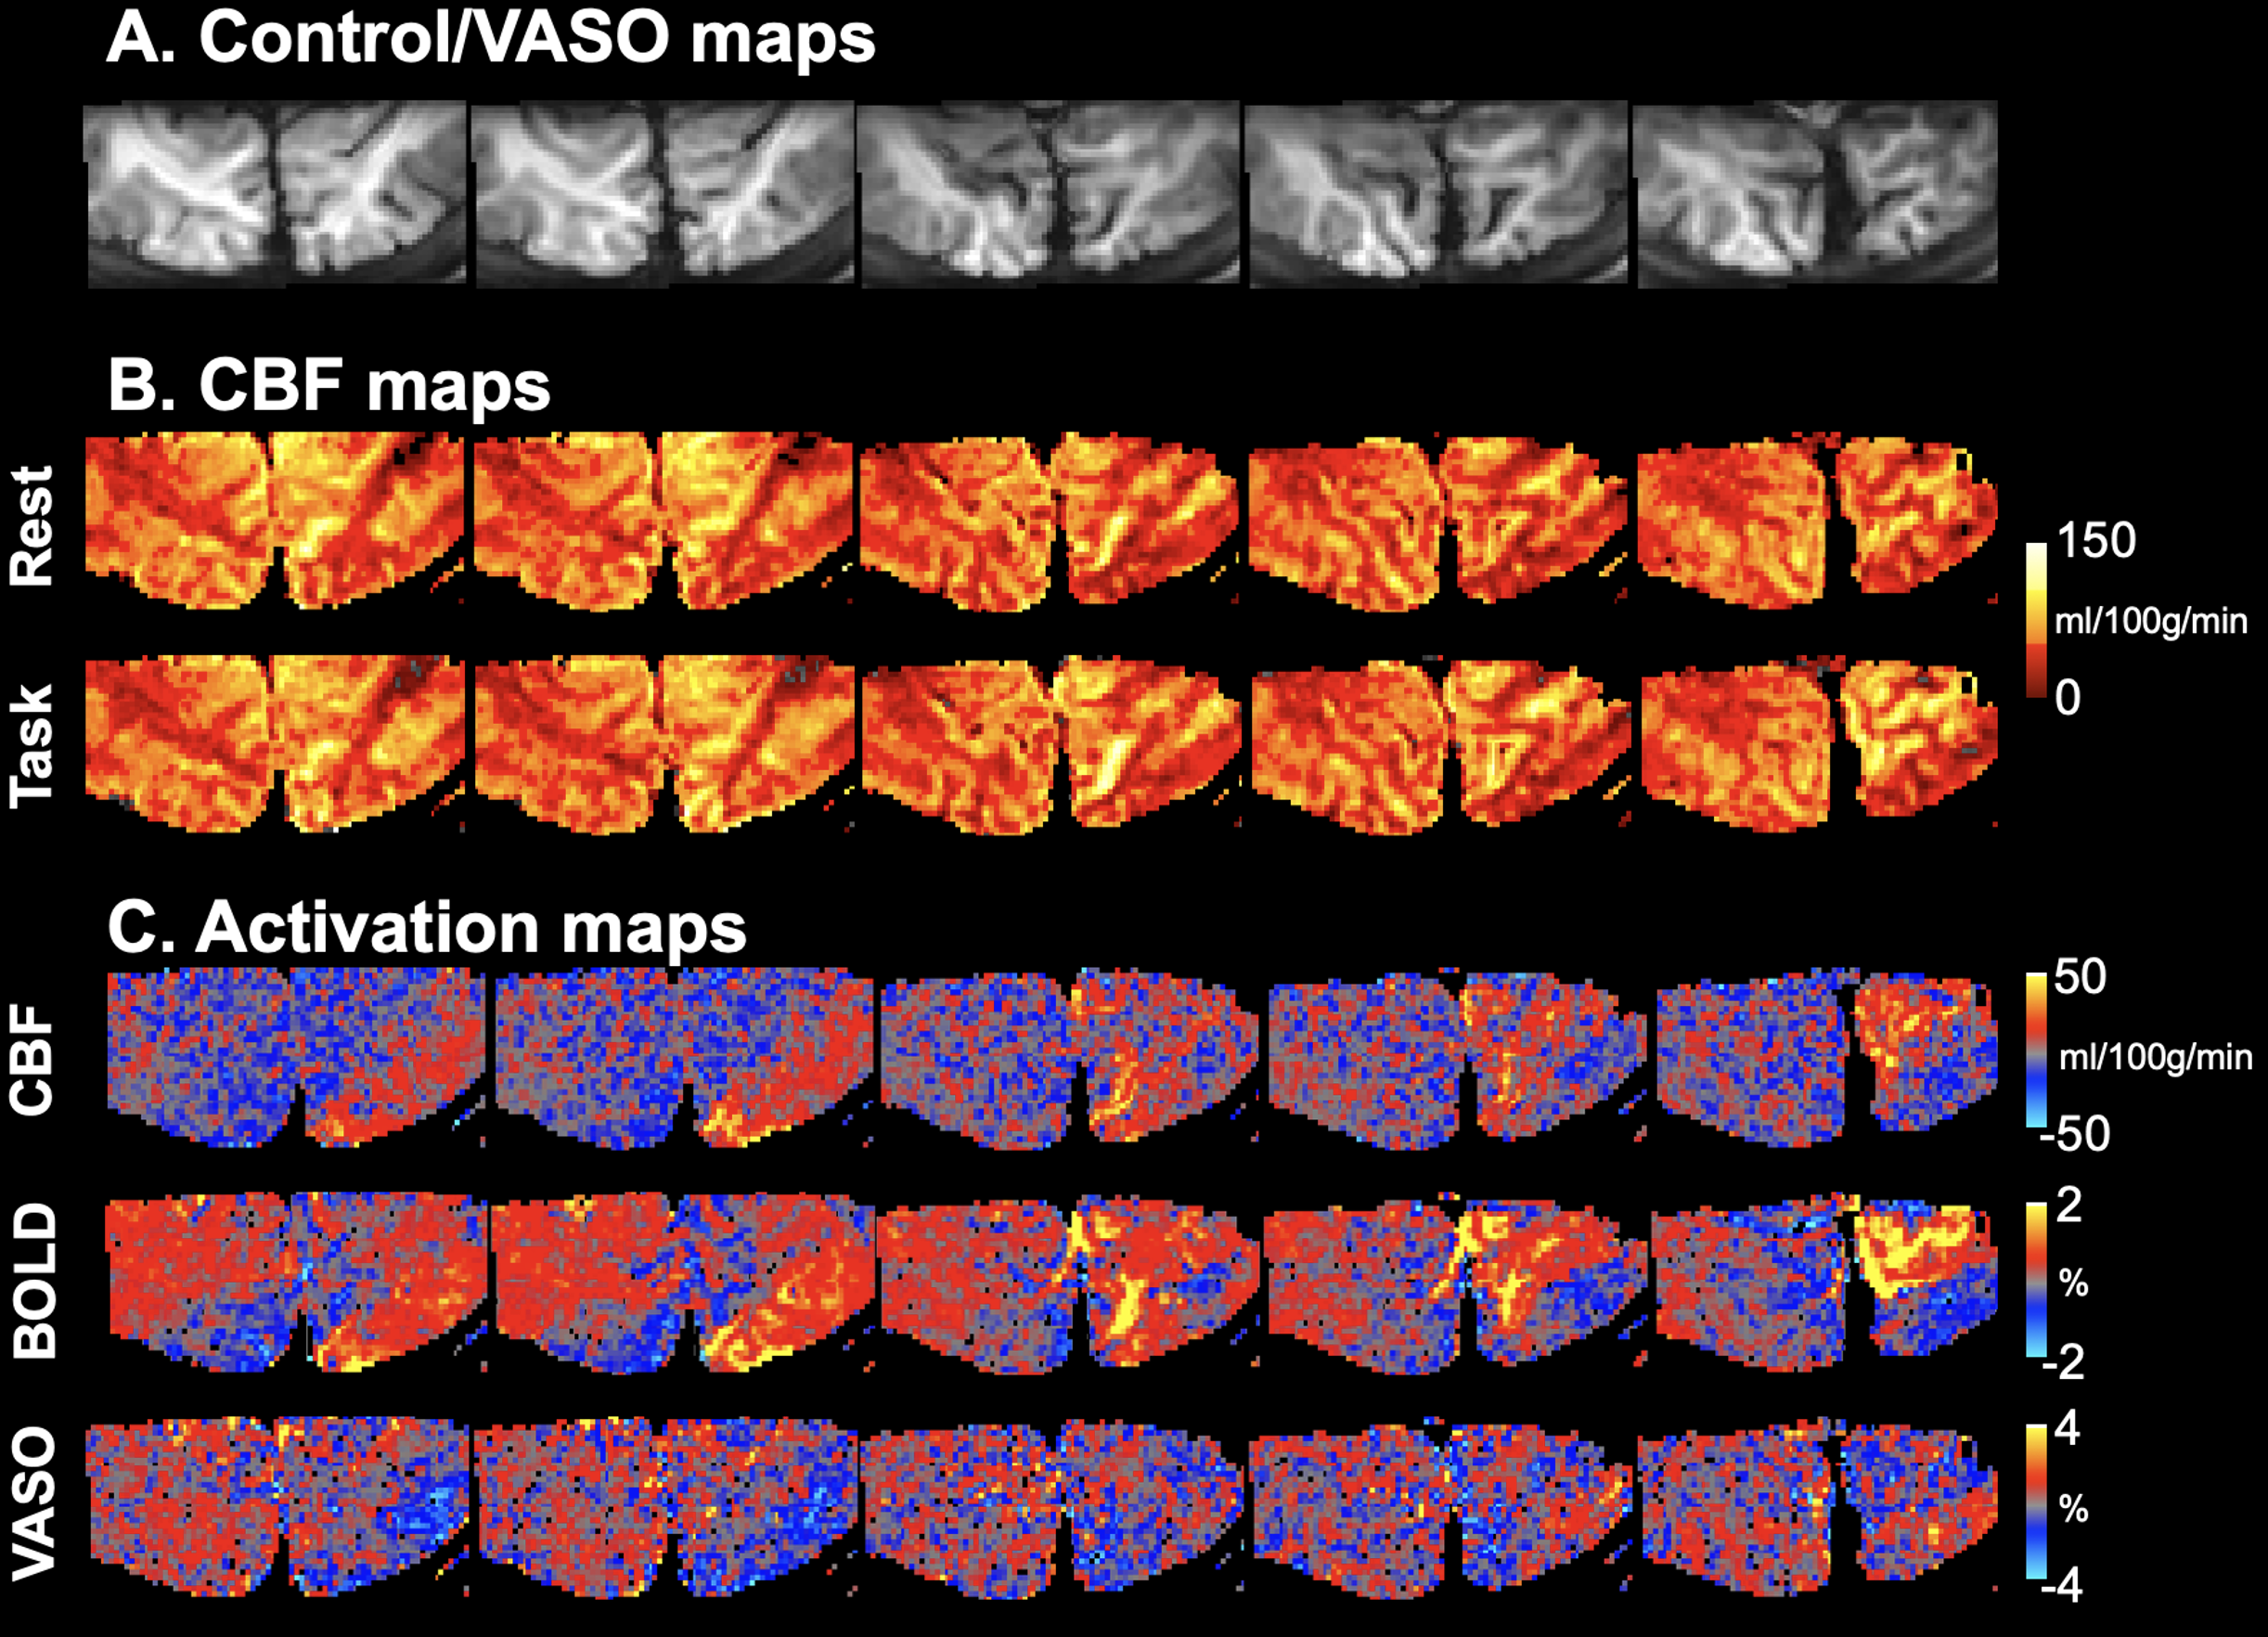
Fig. 2 shows five representative slices of control/VASO images (A) and CBF maps at rest and task (B). Ipsilateral visual stimuli induced CBF, BOLD and VASO signal changes are shown in Fig. 2C. Similar activation patterns can be observed in CBF and BOLD maps, and opposite responses were observed in VASO maps. NBR can be observed on the contralateral (right) hemisphere adjacent to PBR regions.Fig. 3 shows BOLD/CBF/VASO activation maps projected onto the cortical surface. Ring-shaped BOLD and CBF signal increase corresponding to the pattern of visual stimulus can be observed on the contralateral (right) hemisphere while decreased BOLD/CBF signals can be seen in adjacent fovea regions. Similar activation pattern was observed in VSAO maps with opposite responses.
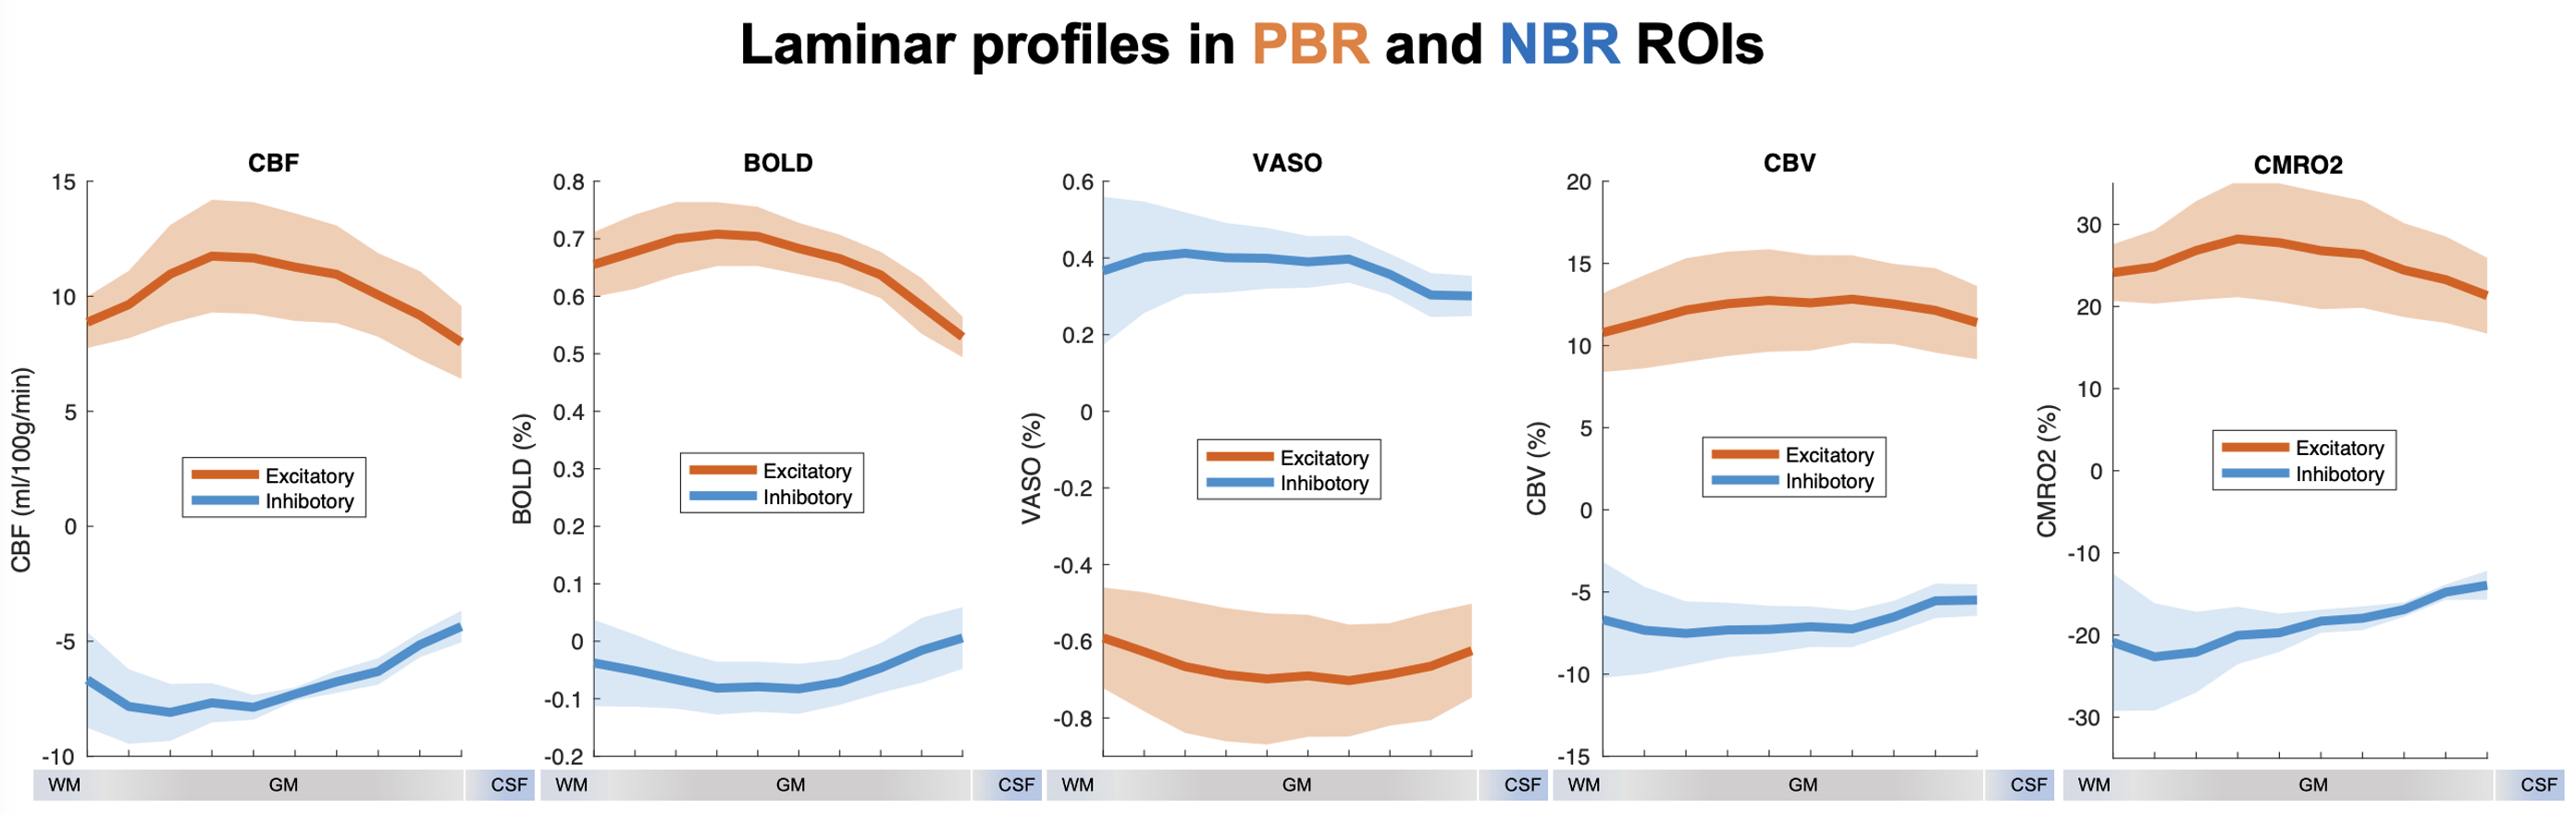
Fig. 4 shows laminar profiles of CBF, BOLD, VASO, CBV and CMRO2 signal changes in PBR and NBR ROIs obtained from three subjects. Visual stimuli induced 19.6±2.3% CBF increase, 0.7±0.1% T2-BOLD increase, 0.7±0.4% VASO decrease, 12.1±0.7% CBV increase and 25.4±2.2% CMRO2 increase across cortical layers, while 13.9±2.7% CBF decrease, 0.05±0.03% T2-BOLD decrease, 0.37±0.04% VASO increase, 6.8±0.7% CBV decrease and 18.7±2.9% CMRO2 decrease were also observed in associated NBR ROIs.
Visual stimuli induced CBF and T2-BOLD increases peaked in middle layers, which is consistent with previous findings (10). In NBR regions CBF and CMRO2 decrease were both predominant in deep cortical layers. And the amount of decrease was comparable to CBF/CMRO2 increase in PBR regions, while the amount of CBV and BOLD decrease in NBR regions were ~56% and 7% of the CBV and BOLD increase in PBR regions. These results suggest that the proposed method can resolve layer-dependent vascular response and metabolism activities to investigate the origin of negative fMRI signals.
Conclusion
We proposed a 7T laminar concurrent ASL, VASO and BOLD fMRI sequence to obtain quantitative CBF, CBV, T2-BOLD and CMRO2 measurements with high resolution and specificity to detect layer-dependent vascular and metabolic activities. This study demonstrated the negative fMRI responses were associated with moderate decrease in T2-BOLD and CBV signals and strong CBF and CMRO2 decreases especially in deep cortical layers, which suggested suppressed neuronal activities (1).Acknowledgements
This work was supported by National Institute of Health (NIH) grant S10-OD025312, R01-NS114382, R01-EB032169 and R01-EB028297.References
1. Shmuel A, Augath M, Oeltermann A, Logothetis NK. Negative functional MRI response correlates with decreases in neuronal activity in monkey visual area V1. Nature neuroscience 2006;9(4):569-577.
2. Harel N, Lee S-P, Nagaoka T, Kim D-S, Kim S-G. Origin of negative blood oxygenation level—dependent fMRI signals. Journal of cerebral blood flow & metabolism 2002;22(8):908-917.
3. Yang Y, Gu H, Stein EA. Simultaneous MRI acquisition of blood volume, blood flow, and blood oxygenation information during brain activation. Magnetic Resonance in Medicine: An Official Journal of the International Society for Magnetic Resonance in Medicine 2004;52(6):1407-1417.
4. Zuo Z, Wang R, Zhuo Y, Xue R, Lawrence KSS, Wang DJ. Turbo-FLASH based arterial spin labeled perfusion MRI at 7 T. PloS one 2013;8(6).
5. Pohmann R, Speck O, Scheffler K. Signal‐to‐noise ratio and MR tissue parameters in human brain imaging at 3, 7, and 9.4 tesla using current receive coil arrays. Magnetic resonance in medicine 2016;75(2):801-809.
6. Huber L, Handwerker DA, Jangraw DC, Chen G, Hall A, Stüber C, Gonzalez-Castillo J, Ivanov D, Marrett S, Guidi M. High-resolution CBV-fMRI allows mapping of laminar activity and connectivity of cortical input and output in human M1. Neuron 2017;96(6):1253-1263. e1257.
7. Shao X, Hua J, Wang DJ. Concurrent laminar CBF, CBV, T2-BOLD and CMRO2 fMRI at 7T in human primary motor cortex.
8. Wang K, Ma SJ, Shao X, Zhao C, Shou Q, Yan L, Wang DJ. Optimization of pseudo‐continuous arterial spin labeling at 7T with parallel transmission B1 shimming. Magnetic Resonance in Medicine 2021.
9. Alsop DC, Detre JA, Golay X, Günther M, Hendrikse J, Hernandez‐Garcia L, Lu H, MacIntosh BJ, Parkes LM, Smits M. Recommended implementation of arterial spin‐labeled perfusion MRI for clinical applications: a consensus of the ISMRM perfusion study group and the European consortium for ASL in dementia. Magnetic resonance in medicine 2015;73(1):102-116.
10. Shao X, Guo F, Shou Q, Wang K, Jann K, Yan L, Toga AW, Zhang P, Wang DJ. Laminar perfusion imaging with zoomed arterial spin labeling at 7 Tesla. bioRxiv 2021.
11. Lu H, Golay X, Pekar JJ, Van Zijl PC. Sustained poststimulus elevation in cerebral oxygen utilization after vascular recovery. Journal of Cerebral Blood Flow & Metabolism 2004;24(7):764-770.
Figures