0614
Simultaneous BOLD fMRI and two-photon microscopic imaging on mice brain at 16.4T1Center for Magnetic Resonance Research, Department of Radiology, University of Minnesota, MN, USA, Minneapolis, MN, United States, 2School of Electrical and Computer Engineering, Department of Biological Sciences, Purdue University, West Lafayette, USA, West Lafayette, IN, United States
Synopsis
Keywords: Multimodal, fMRI (resting state), two-photon microscopy (TPM); simultaneous fMRI and TPM
While BOLD-based fMRI can non-invasively map whole brain activation and connectivity in humans and animals, the BOLD signal provides only an indirect measure of neural activity, and its cellular and neurophysiological origins remain not fully understood. We have developed a multi-scale neuroimaging modality allowing simultaneous fMRI and two-photon microscopic imaging (TPMI) on mice brains at UHF (16.4T). With the virus injection of GCaMP6s into the mouse brain, for the first time, we have successfully obtained functional MR images of the mouse brain and the neuronal calcium signals at layer II-III of the right S1 cortex simultaneously at resting state.
Introduction
The blood oxygenation level-dependent (BOLD) functional imaging (fMRI) has advanced our understanding of brain function significantly. However, the interpretation of BOLD at varied spatial scales is not straightforward1,2 as BOLD reflects the complex secondary effects of neural activity3. To better understand the inferences from BOLD, multi-modal imaging integrating fMRI with other recording modalities such as optical imaging4-6 or electrophysiology7-11 has been proposed. However, electrophysiology techniques can potentially cause significant cellular and/or vascular damage at the recording site or are incapable of resolving signals from individual neurons while single photon optical techniques lack spatial resolution in three dimensions. To overcome these challenges, we developed an MR-compatible TPMI system that works within a UHF MRI magnet12. In this work, we further solved several technical hurdles to develop the first integrated volumetric TPMI (VTPMI) and high-resolution fMRI system at 16.4T, capable of simultaneous multimodal measurements. We report the first simultaneous BOLD fMRI and two-photon calcium images on in-vivo mouse brains, providing data that span the spatial scale from single neurons to the brain-wide neural network level.Methods
Experimental setup. The VTPMI system comprises a remote laser scanning system located outside the magnet room and an in-MRI optical module as shown in Fig. 1. To further improve the previous setup12, an MR-compatible objective lens was customized with the well-selected materials; an MR-compatible 3D stage was designed and fabricated to allow moving the mouse brain remotely. The MRI experiments were conducted on a 16.4T/26cm animal scanner (Bruker/Paravision) using a single loop (2.5 cm diameter) surface coil for MR imaging.Animal preparation. The mouse (C57BL/6) was injected with the AAV1-Syn-GCaMP6s virus at 250 and 500 microns depth (150nl for each depth) in the right somatosensory cortex. A 3mm diameter craniotomy window was opened and sealed by a plastic coverslip. During the simultaneous TPMI-fMRI measurements, the mouse was IP injected with a bolus of fentanyl-midazolam-dexmedetomidine cocktail for anesthesia13,14. All the procedures strictly followed the protocol approved by the IACUC of the University of Minnesota.
Simultaneous TPMI-fMRI data acquisition. Functional calcium signals were acquired at ~300µm depth from the cortical surface of the brain with frame rate = 5.28 Hz; FOV = 523µm×523µm; matrix size = 512×512; frame number = 3000. Gradient echo (GE)-echo planar imaging (EPI) based resting-state fMRI images were obtained with TR/TE = 1894/16 ms; matrix size = 80×48; FOV = 2.0cm ×1.2cm; 10 slices with 0.25 mm thickness; repetition = 300. Both anatomical and vessel MRI were acquired using the 2D Flash sequence with optimal parameters.
Data analysis. Functional fluorescence images were motion-corrected using ANTs15, followed by automatic neuron segmentation based on the spatial-temporal features using CaImAn16. The fluorescence fluctuations ΔF/F trace was extracted for each segmented neuron, the pairwise correlation of which formed the adjacency matrix. Based on the overall correlation strength, firing neurons were classified into two groups. The averaged ΔF/F traces for each group were high-pass-filtered and used as external seeds to generate the seed maps based on the BOLD fMRI data, which were motion and slice-time corrected, and high-pass-filtered at 0.01 Hz.
Results
The in-vivo MR and calcium images of the same mouse brain are shown in Fig. 2. The left panel in Fig. 2A shows the anatomical MRI slices in coronal and axial orientation, respectively; and the right panel shows the corresponding 2D GE-EPI images. The plastic window flattened the tissue, with acceptable distortions observed in the EPI images. Figure 2B shows the maximum intensity projection (MIP) of volumetric calcium images with the zoomed-in area where functional calcium images were acquired simultaneously with EPI images. Figure 3B shows examples of raw time series simultaneously acquired in resting BOLD fMRI and calcium TPMI, respectively. The corresponding ROIs or neurons were drawn in Fig. 3A for reference. The segmented firing neurons in the mouse brain are marked in green and overlaid on the MIP of the motion-corrected calcium signals in Fig. 4A. The adjacency matrix generated using Person’s coefficient is shown in Fig. 4B. The two distinguished neuron groups (Fig. 4C) are labeled in blue and red respectively and so are their averaged ΔF/F traces (Fig. 4D). The corresponding seed maps are shown in Fig. 5.Discussion and Conclusion
We have developed the first VTPMI-fMRI imaging platform and demonstrated simultaneous fMRI and TPM imaging of the neuro-vascular fluctuations in the mouse brain at resting states for the first time. At the cellular level, we found neurons behave in diverse ways, producing distinct calcium signals and dynamics. The temporal correlations between the spontaneous activities of the population neurons and the high-resolution BOLD fMRI fluctuations (Fig. 5) indicate a sub-group of neurons can partially represent the BOLD fluctuations at the laminar level. With more data accumulated, this VTPMI-fMRI can advance our understanding of BOLD origins across different scales. In addition, this novel imaging platform can also include other MRI modalities such as diffusion MRI and MRSI, paving the way to comprehensively study the relationships between brain structural and functional connectivity, neuronal activity and dynamics, and energy metabolism under resting, activated, and diseased states.Acknowledgements
This work was partly supported by NIH grants of R01 NS118330, R01 MH111413, R01 CA240953, U01 EB026978, S10 RR025031, S10OD028712, and P41 EB027061.References
- Albers, F., Wachsmuth, L., van Alst, T. M. & Faber, C. Multimodal functional neuroimaging by simultaneous BOLD fMRI and fiber-optic calcium recordings and optogenetic control. Molecular imaging and biology 2018;20:171-182.
- Hyder, F. et al. Neurovascular and Neurometabolic Couplings in Dynamic Calibrated fMRI: Transient Oxidative Neuroenergetics for Block-Design and Event-Related Paradigms. Front Neuroenergetics 2010;2(18):1-11.
- Ogawa, S. et al. Functional brain mapping by blood oxygenation level-dependent contrast magnetic resonance imaging. A comparison of signal characteristics with a biophysical model. Biophys J 1993;64:803-812.
- Schulz, K. et al. Simultaneous BOLD fMRI and fiber-optic calcium recording in rat neocortex. Nat Methods 2012;9:597-602.
- Wang, M., He, Y., Sejnowski, T. J. & Yu, X. Brain-state dependent astrocytic Ca(2+) signals are coupled to both positive and negative BOLD-fMRI signals. Proc Natl Acad Sci U S A 2018;115:E1647-E1656.
- Schlegel, F. et al. Fiber-optic implant for simultaneous fluorescence-based calcium recordings and BOLD fMRI in mice. Nat Protoc 2018;13:840-855.
- Ogawa, S., Menon, R., Kim, S.-G. & Ugurbil, K. On the characteristics of functional magnetic resonance imaging of the brain. Annual review of biophysics and biomolecular structure 1998;27:447-474.
- Logothetis, N. K., Pauls, J., Augath, M., Trinath, T. & Oeltermann, A. Neurophysiological investigation of the basis of the fMRI signal. nature 2001;412:150-157.
- Liu, X., Zhu, X. H., Zhang, Y. & Chen, W. Neural origin of spontaneous hemodynamic fluctuations in rats under burst-suppression anesthesia condition. Cereb Cortex 2011;21:374-384.
- Liu, X., Zhu, X. H., Zhang, Y. & Chen, W. The change of functional connectivity specificity in rats under various anesthesia levels and its neural origin. Brain Topogr 2013;26:363-377.
- Scholvinck, M. L., Maier, A., Ye, F. Q., Duyn, J. H. & Leopold, D. A. Neural basis of global resting-state fMRI activity. Proc Natl Acad Sci U S A 2010;107:10238-10243.
- Cui, M. et al. A proof-of-concept study for developing integrated two-photon microscopic and magnetic resonance imaging modality at ultrahigh field of 16.4 tesla. Sci Rep 2017;7:2733.
- Fleischmann, T., Jirkof, P., Henke, J., Arras, M. & Cesarovic, N. Injection anaesthesia with fentanyl-midazolam-medetomidine in adult female mice: importance of antagonization and perioperative care. Lab Anim 2016;50:264-274.
- O'Herron, P., Levy, M., Woodward, J. J. & Kara, P. An Unexpected Dependence of Cortical Depth in Shaping Neural Responsiveness and Selectivity in Mouse Visual Cortex. eNeuro 2020;7(2):1-14.
- Avants, B. B. et al. The Insight ToolKit image registration framework. Frontiers in Neuroinformatics 2014;8(44):1-13.
- Giovannucci, A. et al. CaImAn an open source tool for scalable calcium imaging data analysis. eLIFE 2019; 8: e.38173.
Figures
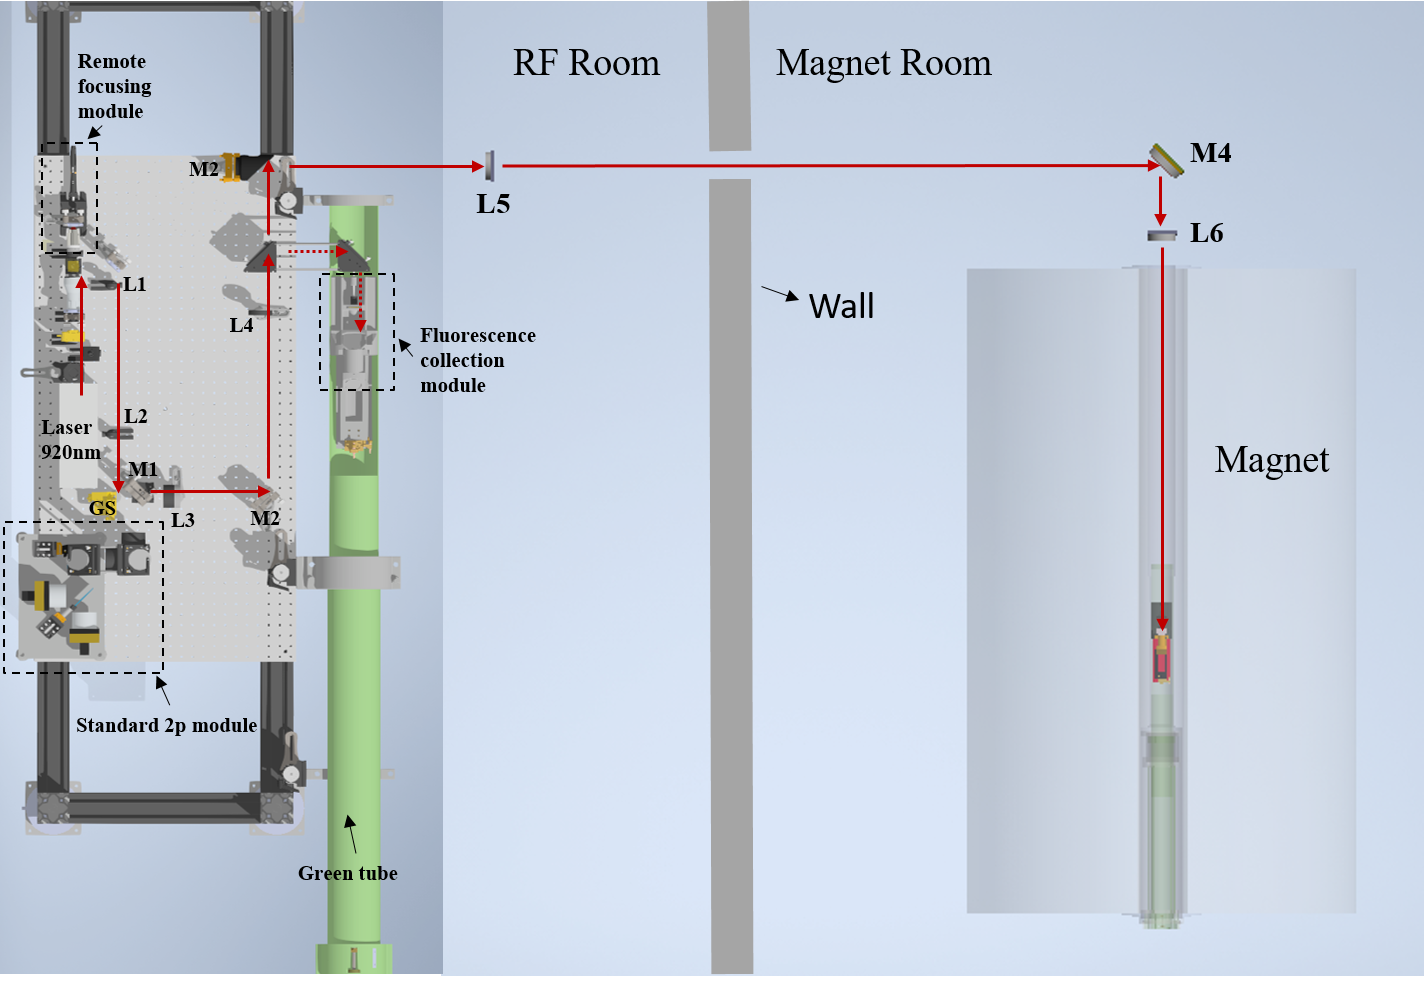
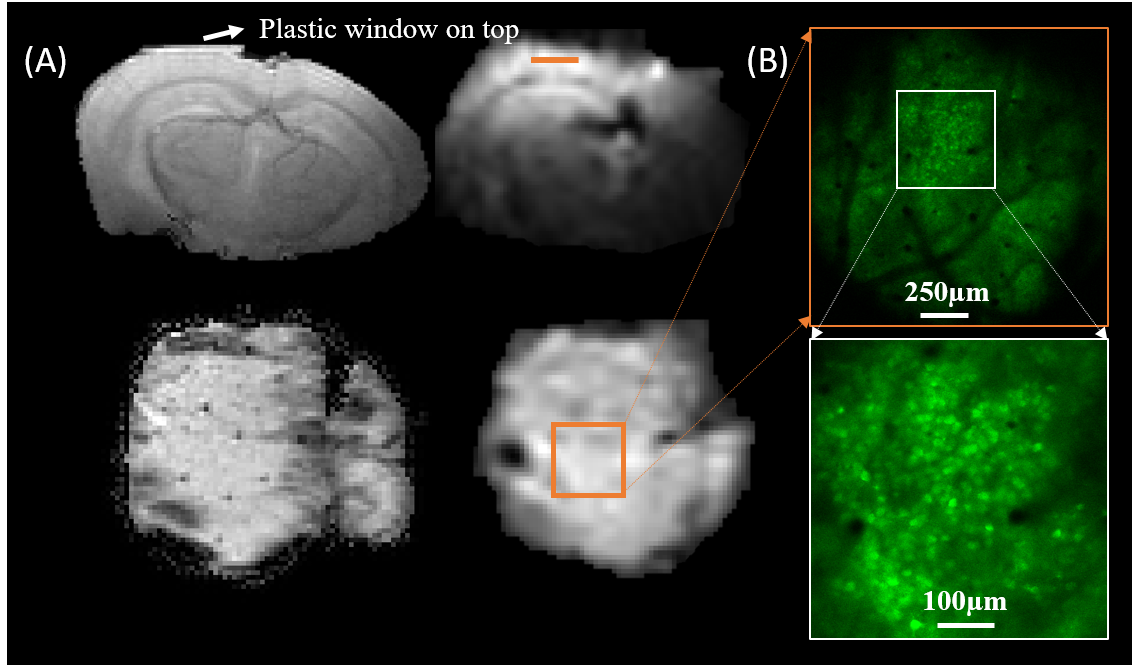
Figure 2. In-vivo MR images (A) and calcium images (B) of the same mouse brain. Two example FLASH MRI slices in coronal (top) and axial (bottom) orientations are shown in the left panel in (A), and the corresponding 2D GE-EPI images with a nominal resolution of 0.25mm isotropic in the right panel in (A). The brain tissue under the plastic window is shown flat. (B): top shows MIP of volumetric calcium images (FOV=1.57mm´1.57mm) for image registration with MR images. The bottom shows the functional calcium signals acquired with a zoomed-in FOV (523µm´523µm).
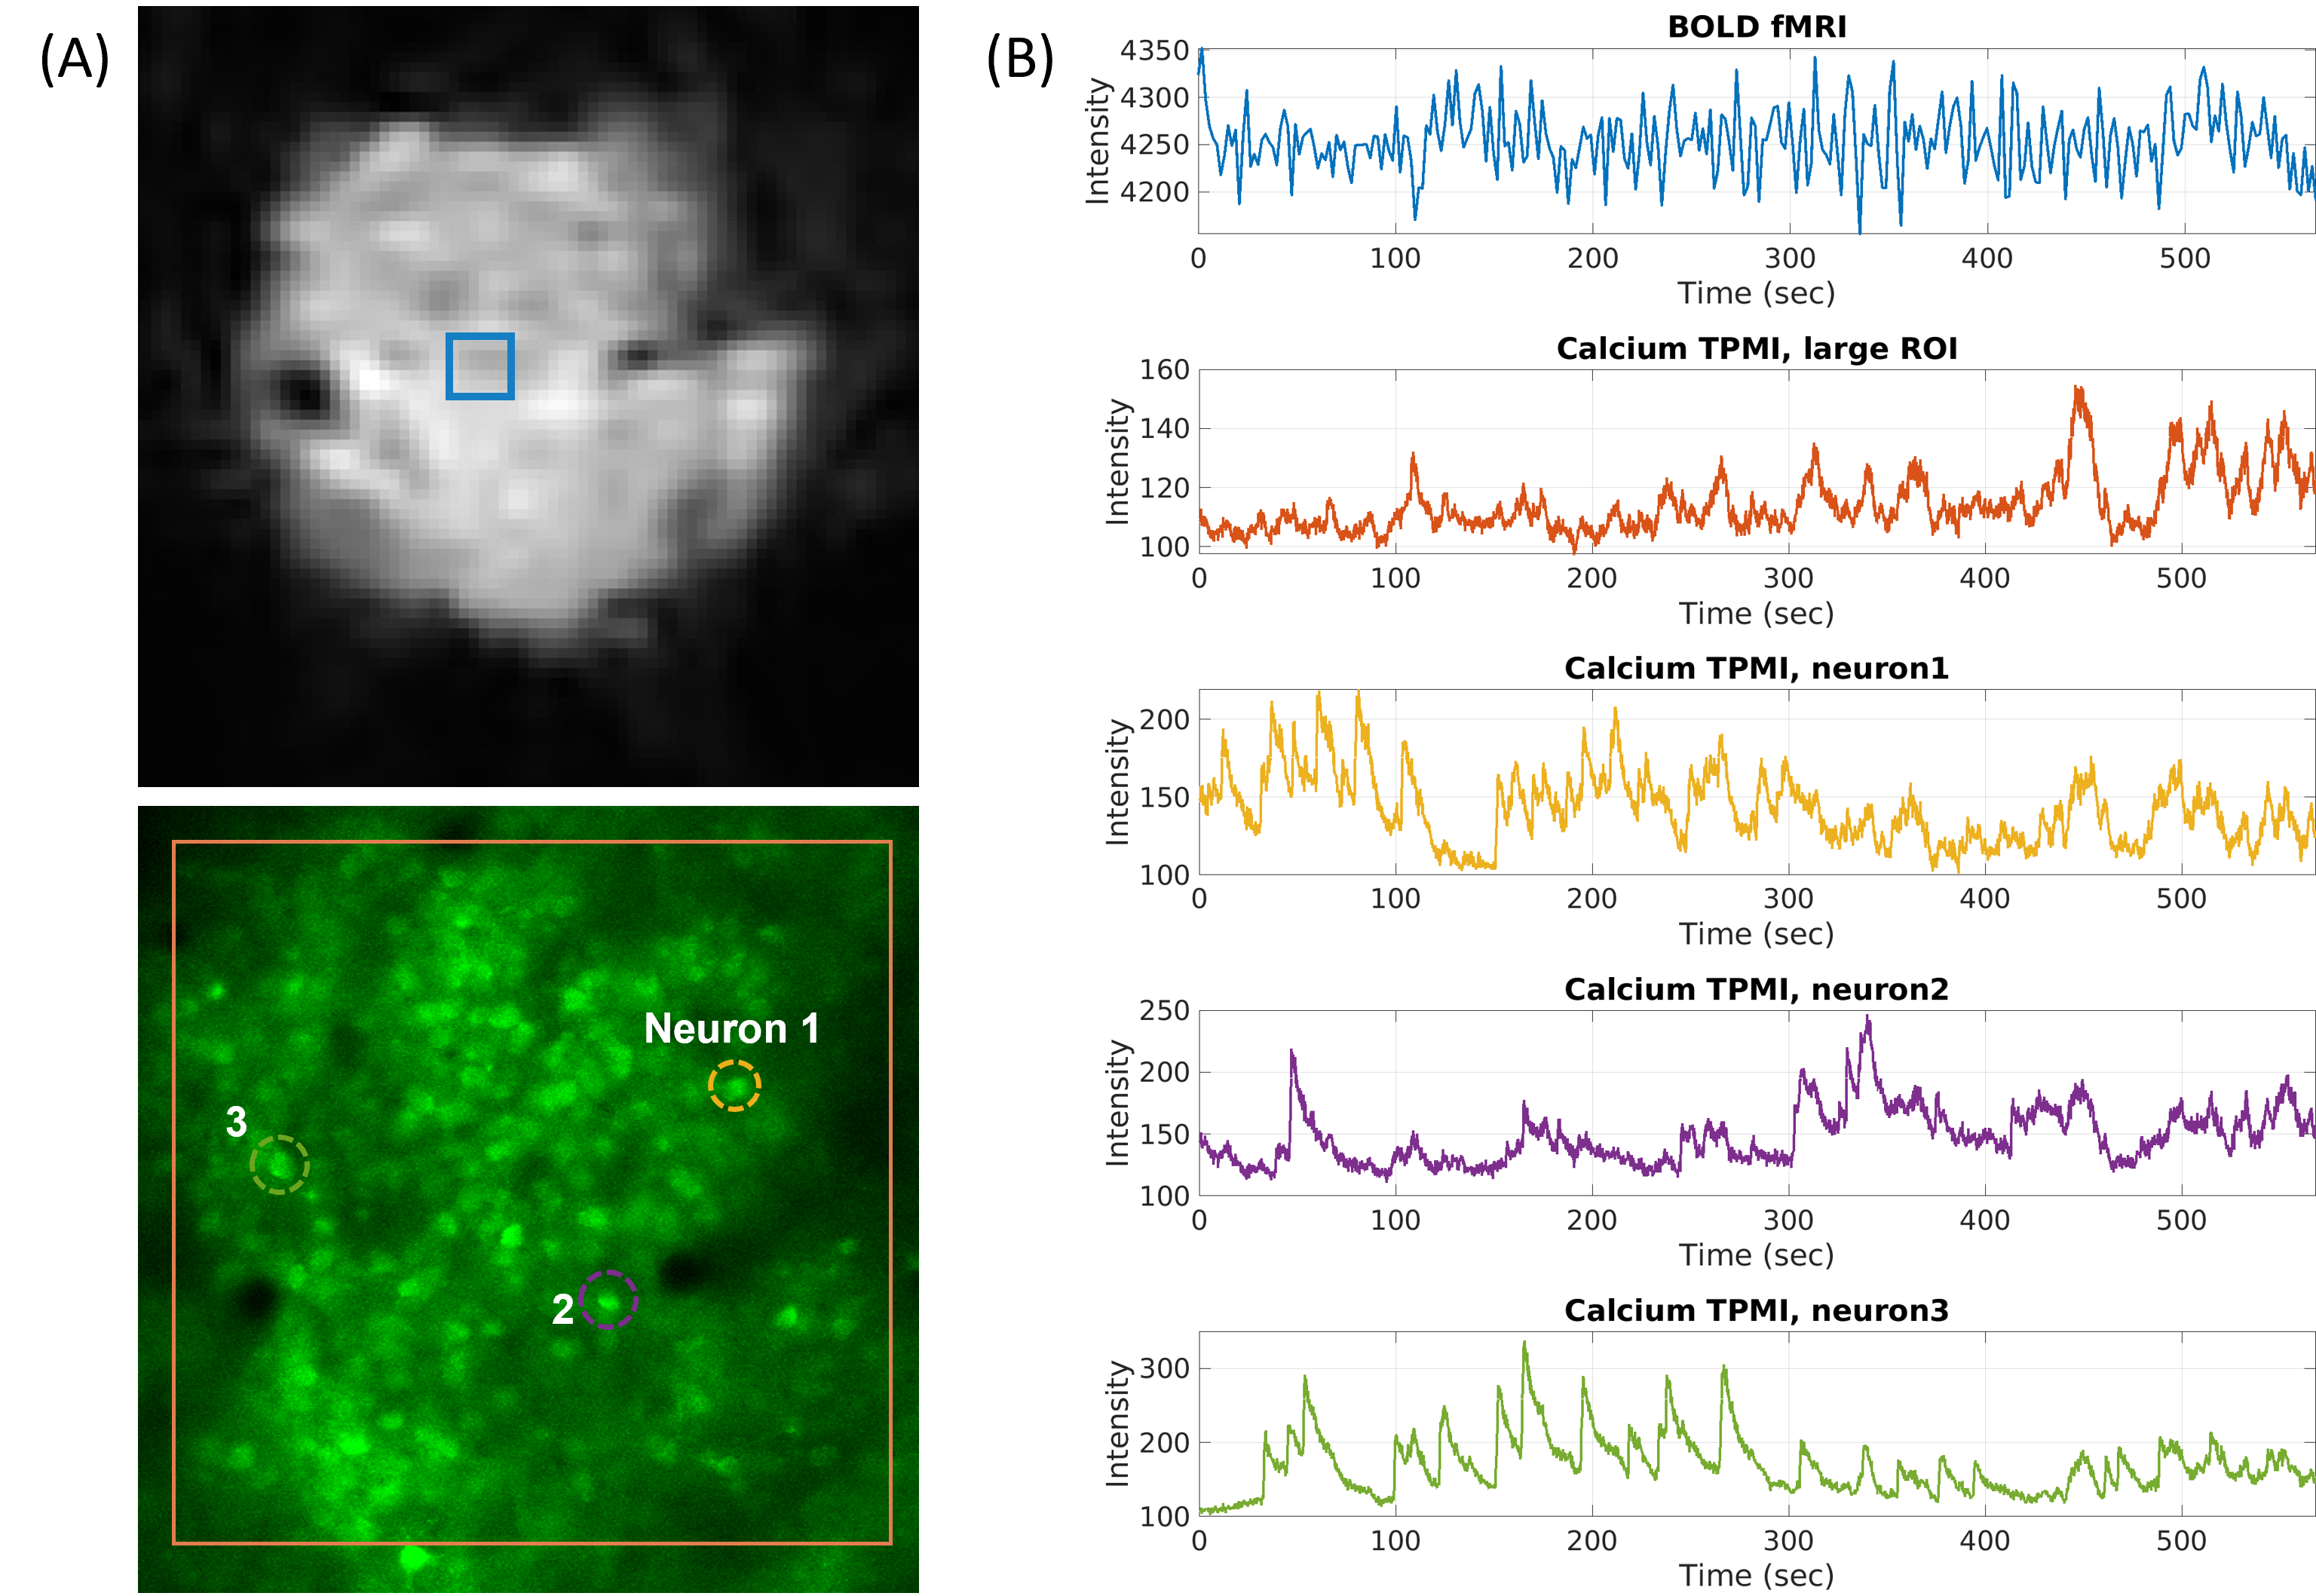
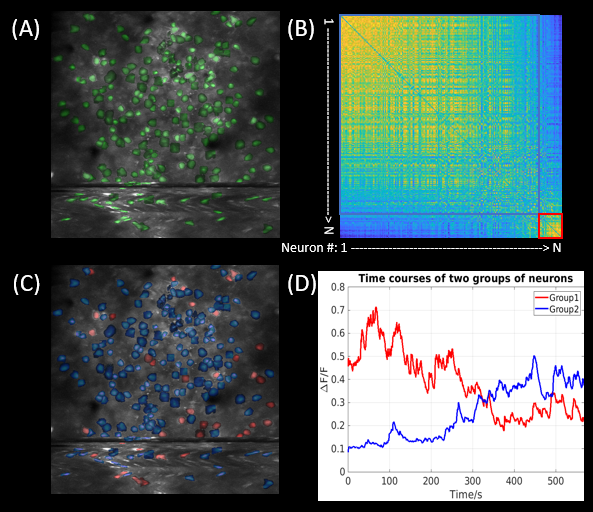
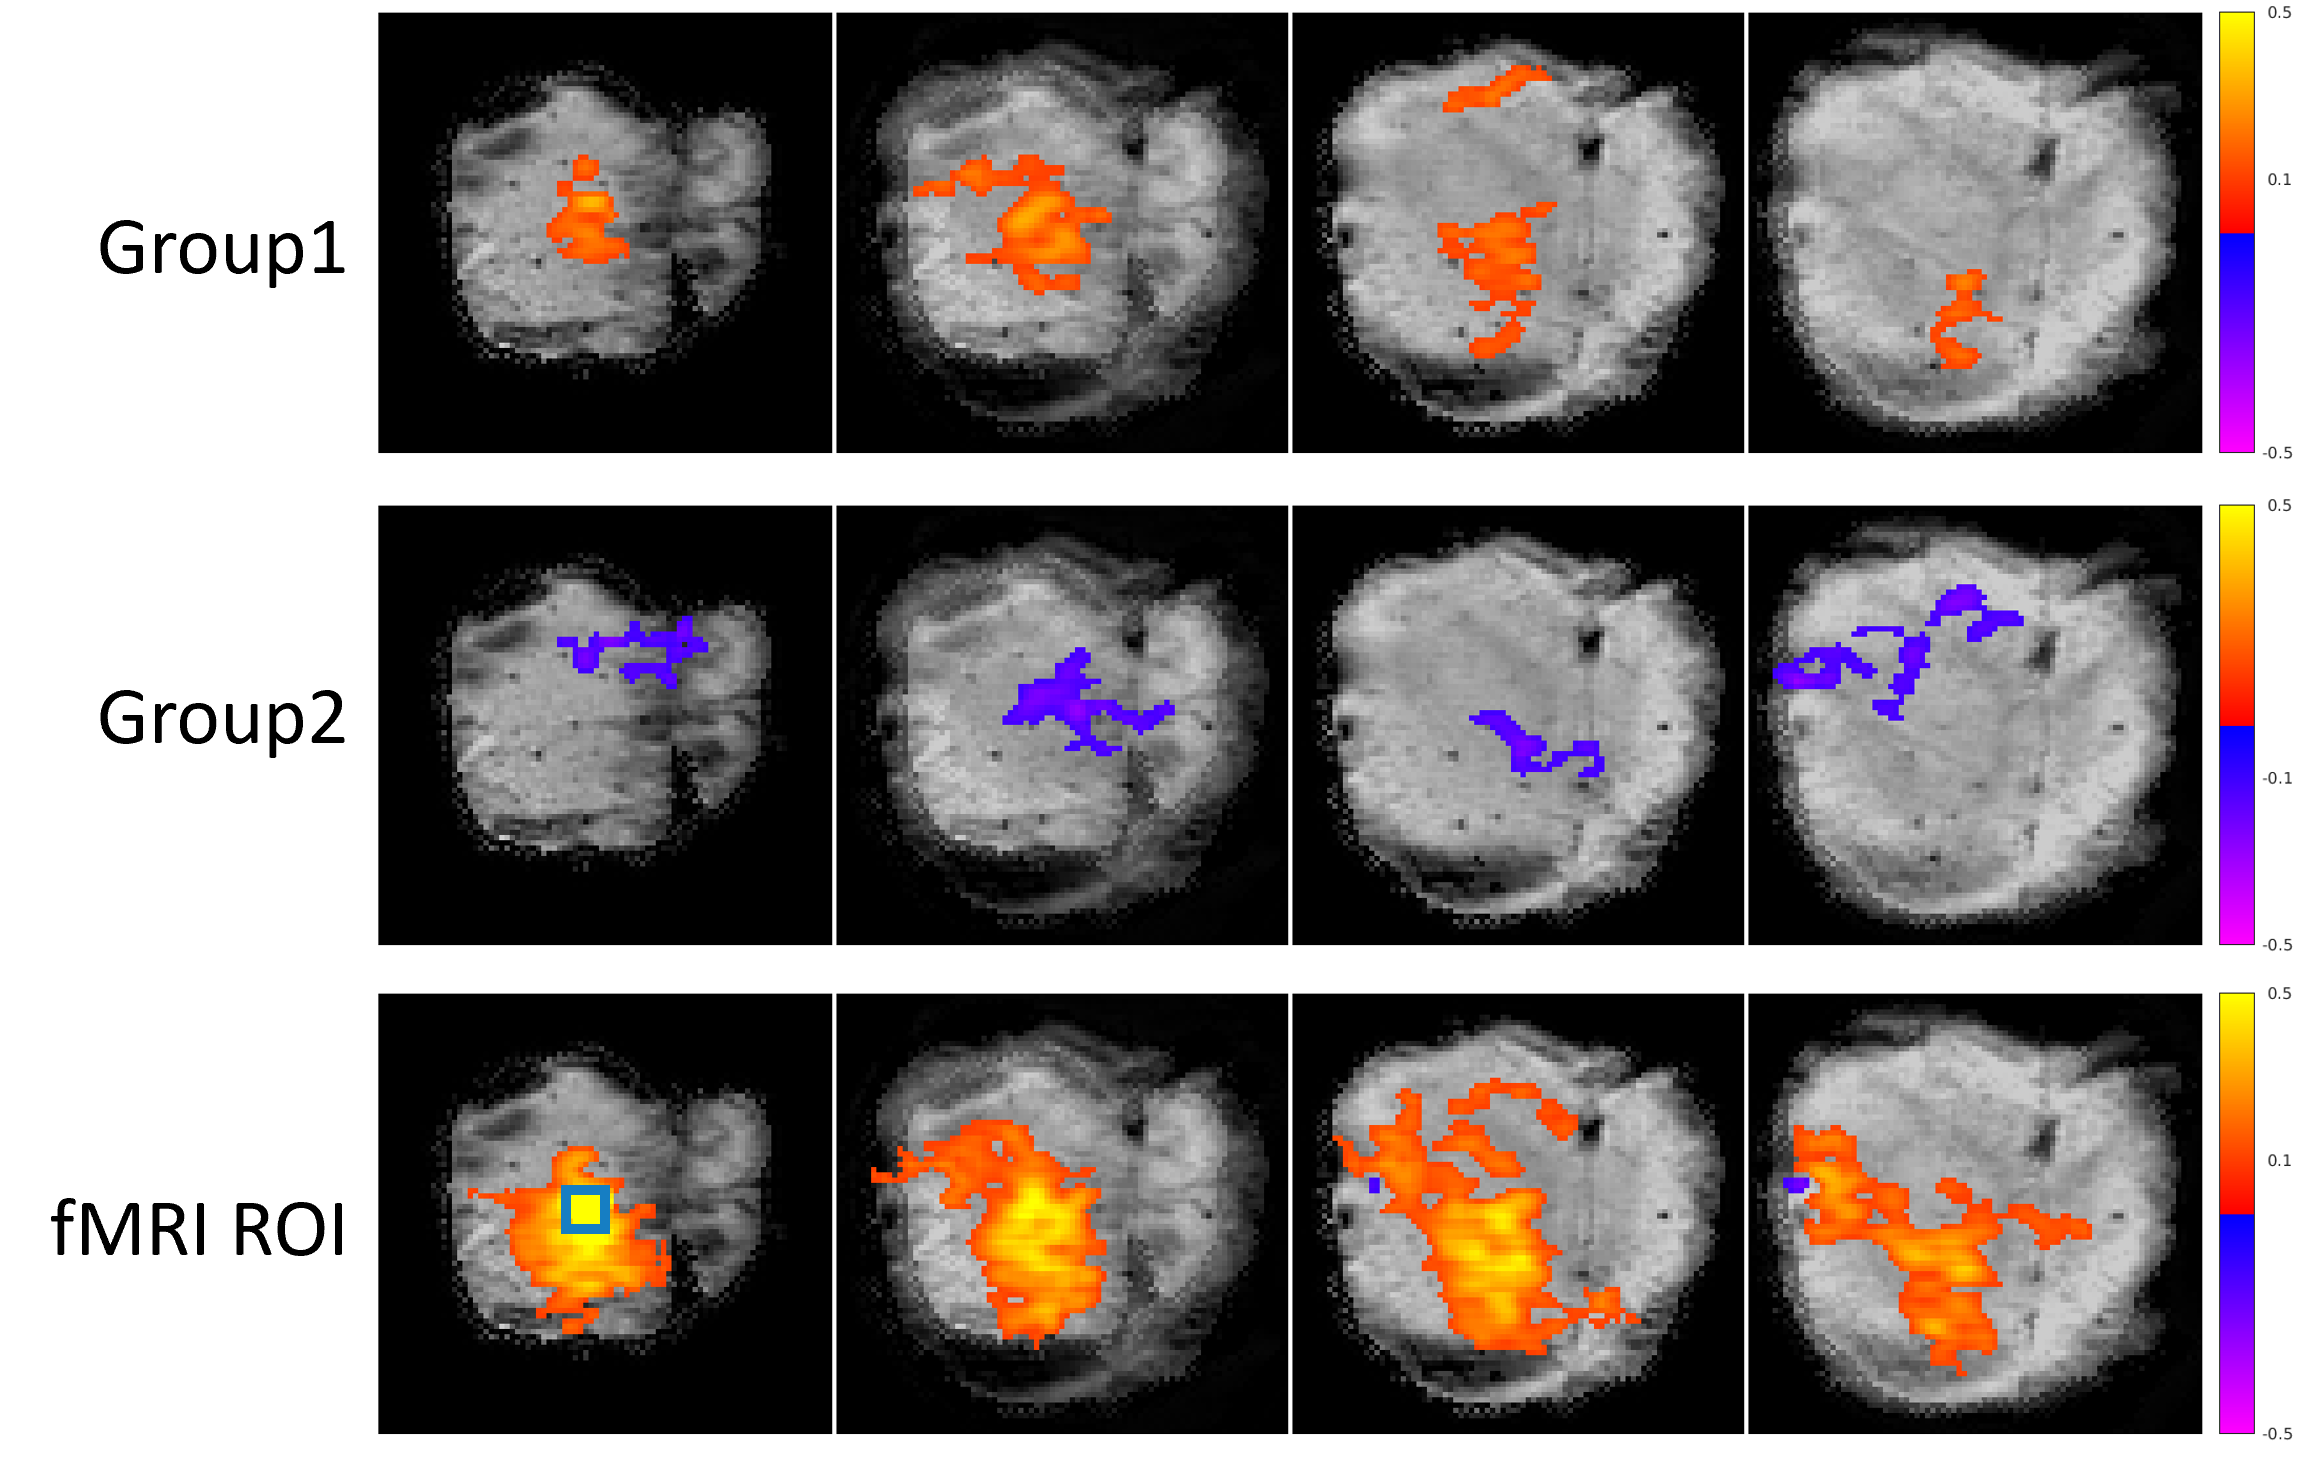
Figure 5. Seed maps based on Group 1 trace, Group 2 trace, and averaged BOLD fluctuations in the fMRI ROI. The area where the trace is negatively correlated with the BOLD signal is labeled in blue while the positively correlated area is marked in red. The green square has the same size as the ROI where optical signals were recorded.