0608
A geometrical approach to rapidly evaluate and optimize pTx transmission vectors for imaging and RF safety of implants1Physikalisch-Technische Bundesanstalt (PTB), Braunschweig and Berlin, Germany
Synopsis
Keywords: Safety, Safety, Implant safety, RF safety, implants, Deep brain stimulator
A simple geometrical approach is presented to rapidly calculate safe pTx excitation vectors for implants, while further optimizing imaging performance. The proposed approach does not require any additional imaging protocols to be performed and pTx vector optimizations can be calculated solely e.g. based on low-cost sensors embedded in implants. The methodology was tested on a custom-built sensor-equipped wireless implant in 3T MRI experiments and realistic DBS lead configurations.Introduction
Measurement-based assessments of RF-induced implant heating either MR-image based1,2 or using sensor-equipped implants3,4, combined with parallel transmission (pTx) offer the extra degrees of freedom to control the heating while simultaneously maintaining imaging quality. Current methods require additional imaging to optimize the image, at the cost of added scan time. A real-time capable method, the Orthogonal Projection (OP)5, assumes that an imaging mode of good performance is a priori known, e.g. the CP mode as used routinely in 1.5T and 3.0T MRI. It is subsequently used to calculate an improved transmission vector considering both safety and imaging performance. So far, however, no metric has been introduced to evaluate and possibly further optimize that improved vector.Here, we extend the OP method by introducing a simple similarity score to rate any excitation vector in terms of heating risk and image quality. The approach was tested on a home-built sensor-equipped wireless implant in 3T MRI experiments and realistic DBS lead configurations
Methods
Geometrical approachGiven an $$$N$$$-channel pTx coil and the implant’s response to single-channel RF excitation, based on either sensor measurements or MR images, a system of linear equations for the RF-induced voltages on the implant can be written down. Here, we use the “sensor Q-matrix” ($$$Q_s$$$)4 to determine the voltage vector ($$$u_{wc}$$$) of the worst-case implant heating. Assuming normalization to total RF power, $$$u_{wc}$$$ is the eigenvector to the largest eigenvalue of $$$Q_s$$$.4 If $$$u_{im}$$$ describes the preferred imaging mode without any safety constraints, the OP mode is calculated to mitigate RF-heating \begin{equation}\tag{1}\label{eqn:op_def}u_{op}=u_{im}-u_{wc}(u_{wc}\bullet u_{im})\end{equation}where the implant depended $$$u_{wc}$$$ is measured on-the-fly via $$$Q_s$$$ and $$$u_{im}$$$ is known in advance. For any given RF-excitation vector $$$u_{opt}$$$, the following scores can be defined:\begin{equation}\tag{2}\label{eq:S_rf} S_{RF\_risk}=|u_{wc}\bullet u_{opt}|=||(u_{wc}|\,|u_{opt}|\,cos(\theta_{1})|=|cos(\theta_{1})|\end{equation}\begin{equation}\tag{3}\label{eq:S_im}S_{image}=|u_{im}\bullet u_{opt}|=||(u_{im}|\,|u_{opt}|\,cos(\theta_{2})|=|cos(\theta_{2})|\end{equation}
$$$\theta$$$ is the angle between the two normalized vectors and $$$cos(\theta)$$$ defines their similarity. A high $$$S_{RF\_risk}$$$ score therefore indicates high similarity between $$$u_{opt}$$$ and $$$u_{wc}$$$ and; hence, strong RF-induced heating. If the similarity between $$$u_{opt}$$$ and $$$u_{im}$$$ is strong, the imaging quality will be similar to the target imaging vector, as desired. The two scores can be used to rate a certain excitation vector or for optimization in a trade-off between image quality and heating risk, e.g. via a regularization parameter, under the RF heating limits of IEC 60601-2-336 or ISO 109747.
Instrumentation and experiments
We tested the method in a 3T scanner by using a calibrated, wireless reference implant (Fig.1A) and six realistic DBS configurations and ASTM phantom. (Fig.1B)8–10 The $$$Q_s$$$ of each configuration was extracted to compute $$$u_{wc}$$$. Then, two real-time capable pTx mitigation vectors: $$$u_{op}$$$ 4,5 and the null-mode vector $$$u_{nm}$$$ 4,11 were consecutively calculated and scored according to Equations\eqref{eq:S_rf} and \eqref{eq:S_im}. For each excitation mode, the RF-induced tip-voltages were measured via the implant sensor and the corresponding temperature rises (67s of RF heating) via an external fiber-optic temperature probe attached near the implant tip. Finally, GRE images [TE/TR: 2.41/221ms, Resolution:1.0 × 1.0 × 5.0mm3, 20-slices] were acquired using all pTx RF-excitation modes ($$$u_{wc}$$$, $$$u_{cp}$$$, $$$u_{op}$$$, $$$u_{nm}$$$) to compare imaging performance. The total average transmit powers were always the same for all modes ($$$P_{imaging}=3.75 W,P_{RF\_heating}=22 W, P_{RF\_signal}=35 mW$$$; measured at the output of the RF-amplifiers).
Results
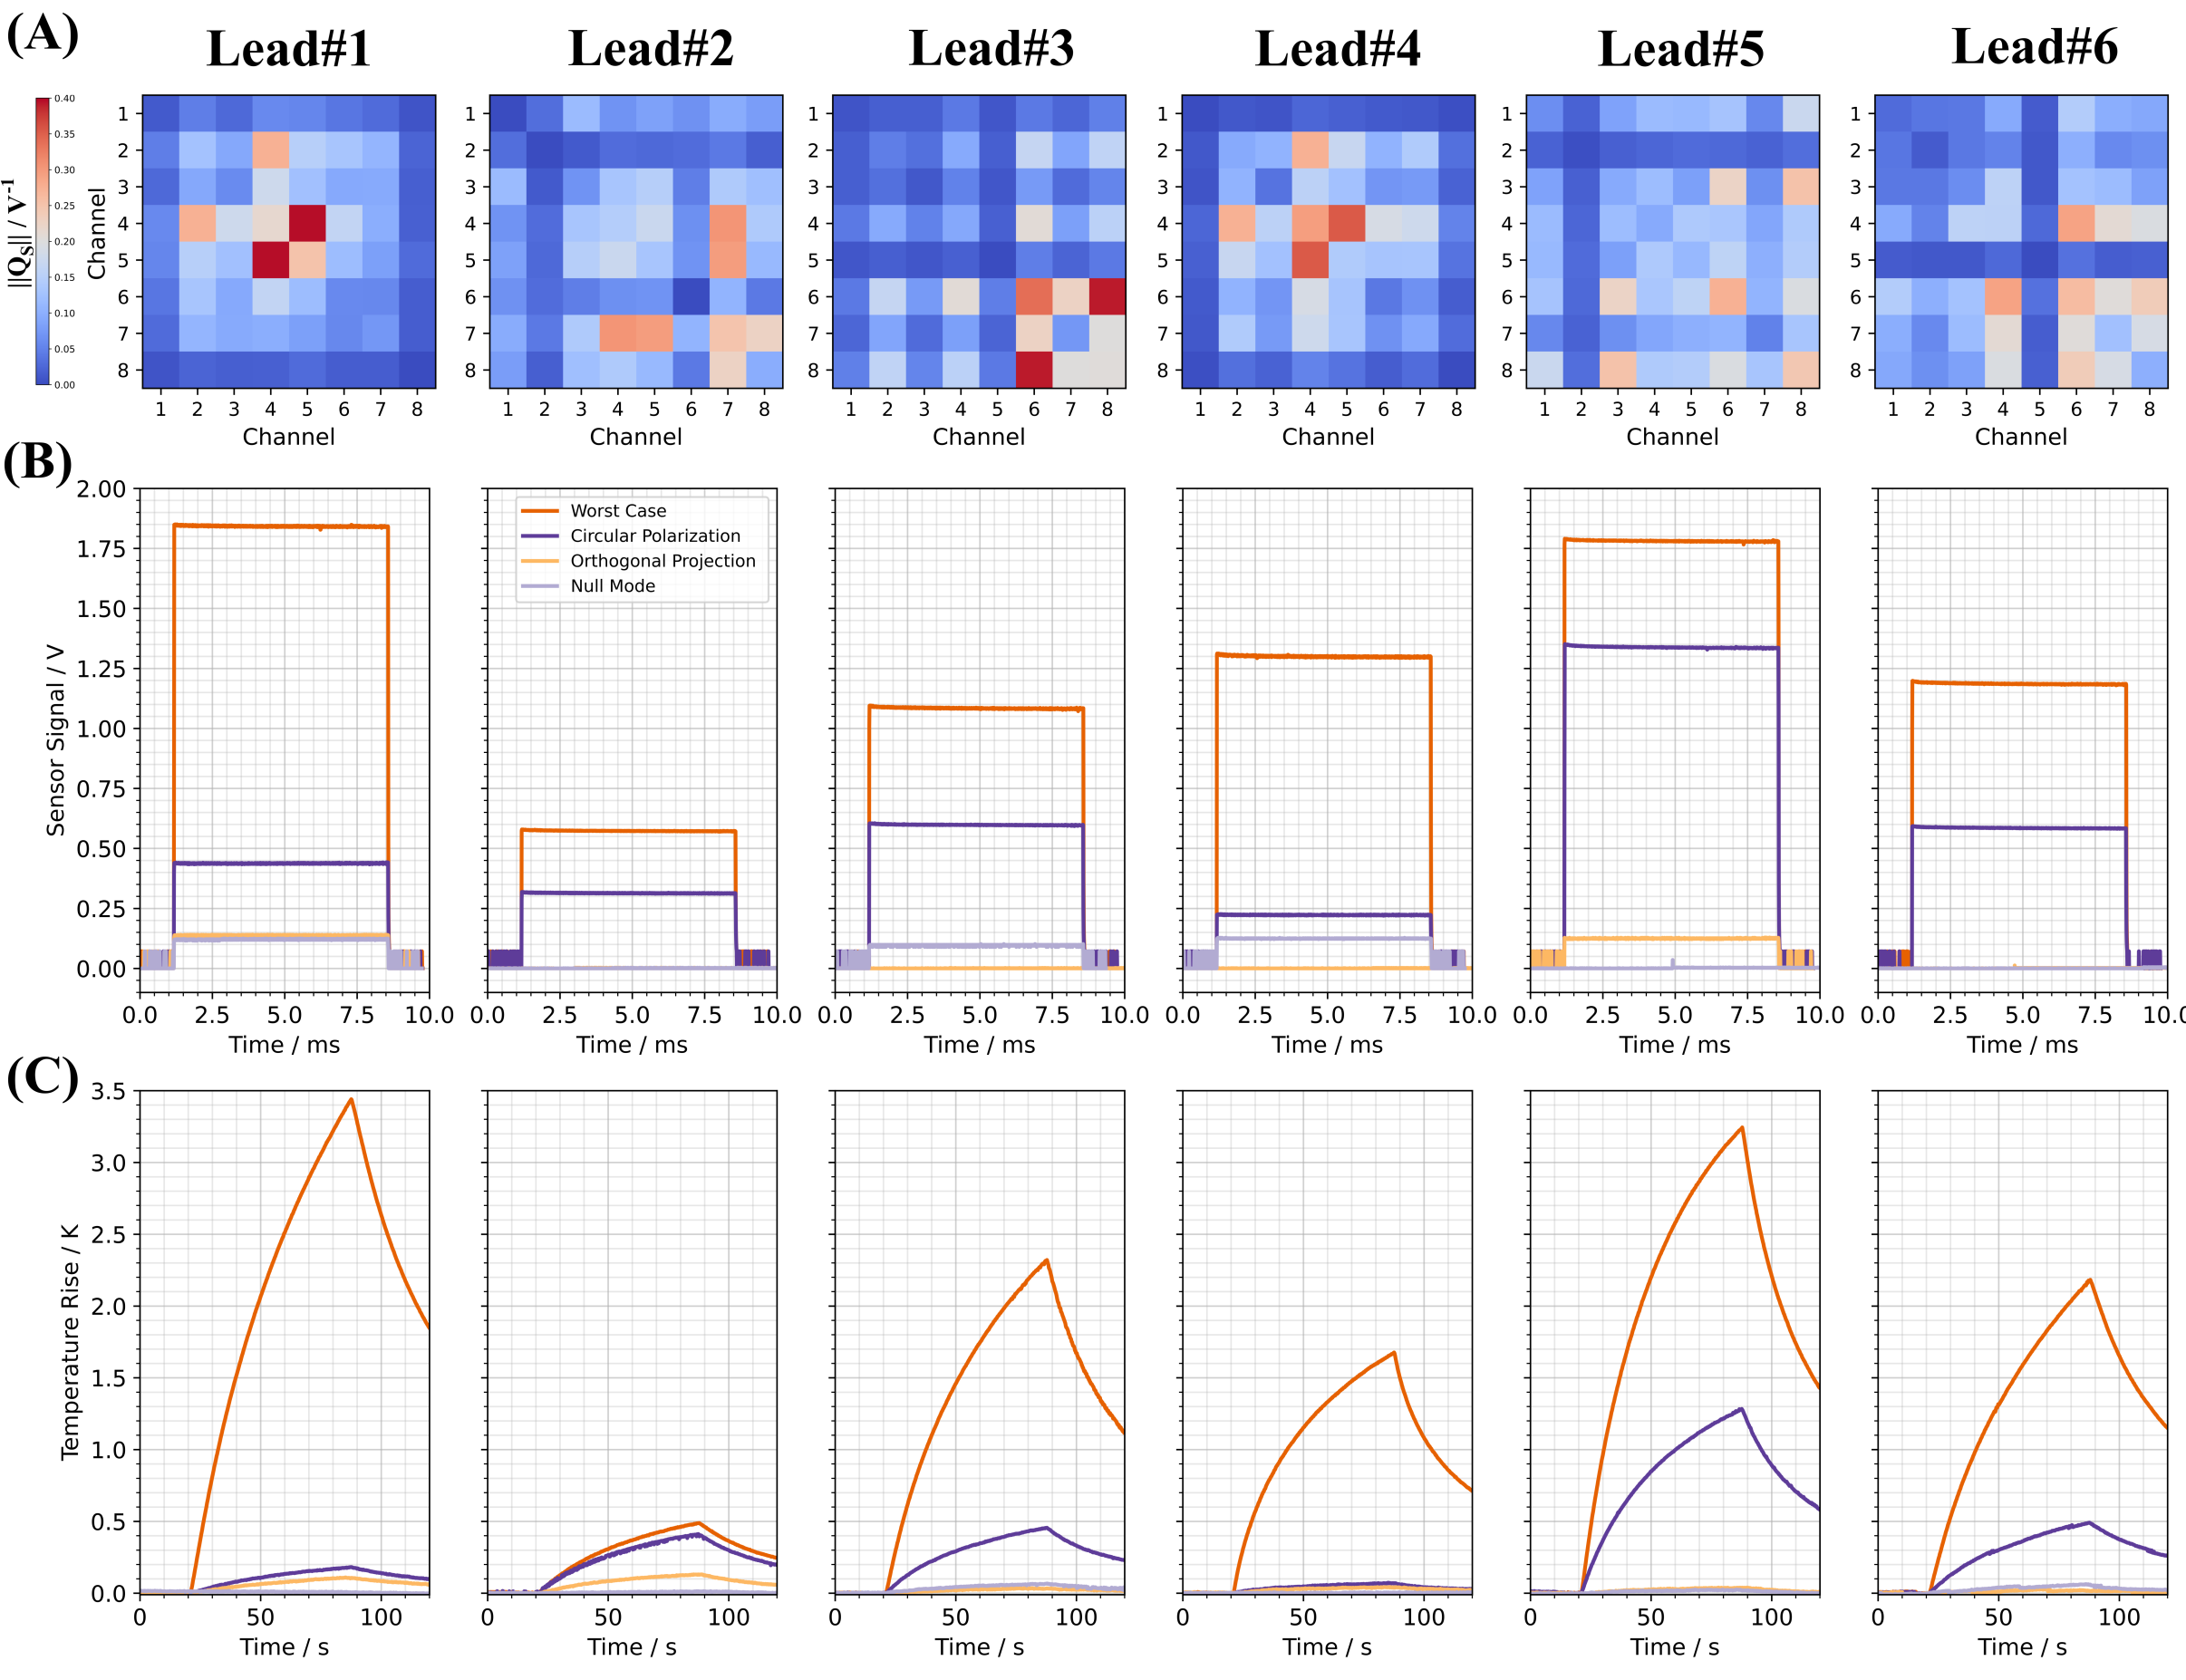
The normalized amplitudes of the wirelessly acquired $$$Q_{s}$$$ for the six lead configurations are shown in Fig.2A. Depending on the lead configuration, different pTx channels contribute to the RF-induced signals.It is observed that RF-induced signals and heating vary depending on the lead configuration; however,$$$u_{wc}$$$ always produces the highest RF-induced signals and heating (Fig.2B,C). For $$$u_{op}$$$ and $$$u_{nm}$$$, the RF-induced signals and heating (Fig.2B,C) are substantially lower $$$S_{RF\_risk}\le 0.23$$$,Fig.3 and Fig.4.
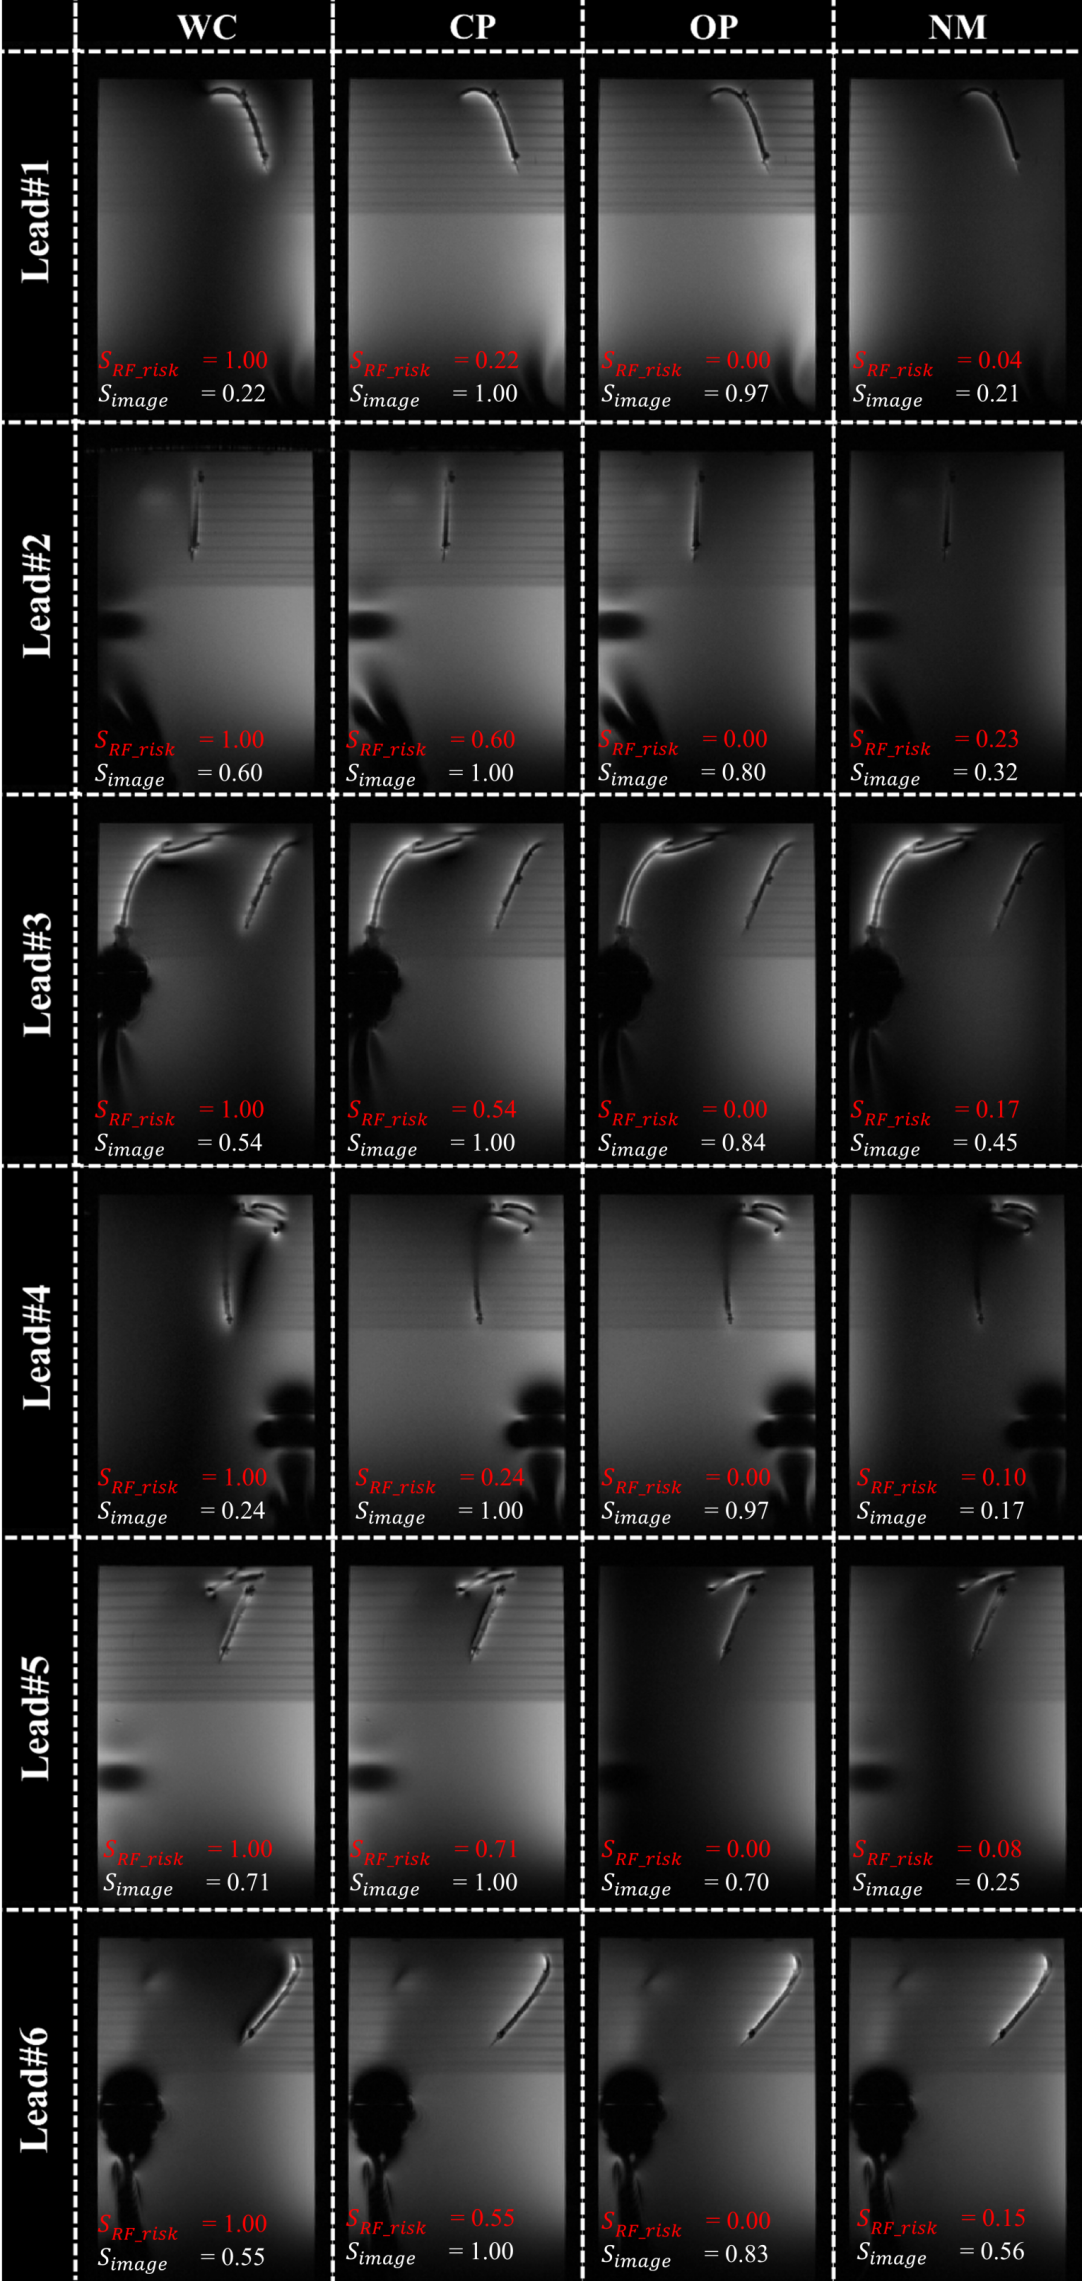
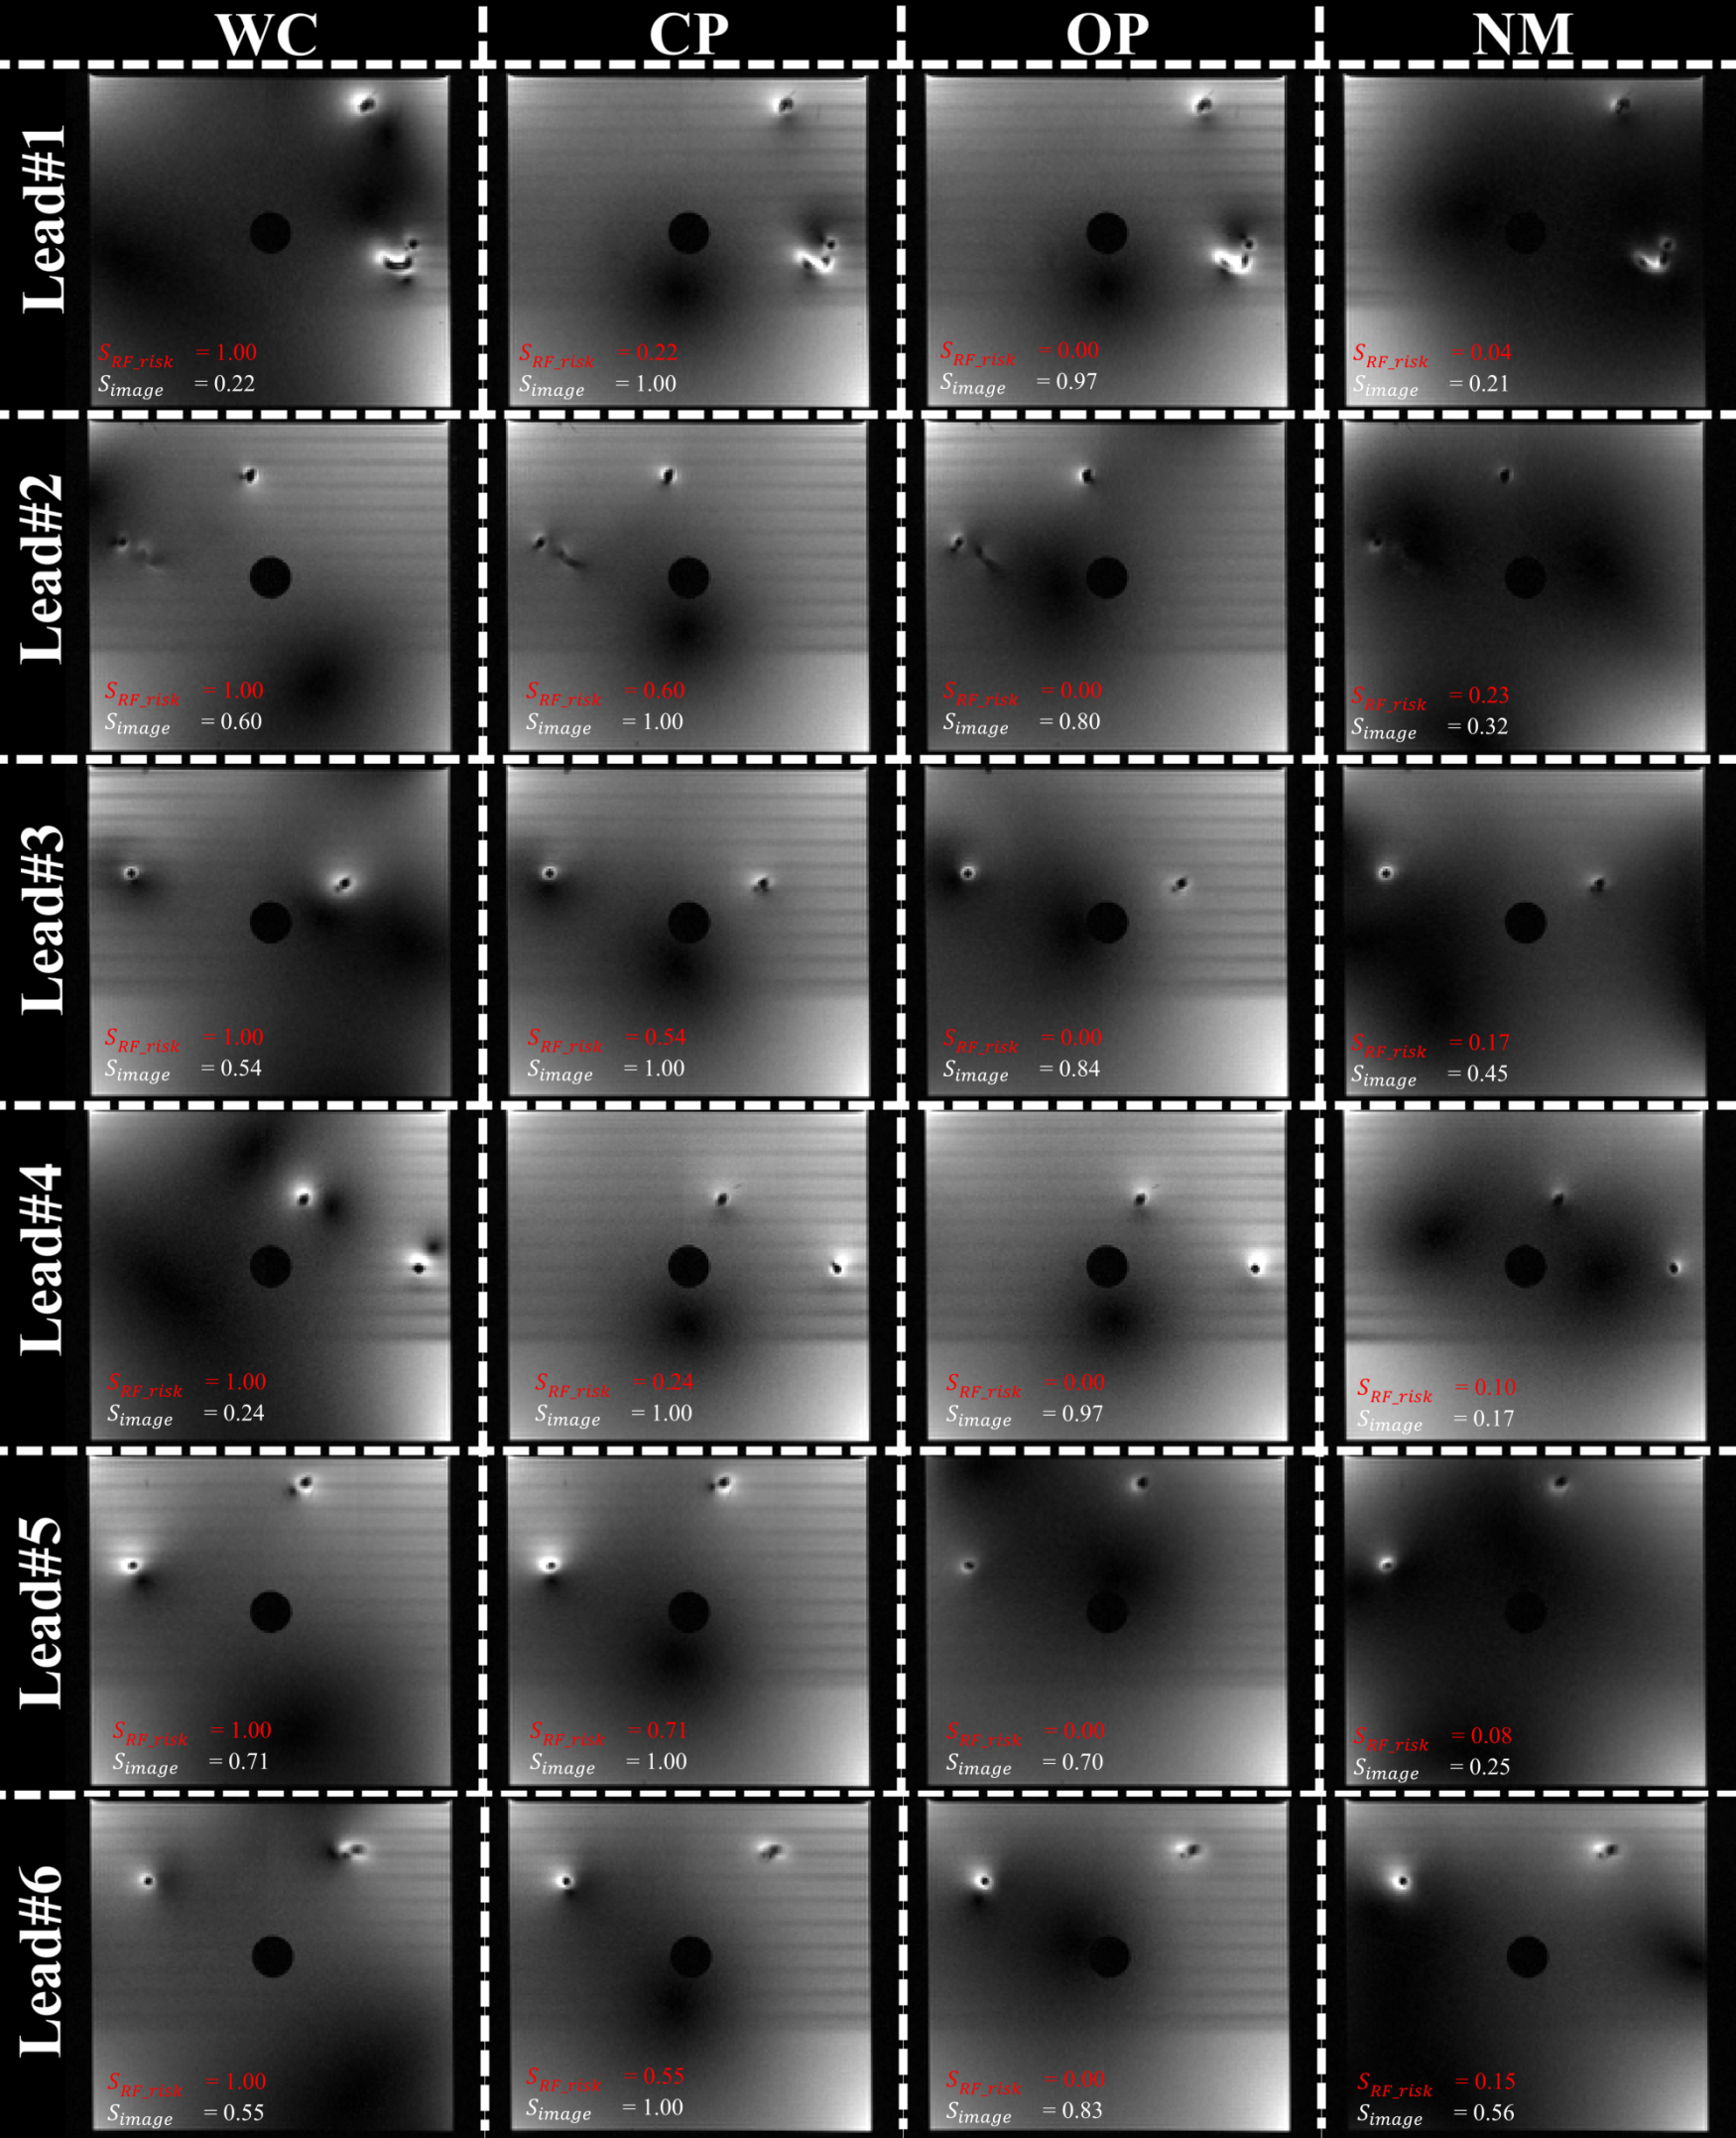
MR images for all modes are shown in Figures 3 and 4. As desired, $$$u_{op}$$$ provides similar imaging quality to $$$u_{cp}$$$; the imaging score varies, however. Image quality is best preserved in Lead#1 ($$$S_{image}=0.97$$$) and Lead#4 ($$$S_{image}=0.97$$$). For Lead#2,#3 and #6, the quality drops as reflected in lower image scores of 0.80, 0.84 and 0.83, respectively. For Lead#5, imaging performance deteriorates even further ($$$S_{image}=0.70$$$). For $$$u_{nm}$$$, which aims at low heating without image-quality constraints, the image scores are somewhat lower ($$$S_{image}\le 0.56$$$).
Concerning the implant risk, the $$$u_{op}$$$ and $$$u_{nm}$$$ are largely orthogonal to the $$$u_{wc}$$$ ($$$S_{RF\_risk}\le 0.23$$$) in agreement with low sensor signals and heating values.
Discussion and Conclusion
A simple geometrical approach is presented to score measurement-based pTx performance on sensor-equipped implants for both implant safety and imaging quality. The method can be used for a fast evaluation and consecutive optimization of excitation vectors. The next steps will include the evaluation of the optimizations based on measured $$$Q_{s}$$$ data, which requires prior implant sensor calibrations to accurately determine absolute implant tip heating values. Further investigations will include e.g. numerical simulations can be applied to evaluate its effectiveness for a variety of scenarios (e.g. different body models, implant types and locations).Acknowledgements
This work has received funding from the European Partnership on Metrology, co-financed by the European Union’s Horizon Europe Research and Innovation Programme and by the Participating States, under grant number 21NRM05 STASIS.References
1. Eryaman Y, Kobayashi N, Moen S, et al. A simple geometric analysis method for measuring and mitigating RF induced currents on Deep Brain Stimulation leads by multichannel transmission/reception. NeuroImage. 2019;184:658-668. doi:10.1016/J.NEUROIMAGE.2018.09.072
2. Sadeghi-Tarakameh A, DelaBarre L, Zulkarnain NIH, Harel N, Eryaman Y. Implant-Friendly Excitation Strategies for Imaging DBS Electrodes at 7T. In: Intl. Soc. Mag. Reson. Med. ; 2021:414.
3. Winter L, Seifert F, Zilberti L, Murbach M, Ittermann B. MRI-Related Heating of Implants and Devices: A Review. J Magn Reson Imaging. doi:10.1002/jmri.27194
4. Silemek B, Seifert F, Petzold J, et al. Rapid safety assessment and mitigation of radiofrequency induced implant heating using small root mean square sensors and the sensor matrix Qs. Magn Reson Med. 2022;87(1):509-527. doi:10.1002/mrm.28968
5. Winter L, Silemek B, Petzold J, et al. Parallel transmission medical implant safety testbed: Real-time mitigation of RF induced tip heating using time-domain E-field sensors. Magn Reson Med. 2020;84(6):3468-3484. doi:https://doi.org/10.1002/mrm.28379
6. IEC 60601-2-33:2010+AMD1:2013+AMD2:2015 CSV | IEC Webstore. Accessed November 8, 2021. https://webstore.iec.ch/publication/22705
7. ISO - ISO/TS 10974:2018 - Assessment of the Safety of Magnetic Resonance Imaging for Patients with an Active Implantable Medical Device. Accessed October 13, 2019. https://www.iso.org/standard/65055.html
8. Silemek B, Seifert F, Ittermann B, Winter L. Wireless reference implant and communication methodology to assess and investigate RF safety and pTx mitigation strategies for AIMDs. In: Proc. Intl. Soc. Mag. Reson. Med. Vol 30. ; 2022:4300.
9. Silemek B, Seifert F, Brühl R, et al. Mitigation of RF-induced heating on realistic deep brain stimulator lead trajectories by wireless sensor Q-matrix and parallel transmission. In: Proc. Intl. Soc. Mag. Reson. Med. Vol 30. ; 2022:173.
10. Silemek B, Seifert F, Petzold J, Ittermann B, Winter L. Smart Implants Interfaced with MR Scanners to Improve Implant Safety. In: ISMRM Workshop on MR Safety: From Physics & Physiology to Policies & Practice. ; 2022.
11. Etezadi-Amoli M, Stang P, Kerr A, Pauly J, Scott G. Controlling radiofrequency-induced currents in guidewires using parallel transmit. Magn Reson Med. 2015;74(6):1790-1802. doi:10.1002/mrm.25543
Figures
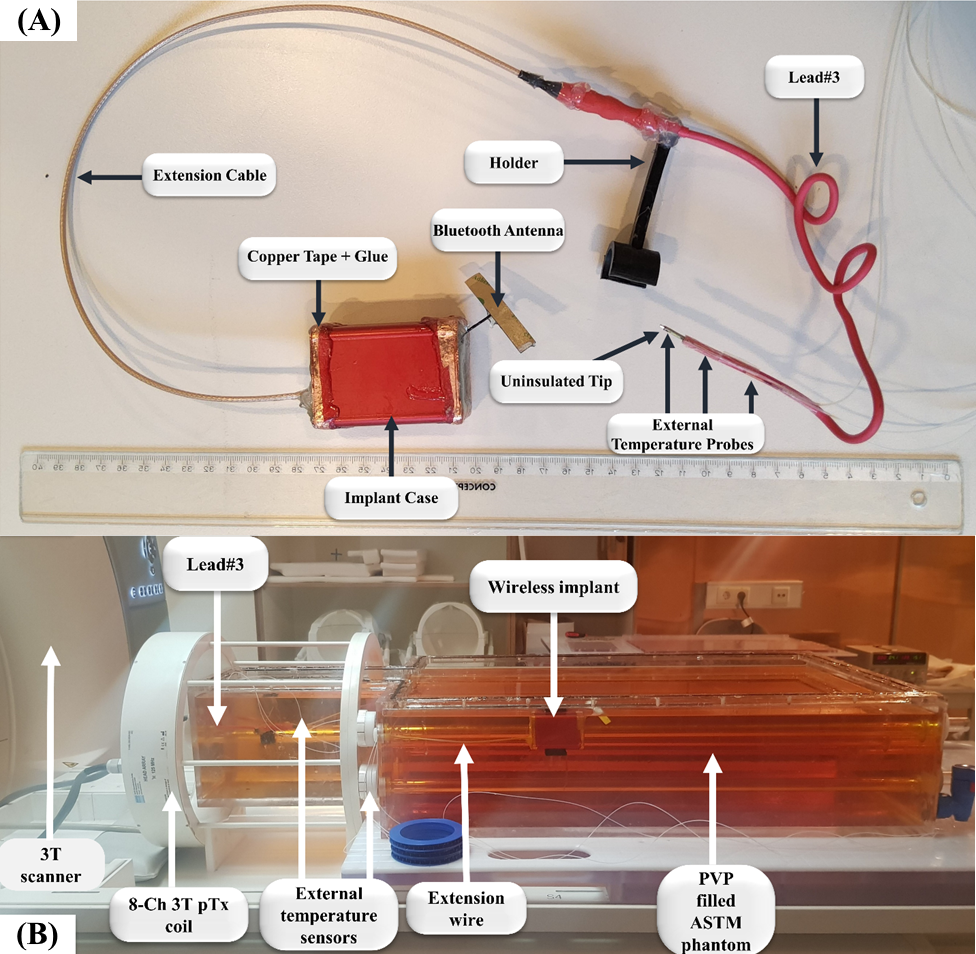
Figure 1: Experimental setup. (A) Photograph of the wireless reference implant, which is capable of measuring and wirelessly transferring RF-induced signals from the implant lead tip.8–10 The temperature rise at the tip was measured with external temperature probes (CANSAS FBG-T8). (B) The reference implant inside the ASTM phantom in a 3T pTx capable MRI (Verio, Siemens). The implant with an extension wire was inserted into an 8-channel 3T pTx coil (RAPID Biomedical).