0597
Ultra-low-field Magnetization Transfer Imaging with Low SAR1Laboratory of Biomedical Imaging and Signal Processing, the University of Hong Kong, Hong Kong, China, 2Department of Electrical and Electronic Engineering, the University of Hong Kong, Hong Kong, China
Synopsis
Keywords: Low-Field MRI, Contrast Mechanisms
At high field, magnetization transfer (MT) imaging suffers from the high specific absorption ratio (SAR) issue due to the usage of high power off-resonance MT RF pulses, and on-resonance saturation caused by B0 field inhomogeneity. At ultra-low-field (ULF), the low SAR and low absolute B0 inhomogeneity (in Hz) greatly facilitates the application of strong and versatile MT pulses without the confounding on-resonance saturation in practice. We demonstrate brain MT imaging at ULF first the first time using a 0.055 Tesla MRI platform with an extremely low SAR.Introduction
MR magnetization transfer contrast (MTC) reflects the dipolar interaction/chemical exchange between a “free pool” and “bound pool”1. It can provide valuable information for clinical diagnosis due to its sensitivity to a broad range of pathologies2. MTC is achieved through applying off-resonance magnetization transfer (MT) RF pulses followed by the conventional imaging sequences1,3,4. However, at high field, specific absorption rate (SAR) issue limits its application because it requires high power RF MT pulses to achieve off-resonance saturation of macromolecules5. MT also requires excellent B0 field homogeneity to avoid on-resonance saturation of water molecules, which becomes challenging at high field, especially for abdominal imaging. Ultra-low-field (ULF) MRI incurs extremely low transmitting RF power (i.e., low power deposition or low SAR), and exhibits low absolute B0 inhomogeneity (in Hz)6, thus greatly facilitating the application of MT RF pulses of various shapes and durations. Here, we aim to demonstrate MTC at 0.055 Tesla.Method
Phantom and in vivo human brain MRI experiments were conducted on a low-cost 0.055T MRI scanner with a self transmit/receive head coil6. This scanner was based on a SmCo permanent magnet with peak-to-peak B0 inhomogeneity under 200 ppm within 24 cm DSV. It was free from any RF shielding via active detection, prediction and cancellation of electromagnetic interference signals.Sequence
A 3D GRE sequence with and without an MT preparation module immediately before excitation RF pulse was implemented with TR/TE = 66/6ms, excitation flip angle = 40°, 75% partial echo acquisition, BW = 6.25kHz, resolution = 2×2×10mm3, acquisition matrix = 128×128×32, reconstruction matrix = 1×1×5mm3, and NEX = 2. Within the MT preparation module, multiple off-resonance MT pulses interleaved with spoiler gradients along all three directions were implemented.
Phantom experiments
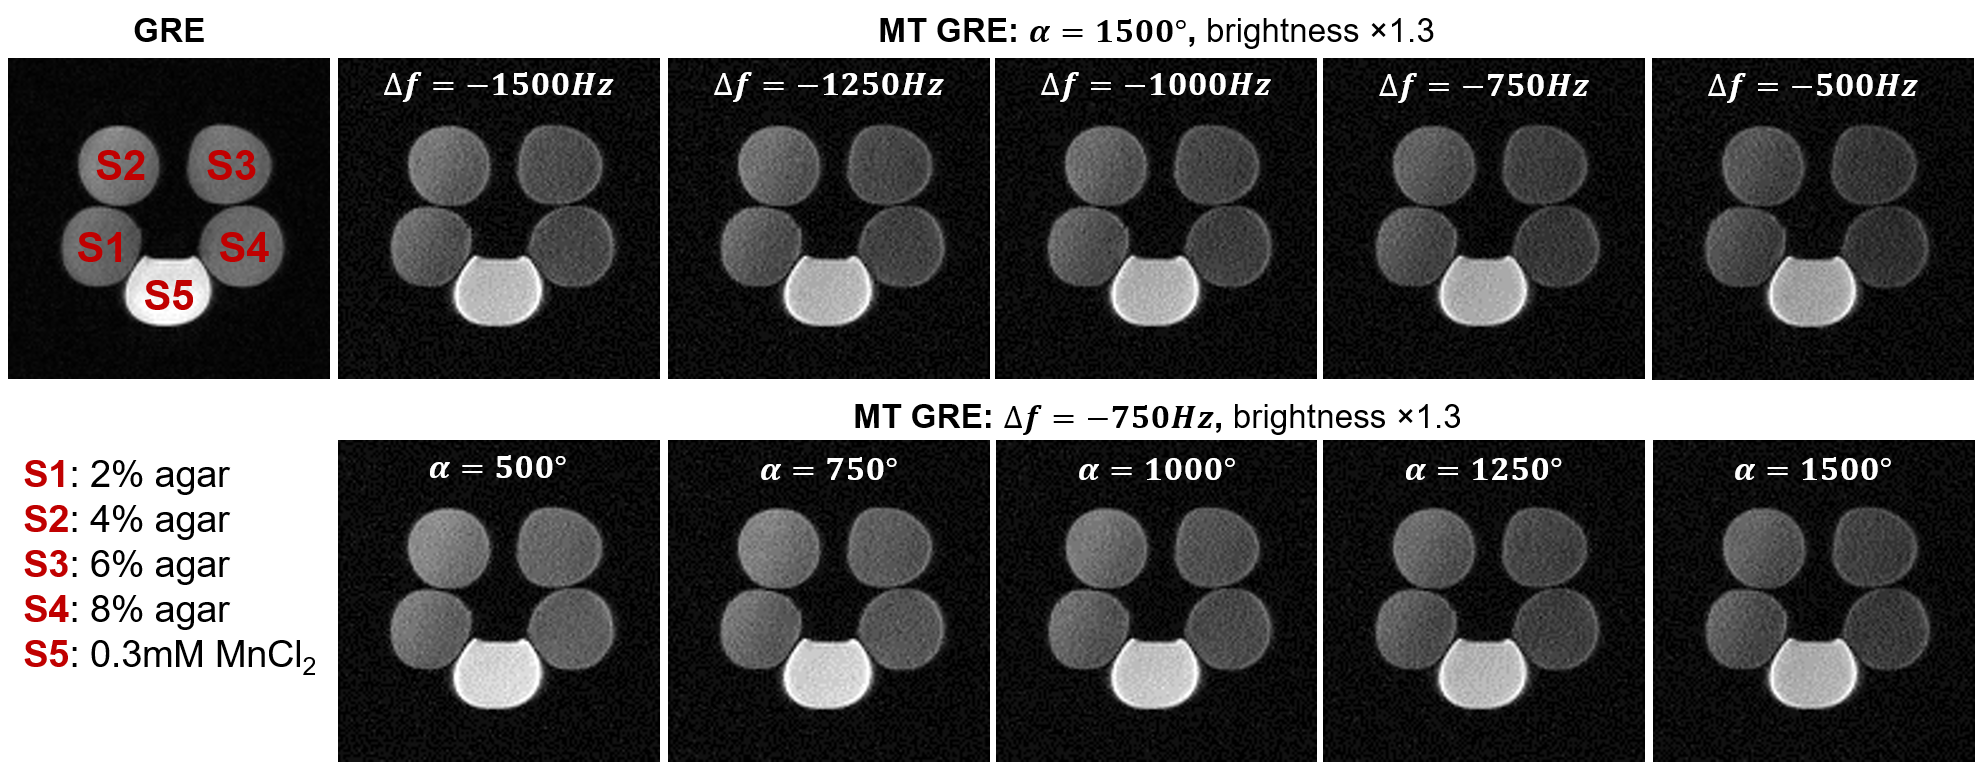
Agar gel phantoms (with concentrations 2%, 4%, 6% and 8% by weight) and 0.3mM MnCl2 solution phantom (with no MT effect) were scanned. To achieve different levels of MT saturation, single Gaussian RF pulse with 7.5ms duration and 240Hz bandwidth was applied with different flip angle α and frequency offset Δf within each TR. Before scanning, linear shimming was performed with typical FID spectral FWHM and FW at 10% maximum as ~35Hz and ~310Hz, respectively.
In vivo experiments
Normal subjects and one patient were enrolled in the in vivo experiments. The study was conducted under an institutional review board research protocol. Written informed consent was obtained from each subject prior to the study. For comparison, scans with and without MT preparation module were conducted on all subjects. Two MT pulses with flip angle 1500° and frequency offset -750Hz were applied within each TR. Other parameters were kept the same as those used in the phantom experiments. Before scanning, linear shimming was performed with typical FID spectral FWHM and FW at 10% maximum as~35Hz and ~370Hz, respectively. Magnetization transfer ratio (MTR) maps were calculated by $$$MTR=(M_0 - M_{SAT})/M_0$$$.
Results
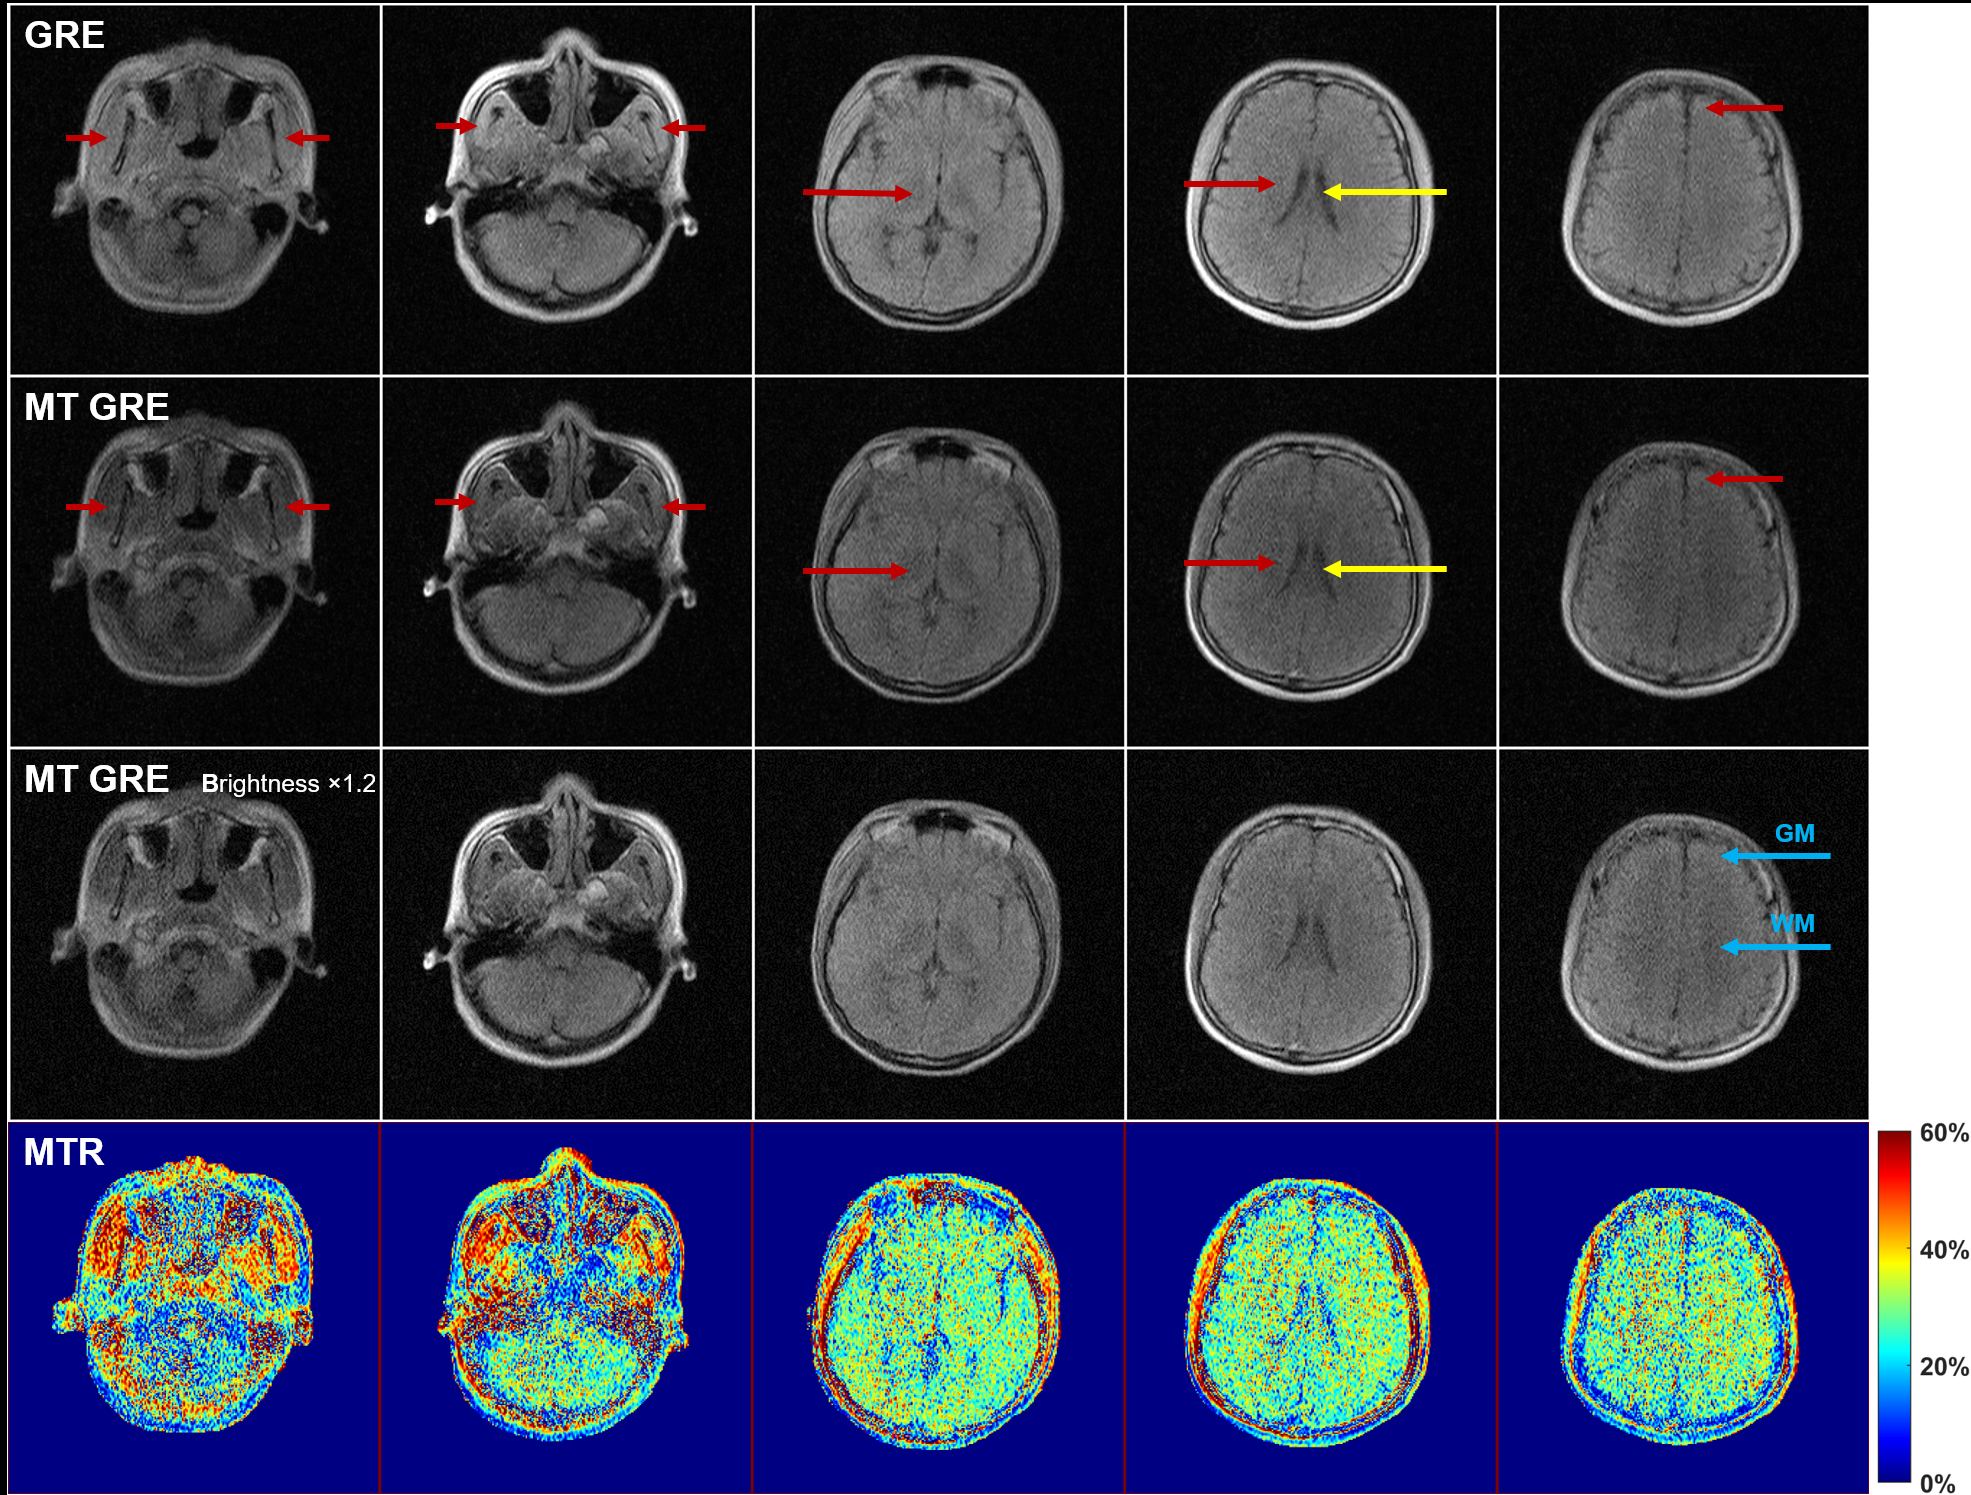
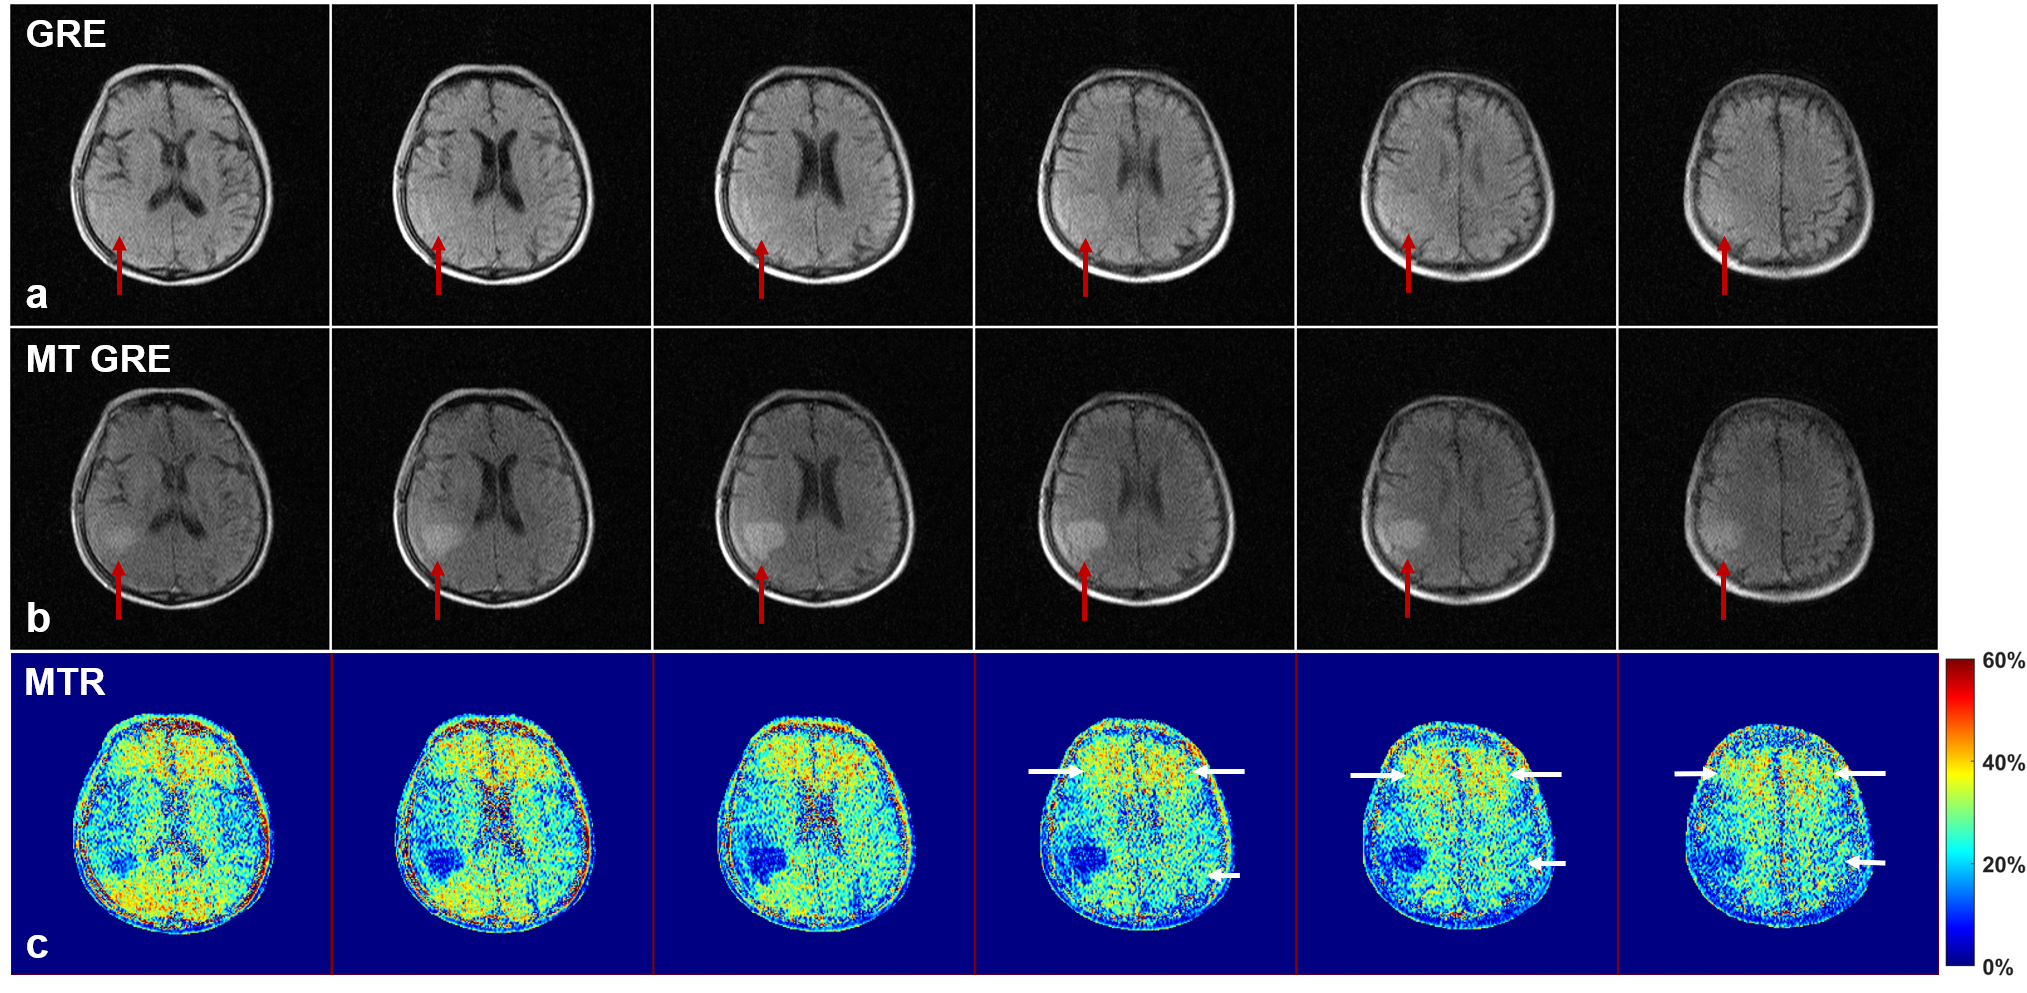
As shown in Fig. 1, agar gel phantoms exhibited signal reduction with increasing MT pulse flip angle α and decreasing frequency offset Δf. Fig. 2 shows the typical results from a normal subject. Gray matter (GM), white matter (WM) and muscle exhibited stronger MT effect than cerebrospinal fluid (CSF) and scalp lipid. With MT, the GM vs. WM contrast became stronger due to the stronger MT effect in WM than in GM. Fig. 3 shows the results from a 66 yrs. old patient with a right parietal hemorrhagic cystic lesion. With MT, the contrast of the lesion vs. surrounding GM and WM tissue significantly increased, allowing clear demarcation of the lesion boundary. As the lesion was cystic, it exhibited lower MTR than the GM and WM. Note that frontal and parietal brain regions exhibited slightly different MRT values possibly due to WM changes.We further calculated the SAR for brain MT pulses by $$$SAR=(\sigma/2\rho)\cdot(\pi f B_1R)^2 \cdot D$$$, where D is the duty cycle, α, ρ and R are the conductivity, mass density and radius of medium, respectively7. With σ=0.33S/m, ρ=1046kg/m3, R=0.1m, f=2.3MHz, and MT pulse flip angle = 1500° (corresponding to 26 uT at the peak of the Gaussian pulse), the resulting SAR within MT pulse train (D=100%) and entire TR (D=23%) was estimated to be 0.0167W/kg and 0.0038W/kg, respectively.
Discussion and Conclusions
The inherently low SAR of ultra-low-field (ULF) MRI offers an advantage in MT imaging by allowing strong and long MT pulse train to manipulate MTC in a flexible and safe manner. At 0.055 Tesla, the SAR due to the MT pulses was found to be approximately 0.0038W/kg in this preliminary study, far below the FDA SAR limit of 3.2W/kg for brain imaging. Furthermore, despite the high relative B0 inhomogeneity (in ppm) in typical low-cost portable ULF MRI hardware systems, the absolute B0 inhomogeneity (in Hz) remains generally small. Meanwhile, tissue/air susceptibility effect dramatically decreases at ULF. These factors are expected to enable MT imaging with safe and versatile MT pulses at ULF, without the confounding on-resonance water saturation in practice.Acknowledgements
This work was supported in part by Hong Kong Research Grant Council (R7003-19F, HKU17112120, HKU17127121 and HKU17127022 to E.X.W., and HKU17103819, HKU17104020 and HKU17127021 to A.T.L.L.), Lam Woo Foundation, and Guangdong Key Technologies for AD Diagnostic and Treatment of Brain (2018B030336001) to E.X.W..References
[1] Wolff SD, Balaban RS. Magnetization transfer contrast (MTC) and tissue water proton relaxation in vivo. Magn Reson Med 1989;10(1):135-144.
[2] Wolff SD, Balaban RS. Magnetization transfer imaging: practical aspects and clinical applications. Radiology 1994;192(3):593-599.
[3] Hu BS, Conolly SM, Wright GA, Nishimura DG, Macovski A. Pulsed saturation transfer contrast. Magn Reson Med 1992;26(2):231-240.
[4] Graham SJ, Henkelman RM. Pulsed magnetization transfer imaging: evaluation of technique. Radiology 1999;212(3):903-910.
[5] Henkelman RM, Stanisz GJ, Graham SJ. Magnetization transfer in MRI: a review. NMR Biomed 2001;14(2):57-64.
[6] Liu Y, Leong ATL, Zhao Y, Xiao L, Mak HKF, Tsang ACO, Lau GKK, Leung GKK, Wu EX. A low-cost and shielding-free ultra-low-field brain MRI scanner. Nature Communications 2021;12(1):7238.
[7] Panych LP, Madore B. The physics of MRI safety. J Magn Reson Imaging 2018;47(1):28-43.
Figures