0595
Comparison of measured and simulated cardiac magnetostimulation thresholds in eight pigs1A. A. Martinos Center for Biomedical Imaging, Department of Radiology, Massachusetts General Hospital, Charlestown, MA, United States, 2Harvard Medical School, Boston, MA, United States, 3Computer Assisted Clinical Medicine, Medical Faculty Mannheim, Heidelberg University, Mannheim, Germany, 4Harvard-MIT Division of Health Sciences and Technology, Cambridge, MA, United States, 5Cardiovascular Research Center, Cardiology Division, Massachusetts General Hospital, Charlestown, MA, United States, 6Cardiovascular Innovation Research Center, Heart Vascular & Thoracic Institute, Cleveland Clinic, Cleveland, OH, United States, 7Cardiovascular Imaging, Imaging Institute, Cleveland Clinic, Cleveland, OH, United States, 8Biomedical Engineering, Lerner Research Institute, Cleveland Clinic, Cleveland, OH, United States
Synopsis
Keywords: Safety, Bioeffects & Magnetic Fields
We use a combined electromagnetic-electrophysiological modeling framework to predict cardiac stimulation (CS) thresholds in individualized porcine body models and compare those simulations to thresholds measured in eight pigs using strong dB/dt pulses. For all pigs, the simulated and measured thresholds agree within 30%, and no significant differences between simulations and measurements were detected (p<0.05, paired t-test). The threshold model uncertainty was found to be ~25% in a sensitivity analysis of the relevant model parameters. A well-validated model may help inform appropriate safety limits for MRI gradients to protect patients from CS without overly restricting gradient performance.Purpose
The IEC 60601-2-33 standard[1] limits the maximum dB/dt of MRI gradient systems to protect patients from cardiac stimulation (CS)[2-5]. This limit is a strength-duration curve[6] derived from electrode stimulation studies in animals[2, 7] where the electrode current rheobase was translated to a dB/dt value using electromagnetic (EM) field calculations in a homogeneous body model[7], with an additional safety factor. There are indications that this limit may be overly conservative; for example, it is more limiting than the peripheral nerve stimulation limit for the Siemens Connectome scanner (Siemens Healthineers, Erlangen, Germany) at rise times >1.5 ms[8]. This seems unlikely because cardiac fibers are harder to stimulate than peripheral nerves[3], and the heart is deep in the body and therefore somewhat shielded from E-fields[9]. To our knowledge, only two groups have measured cardiac magnetostimulation thresholds (i.e., CS caused by time-varying magnetic fields) in animals[10-13], and those results are difficult to translate to humans[9].In this work, we model cardiac magnetostimulation of Purkinje and myocardial fibers in pig-specific models constructed from MR images, compare those simulations to CS threshold measurements in eight pigs[13], and perform a detailed uncertainty analysis with respect to the relevant model parameters. This allows us to validate the CS prediction model, which will be crucial to estimating and understanding MRI CS thresholds in humans.
Methods
CS threshold measurements in pigsWe recently measured CS thresholds in ten healthy, anesthetized pigs[13], which are an established animal model for the human cardiovascular system[14]. In these experiments, capacitors were discharged into a flat spiral coil placed close to the porcine torso, which produced a strong damped sinusoidal EM field pulse at the circuit resonance frequency fres=715 Hz. Pulses were triggered by the ECG at two time points: 1) after the T-wave (early diastole), and 2) before the P-wave (late diastole). CS thresholds were determined from sigmoid fits to the binary cardiac response (stimulation or no stimulation) measured at different capacitor voltages.
EM field simulations in pig-specific body models
Pigs were placed on an MRI-compatible table, which allowed maintaining the pigs’ body position and posture during the stimulation experiment and subsequent MRI scan. Fat-water-separated Dixon and CINE images were acquired in eight of the ten pigs, and were used to create individualized body models by thresholding and manual segmentation[13] (spatial resolution: 1x1x1 mm3, Figure 1A). Electrical conductivity values were assigned using the IT’IS (Zurich, Switzerland) low-frequency material database v4.0[15]. E-fields were then simulated[13] using Sim4Life’s (Zurich MedTech, Switzerland) low-frequency magnetoquasistatic solver at the resonance frequency of the LC stimulation circuit (fres=715 Hz) for a coil current of 1 A (spatial resolution: 1x1x1 mm3, Figure 1B).
Prediction of CS thresholds
Epi- and endo-cardial surfaces of the heart were reconstructed from the segmented CINE images (diastolic phase), and used to add subendocardial Purkinje and ventricular muscle fiber networks to the models using rule-based algorithms[16, 17]. We then projected the E-field onto the fiber paths (Figure 2), integrated along them, and modulated the resulting electrical potential in time by the stimulating damped sinusoidal 715-Hz waveform. Finally, we computed the response of the Purkinje and ventricular fibers using electrophysiological (EP) fiber models[9] (Figure 3).
Uncertainty analysis of predicted thresholds
We performed an uncertainty analysis of our simulation pipeline by calculating the impact of individual model parameter variations on the predicted CS thresholds. In this analysis, we considered uncertainties of the electrical conductivity of the tissue classes in the porcine body model, EP fiber model parameters, coil position estimate, and Purkinje network geometry (5 semi-random realizations). To reduce computational time, the uncertainty analysis was performed only in pig #7, as we expect similar results for all pigs. These simulations allowed us to estimate the sensitivity coefficients for individual model parameters, $$$\frac{\partial V_{thresh}}{\partial x}$$$, which were then combined to give the total uncertainty $$$\Delta V_{thresh}$$$:
$$\Delta V_{thresh}=\sqrt{\sum_{i}\left(\frac{\partial V_{thresh}}{\partial x_{i}}\cdot\Delta x_{i}\right)^{2}}$$
with $$$\Delta x_{i}$$$ the estimated uncertainty of parameter $$$x_{i}$$$.
Results
For all pigs, the effective predicted CS threshold is set by the Purkinje fibers. The total estimated uncertainty of the predicted capacitor voltage threshold for pig #7 is ΔVthresh=1520 V (Table 1, ~25% of the 6040-V threshold predicted for this pig).For each pig, the difference between predicted and measured CS thresholds is within the simulation uncertainty (Figure 4A), indicating that the prediction model is valid within this uncertainty. On average, the predicted and measured thresholds agree within <12% (Figure 4B). No significant difference was detected between simulations and measurements at the p=0.05 significance level (paired t-test).
Discussion
This is the first study comparing simulated and measured CS thresholds and using individualized body models to facilitate comparison. No significant difference was found between predicted and measured thresholds (p<0.05, paired t-test). A sensitivity analysis of the most important model parameters showed a simulation uncertainty of ~25% for realistic model parameter variations.A well-validated, accurate model may allow translation of CS thresholds measured in animals with local coils to human CS thresholds from MRI gradient coils where similar modeling can be applied[9]. Simulations in a diverse population of human body models and gradient configurations will help inform safe limits for the operation of fast-switching, high-amplitude gradient systems.
Acknowledgements
This study was supported by NIH award number R01 EB028250.References
[1] IEC, International standard IEC 60601 medical electrical equipment. Part 2-33: Particular requirements for the basic safety and essential performance of magnetic resonance equipment for medical diagnosis. 2010, International Electrotechnical Commission (IEC).
[2] Reilly J P, Magnetic field excitation of peripheral nerves and the heart: A comparison of thresholds. Med. Biol. Eng. Comput., 1991. 29: 571-579.
[3] Irnich W, Electrostimulation by time-varying magnetic fields. MAGMA, 1994. 2: 43-49.
[4] Nyenhuis J A, Bourland J D, Mouchawar G A, Geddes L A, Foster K S, Jones J L, Schoenlein W E, Graber G P, Elabbady T Z, Schaefer D J, and Riehl M E, Magnetic stimulation of the heart and safety issues in magnetic resonance imaging, in Biomagnetic stimulation, S. Ueno, Editor. 1994, Springer: Boston, MA. p. 75-89.
[5] Schaefer D J, Bourland J D, and Nyenhuis J A, Review of patient safety in time-varying gradient fields. J. Magn. Reson. Imaging, 2000. 12: 20-29.
[6] Blair H A, On the intensity-time relations for stimulation by electric currents I. J. Gen. Physiol., 1932. 15(6): 709-729.
[7] Reilly J P, Principles of nerve and heart excitation by time-varying magnetic fields. Ann. N. Y. Acad. Sci., 1992. 649: 96-117.
[8] Setsompop K, Kimmlingen R, Eberlein E, Witzel T, Cohen-Adad J, McNab J A, Keil B, Tisdall M D, Hoecht P, Dietz P, Caluey S F, Tountcheva V, Matschl V, Lenz V H, Heberlein K, Potthast A, Thein H, Van Horn J, Toga A, Schmitt F, Lehne D, Rosen B R, Wedeen V, and Wald L L, Pushing the limits of in vivo diffusion MRI for the Human Connectome Project. NeuroImage, 2013. 80: 220-233.
[9] Klein V, Davids M, Schad L R, Wald L L, and Guérin B, Investigating cardiac stimulation limits of MRI gradient coils using electromagnetic and electrophysiological simulations in human and canine body models. Magn. Reson. Med., 2021. 85: 1047–1061.
[10] Mouchawar G A, Bourland J D, Nyenhuis J A, Geddes L A, Foster K S, Jones J T, and Graber G P, Closed-chest cardiac stimulation with a pulsed magnetic field. Med. Biol. Eng. Comput., 1992. 30: 162-168.
[11] Nyenhuis J A, Bourland J D, Schaefer D J, Foster K S, Schoelein W E, Mouchawar G A, Elabbady T Z, Geddes L A, and Riehl M E. Measurement of cardiac stimulation thresholds for pulsed z-gradient fields in a 1.5-T magnet. In: Proceedings of the 11th Annual Meeting of the SMRM. 1992. Berlin, Germany; p. 586.
[12] Yamaguchi M, Andoh T, Goto T, Hosono A, Kawakami T, Okumura F, Takenaka T, and Yamamoto I, Heart stimulation by time-varying magnetic fields. Jpn. J. Appl. Phys., 1992. 31: 2310-2316.
[13] Klein V, Coll-Font J, Vendramini L, Straney D, Davids M, Ferris N G, Schad L R, Sosnovik D E, Nguyen C T, Wald L L, and Guérin B, Measurement of magnetostimulation thresholds in the porcine heart. Magn. Reson. Med., 2022. 88: 2242-2258.
[14] Dixon J A and Spinale F G, Large animal models of heart failure. Circ., 2009. 2(3): 262-271.
[15] Hasgall P A, Di Gennaro F, Baumgartner C, Gosselin M C, Payne D, Klingenböck A, and Kuster N, IT’IS Database for thermal and electromagnetic parameters of biological tissues Version 4.0. 2018.
[16] Ijiri T, Ashihara T, Yamaguchi T, Takayama K, Igarashi T, Shimada T, Namba T, Haraguchi R, and Nakazawa K, A procedural method for modeling the Purkinje fibers of the heart. J Physiol. Sci., 2008. 58(7): 481-486.
[17] Bayer J D, Blake R C, Plank G, and Trayanova N A, A novel rule-based algorithm for assigning myocardial fiber orientation to computational heart models. Ann. Biomed. Eng., 2012. 40(10): 2243-2254.
[18] Stewart P, Aslanidi O V, Noble D, Noble P J, Boyett M R, and Zhang H, Mathematical models of the electrical action potential of Purkinje fibre cells. Phil. Trans. R. Soc. A, 2009. 367: 2225-2255.
[19] O'Hara T, Virág L, Varró A, and Rudy Y, Simulation of the undiseased human cardiac ventricular action potential: Model formulation and experimental validation. PLoS Comput. Biol., 2011. 7(5): e1002061.
[20] Rudy Y and Quan W, Propagation delays across cardiac gap junctions and their reflection in extracellular potentials: A simulation study. J. Cardiovasc. Electrophysiol., 1991. 2(4): 299-315.
[21] Rudy Y and Quan W, A model study of the effects of the discrete cellular structure on electrical propagation in cardiac tissue. Circ. Res., 1987. 61: 815-823.
[22] Legato M J, Ultrastructure of the atrial, ventricular, and Purkinje cell, with special reference to the genesis of arrhythmias. Circ., 1973. 47: 178-189.
[23] Stankovicova T, Bito V, Heinzel F, Mubagwa K, and Sipido K R, Isolation and morphology of single Purkinje cells from the porcine heart. Gen. Physiol. Biophys., 2003. 22: 329-340.
[24] ten Tusscher K H W J, Noble D, Noble P J, and Panfilov A V, A model for human ventricular tissue. Am. J. Physiol. Heart. Circ. Physiol., 2004. 286: 1573-1589.
Figures
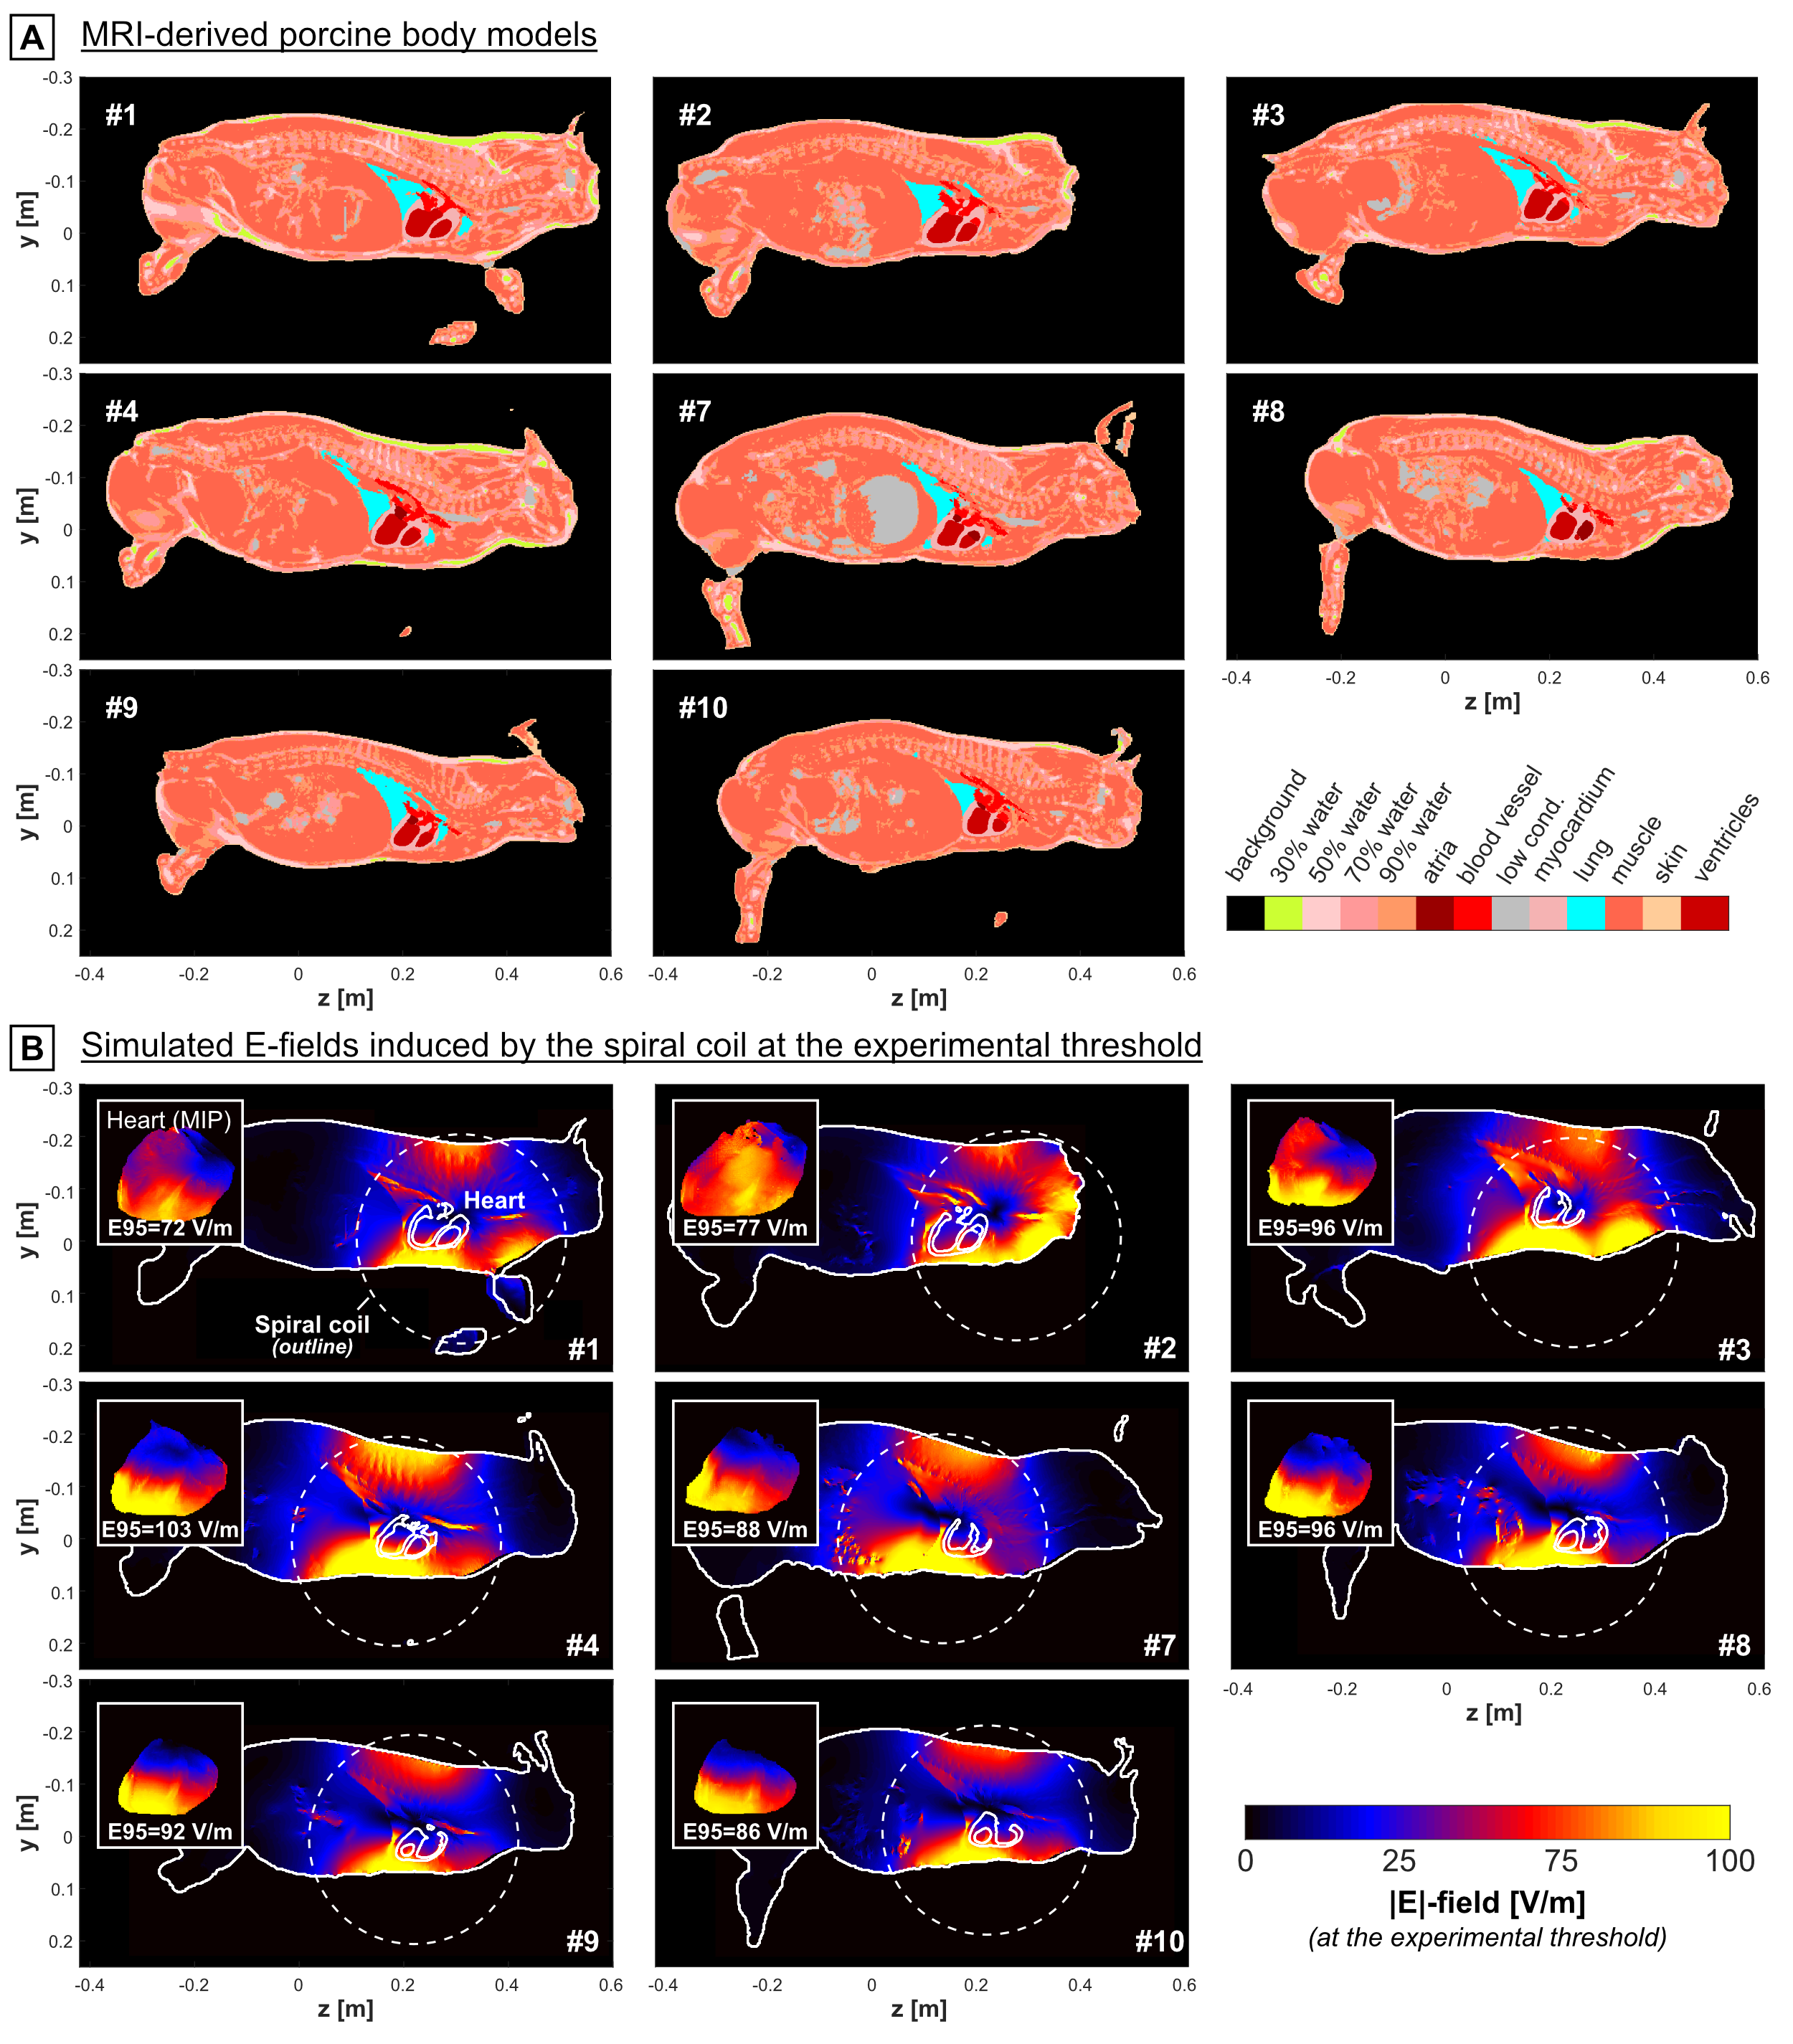
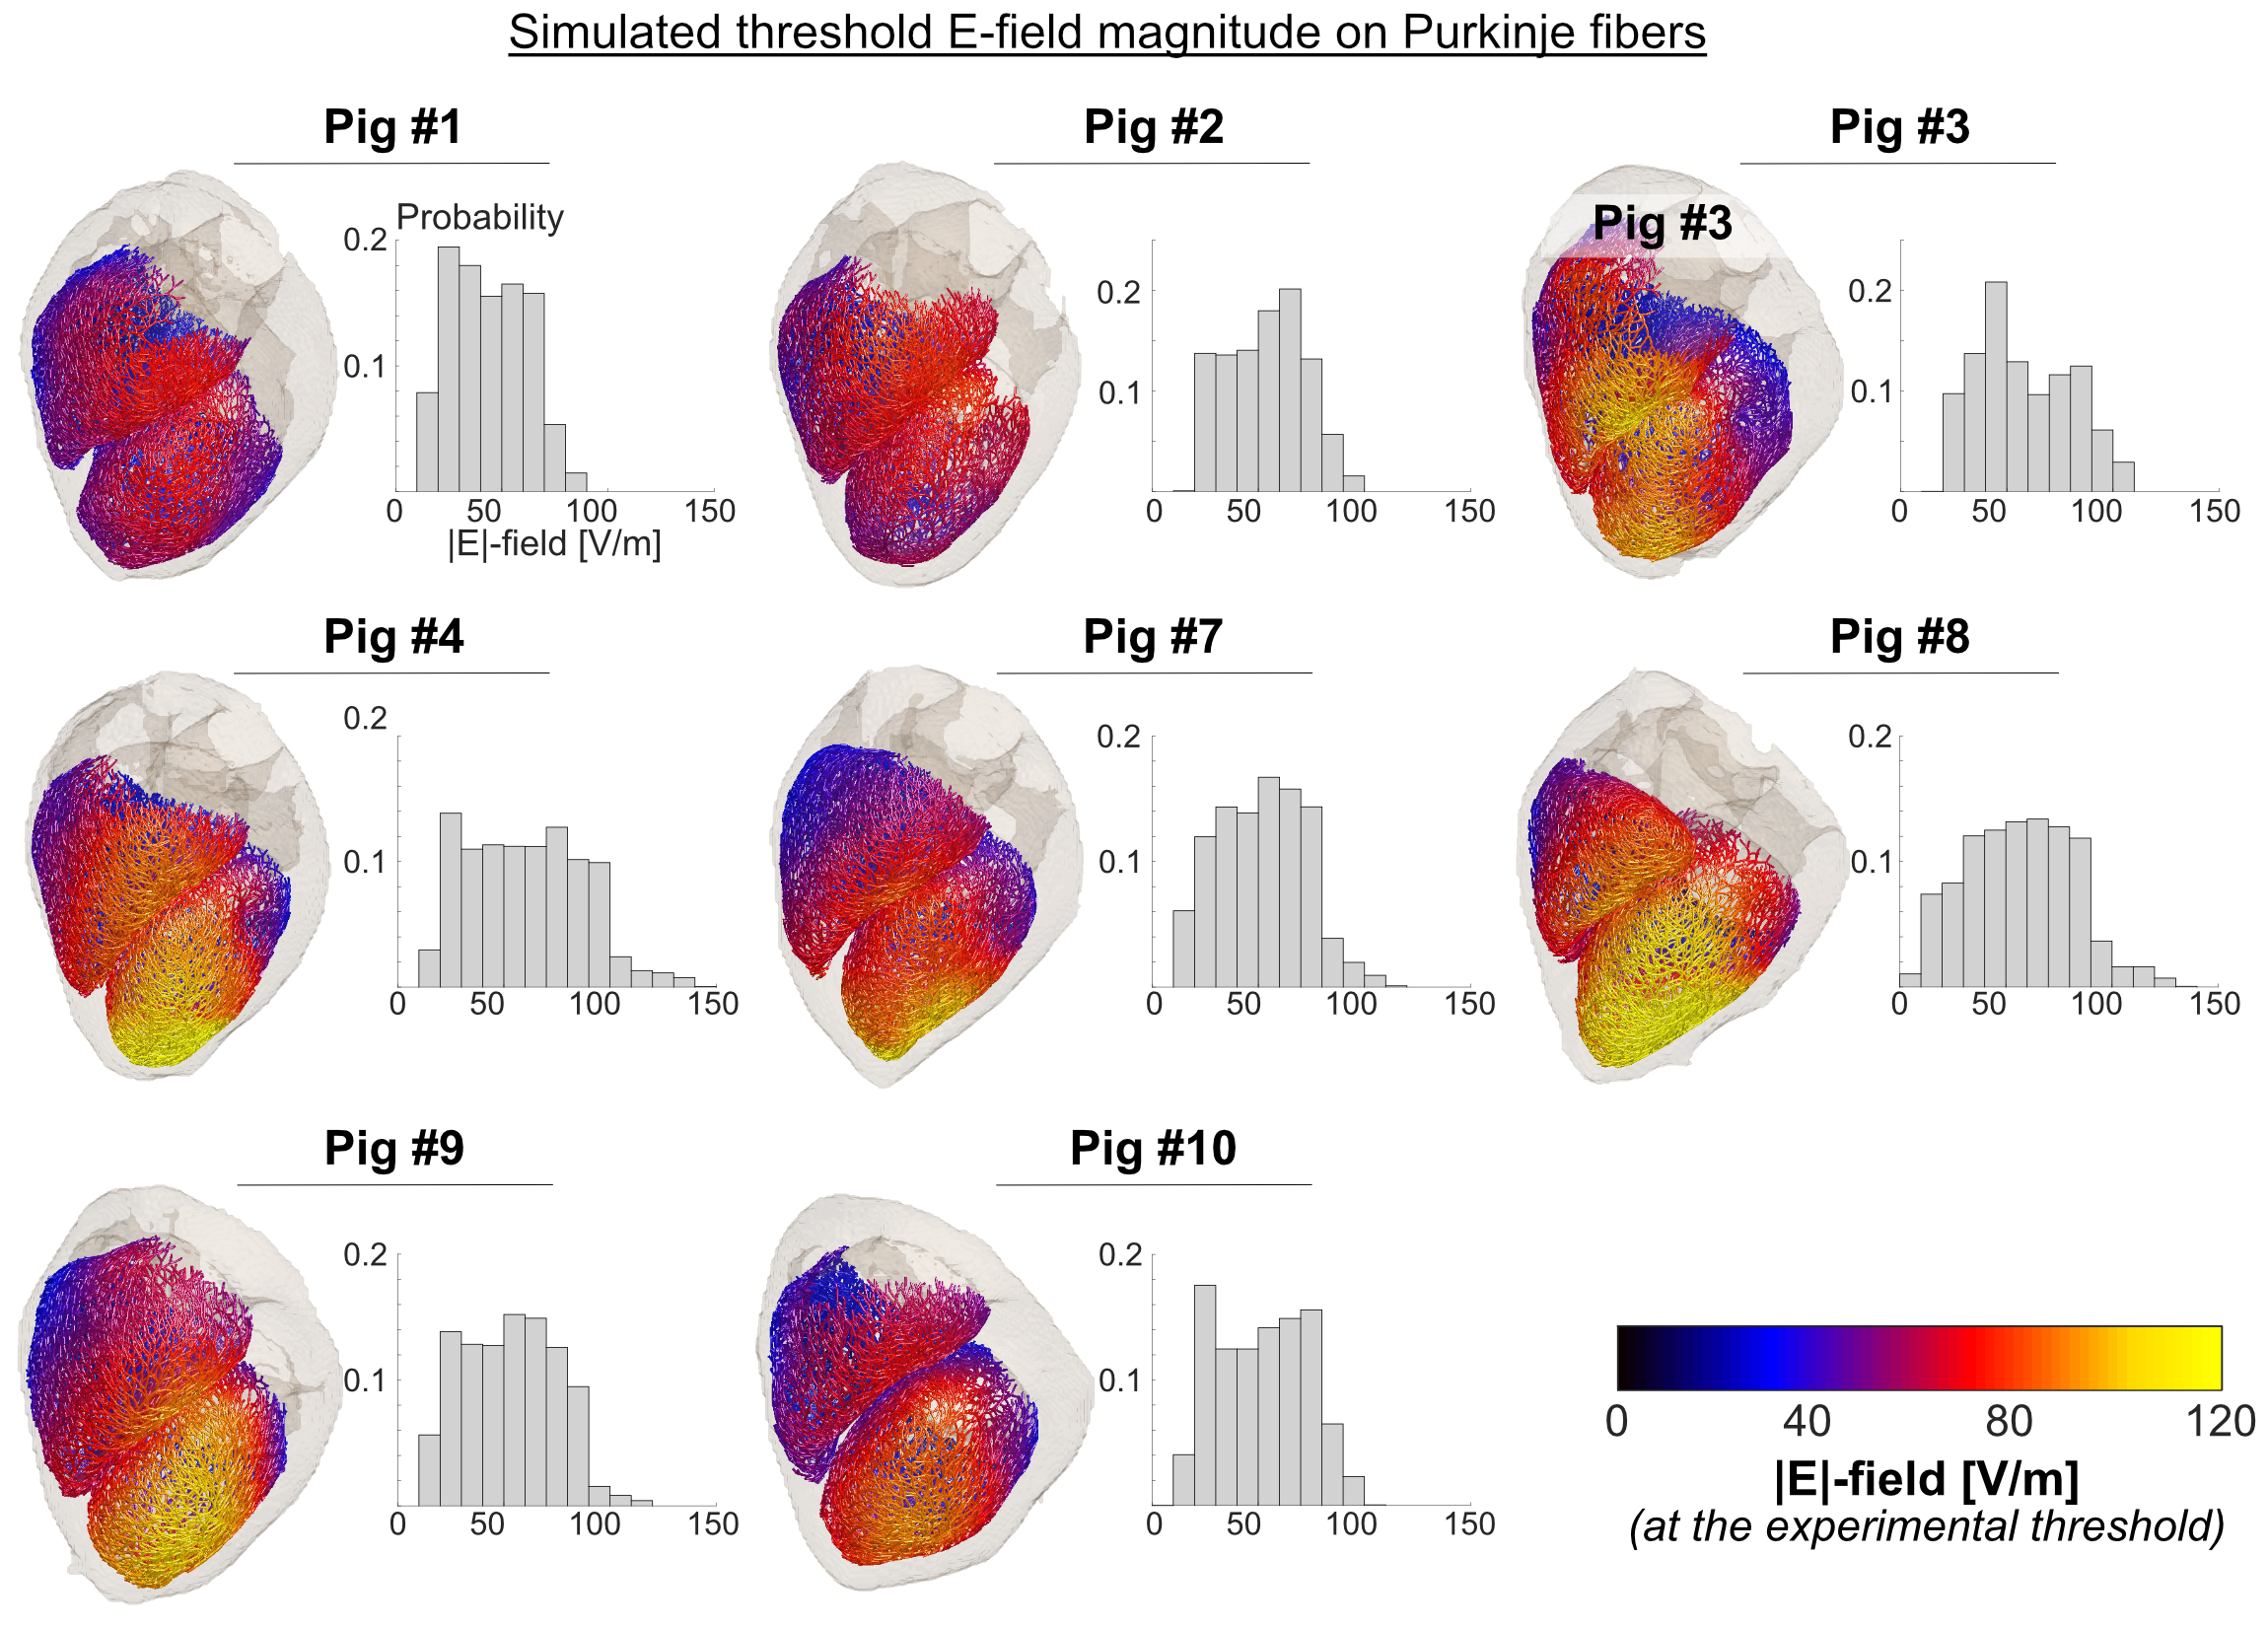
Figure 2: Simulated E-field magnitude induced on the subendocardial Purkinje fibers at the respective experimental cardiac stimulation threshold. Shown here is one of the five networks modeled per pig. The histograms show the distribution of E-field magnitudes on the Purkinje fibers of each porcine model.
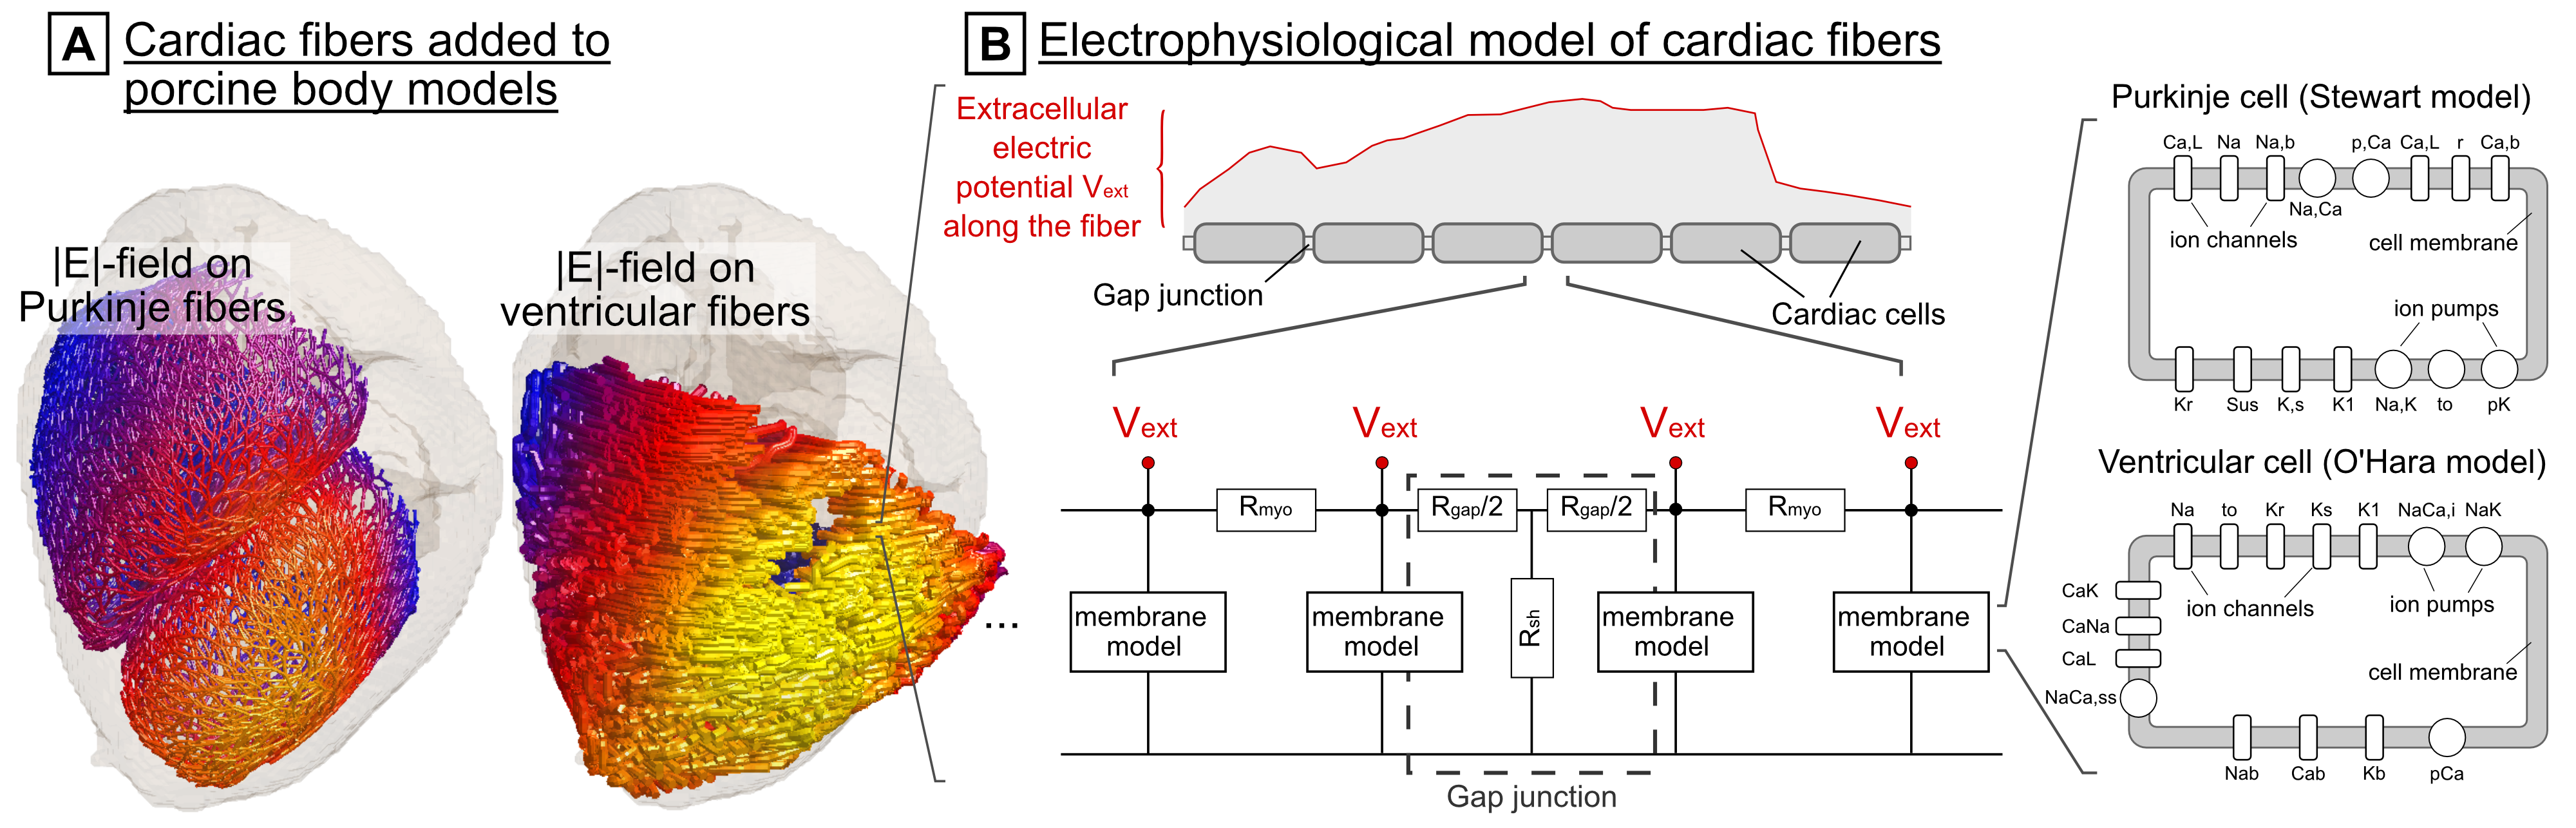
Figure 3: Cardiac stimulation (CS) prediction model (A) Purkinje and ventricular muscle fibers are added to the porcine models using rule-based algorithms[16, 17]. The E-field is projected onto the fiber paths and integrated to obtain the extracellular electric potential. (B) The potential is fed into electrophysiological models consisting of cardiac cells represented by membrane models of mammalian Purkinje cells[18] and ventricular myocytes[19] connected by resistive gap junctions[20, 21]. These models predict the initiation of action potentials in the fibers, and thus CS.
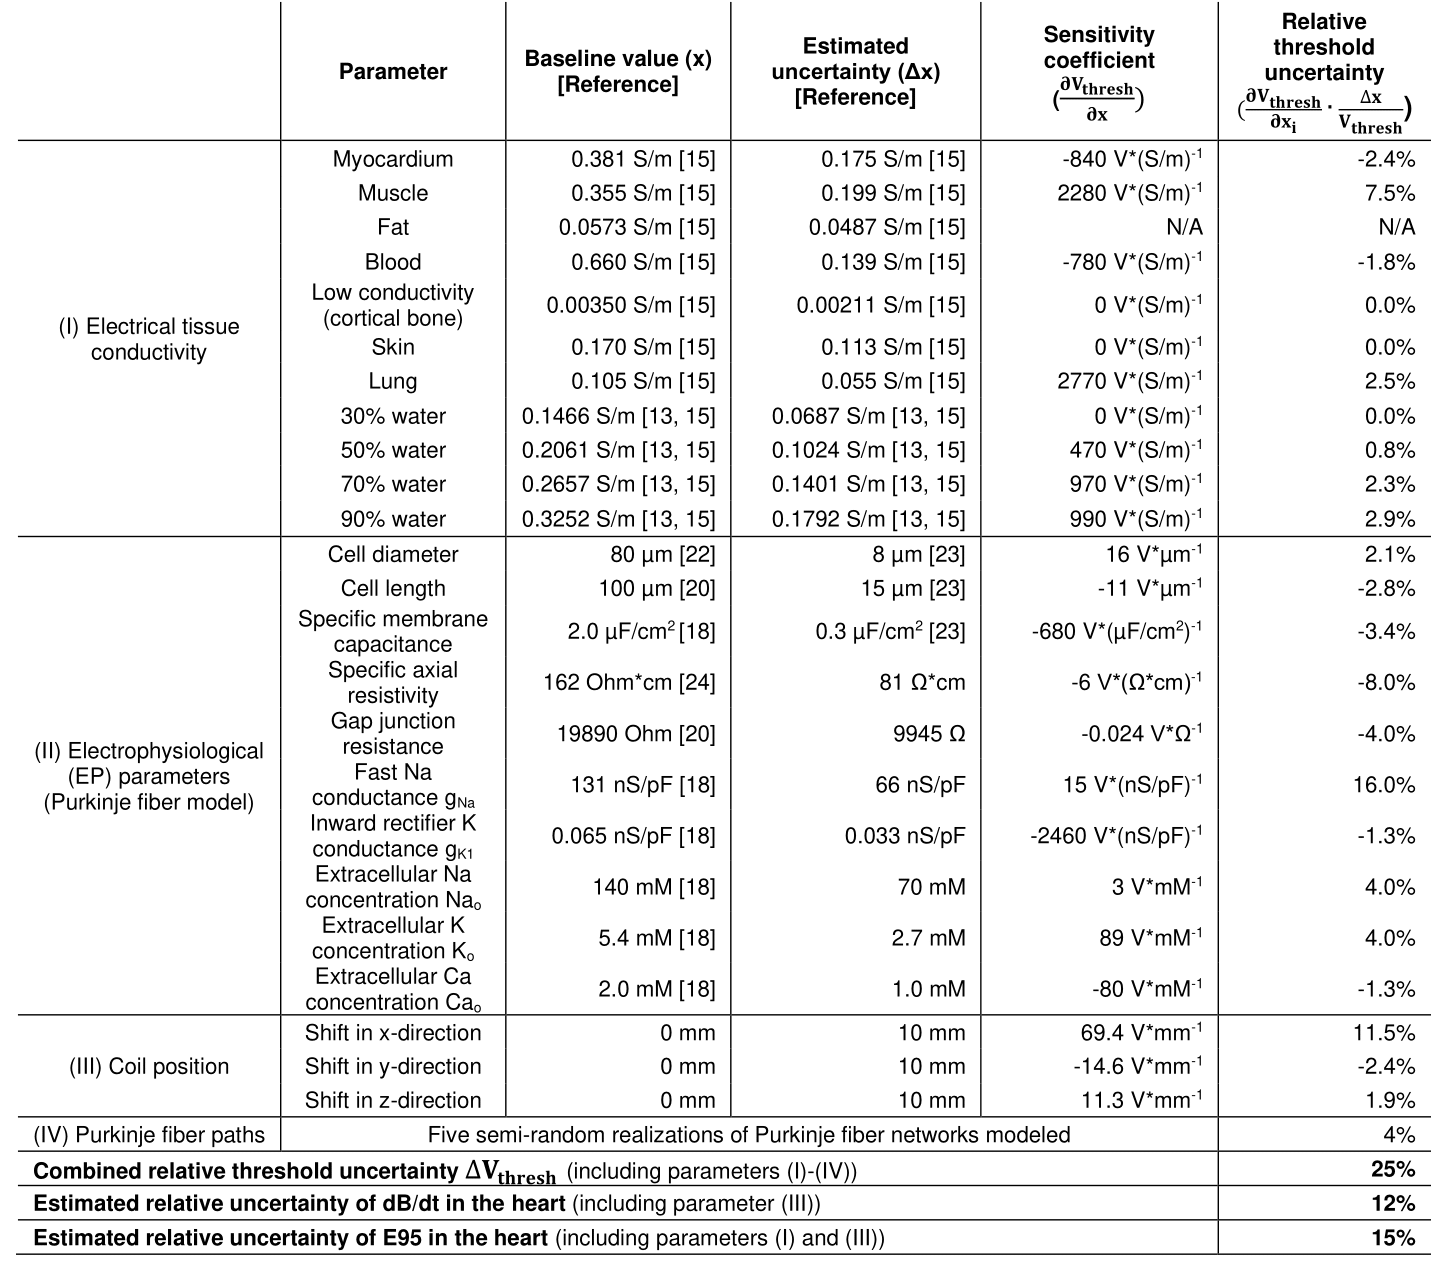
Table 1: Model parameters included in the uncertainty analysis. For parameters for which no uncertainty range was found in the literature, an uncertainty of Δx=50% was assumed. Sensitivity coefficients ($$$\frac{\partial V_{thresh}}{\partial \text{x}}$$$) and relative threshold uncertainties were calculated in pig #7 for parameter variations $$$\partial \text{x}$$$ of ±10% (±10 mm coil shifts). The combined capacitor voltage threshold uncertainty $$$\Delta V_{thresh}$$$ (Equation (1)) is 25%. Estimated uncertainties for dB/dt and E95 values in the heart are 12% and 15%.
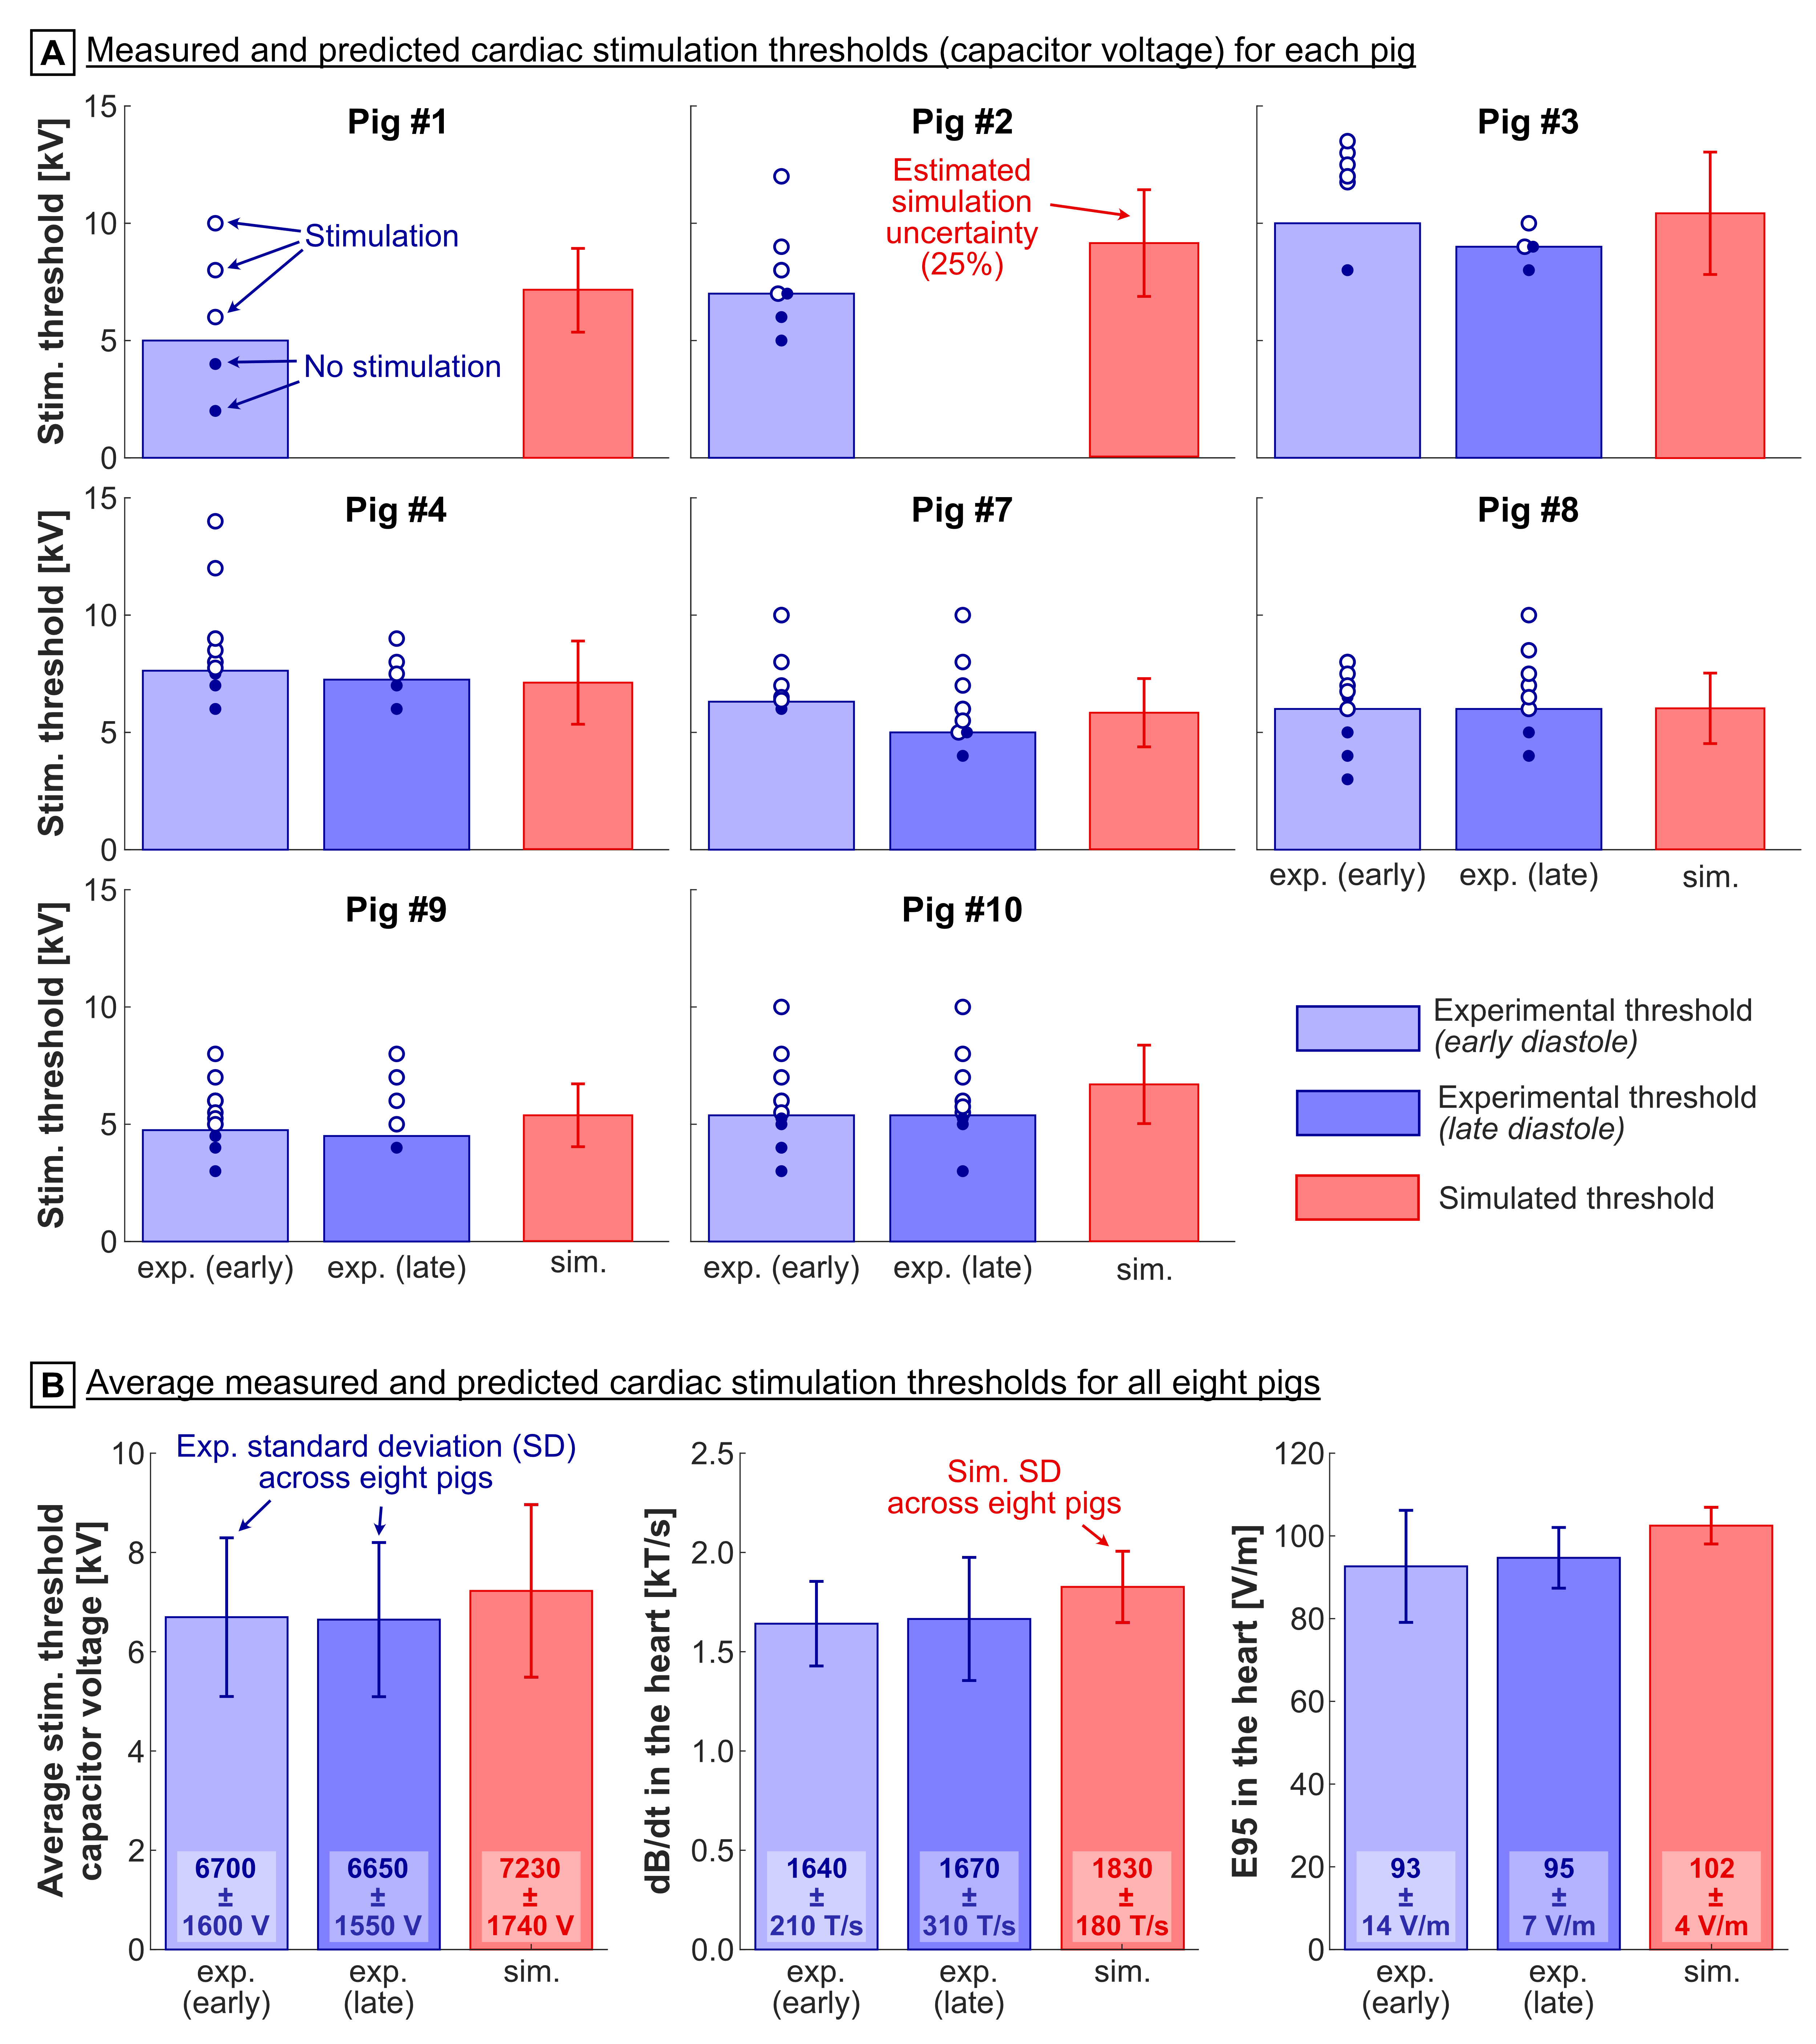
Figure 4: Measured vs predicted cardiac stimulation thresholds. (A) Capacitor voltage thresholds for each pig. Blue bars show experimental thresholds, dots show single measurements at different voltages (open: stimulation, closed: no stimulation). Simulated thresholds are shown as average for 5 Purkinje networks ± estimated simulation uncertainty (25%). No significant differences were found between simulated and measured thresholds (paired t-test). (B) Average thresholds ± standard deviation for all eight pigs (capacitor voltage, dB/dt in the heart, E95 in the heart).