0589
Multicompartment Imaging of the Brain Using a Comprehensive MR Imaging Protocol1Department of Radiology, University of California San Diego, San Diego, CA, United States, 2Department of Bioengineering, University of California San Diego, San Diego, CA, United States, 3Radiology Service, Veteran Affairs San Diego Healthcare System, San Diego, CA, United States
Synopsis
Keywords: Neurodegeneration, Quantitative Imaging, Myelin
In this study, we developed a comprehensive MR imaging protocol to quantify all the major components of the brain. This protocol includes four different kinds of sequences: a magnetization transfer prepared Cones (MT-Cones) for two-pool MT modeling, a short-TR adiabatic inversion-recovery prepared Cones (STAIR-Cones) for myelin water imaging, a proton-density weighted Cones (PDw-Cones) for total water imaging, and a highly T2 weighted Cones (T2w-Cones) for extracellular water imaging. Using a combination of these techniques, we successfully quantified the proton fractions of brain macromolecules, myelin water, intracellular water, and extracellular water components in three healthy volunteers with a 3T clinical scanner.Introduction
There are four main compartments in the brain, namely macromolecules (e.g., myelin lipid, protein, and axonal membranes), myelin water (trapped in the myelin lipid layers) (MW), intracellular water (IW), and extracellular water (e.g., cerebrospinal-fluid) (EW) (1–6). Volume or content changes of these components may be important in neuroinflammatory and neurodegenerative diseases (1–6). Recently, many MR imaging techniques have been developed to independently image or quantify these specific brain compartments. For example, quantitative two-pool magnetization transfer (MT) modeling techniques have been utilized to evaluate semisolid tissue changes in the brain (1,2). MW imaging techniques have been developed to assess myelin content changes (3,4). T2-FLAIR is a widely used clinical sequence to evaluate neuropathological changes related to IW changes (7). Highly T1rho- and T2-weighted sequences have been developed for selective EW imaging (5,6). In this study, we developed a comprehensive protocol for brain multicompartment imaging using a 3D Cones sequence with a short echo time (i.e., 0.8ms) for data acquisition (8,9). This protocol includes four different sequences: a MT prepared Cones (MT-Cones) for two-pool MT modeling (10), a short-TR adiabatic inversion recovery prepared Cones (STAIR-Cones) for myelin water imaging (11), a proton density-weighted Cones (PDw-Cones) for total water (TW) imaging (11), and a highly T2-weighted Cones (T2w-Cones) for extracellular water imaging (6). By combining these four techniques, we aim to quantify the proton fractions (PFs) of macromolecules, MW, IW, and EW components using a 3T clinical scanner.Methods
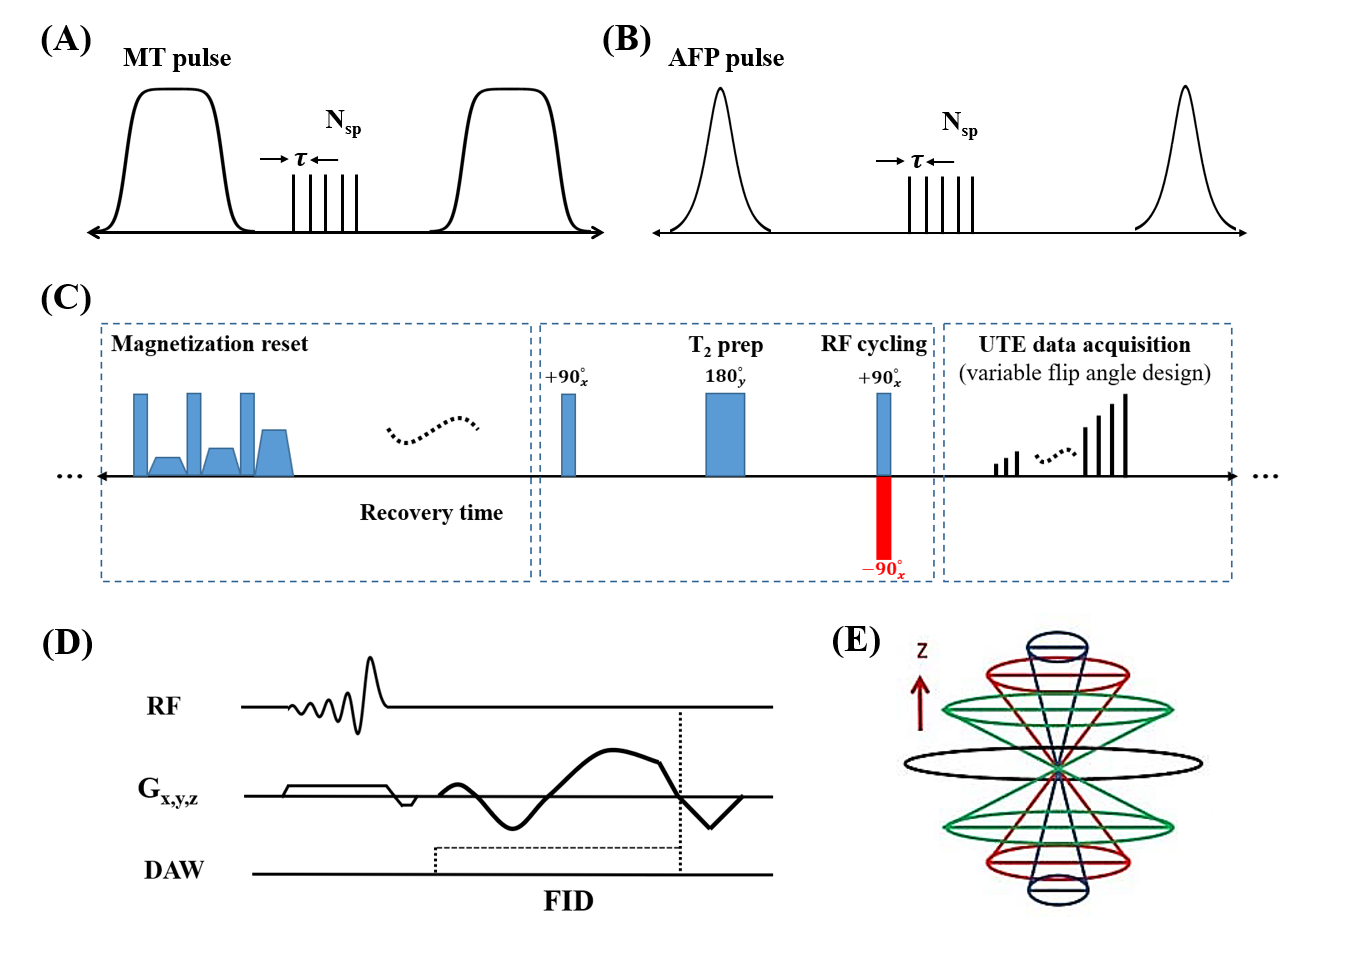
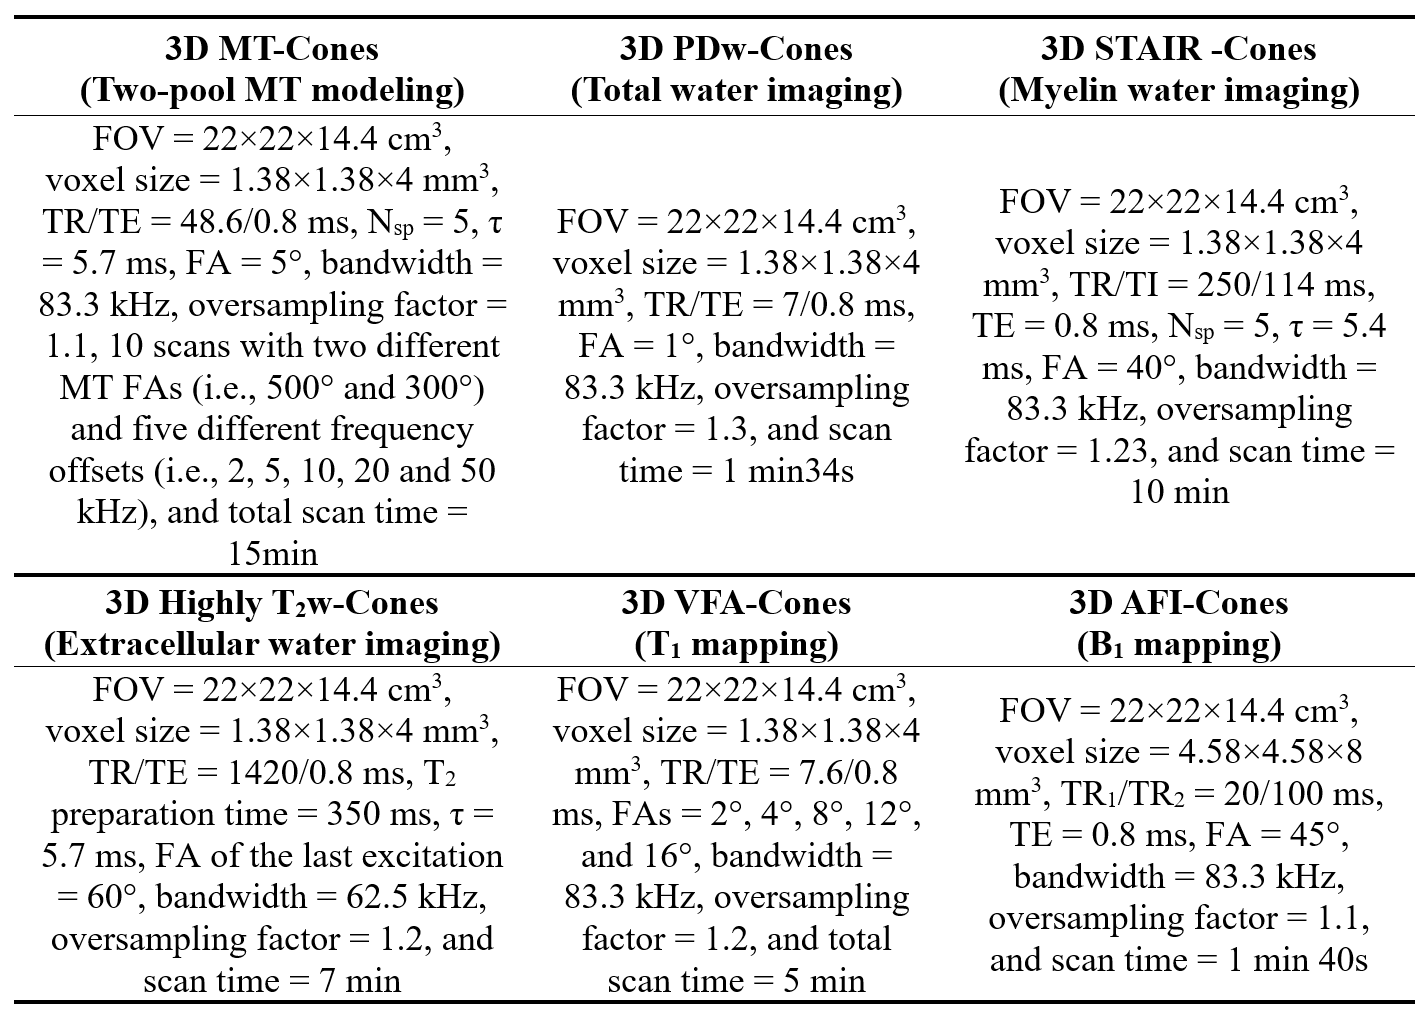
Three healthy male volunteers (aged 28 5-years-old) were recruited and scanned in this study. Informed consent was obtained from each volunteer.Figure 1 shows the sequence diagrams. In the MT-Cones sequence, a Fermi-shaped MT pulse is employed to generate MT contrast (Figure 1A) (10). In the STAIR-Cones sequence, an Adiabatic Full Passage (AFP) pulse is utilized to suppress long-T2 water (i.e., intra/extracellular water) signals (Figure 1B) (11). The TR of the STAIR-Cones sequence is relatively short (i.e., 250 ms) to enable robust long-T2 water signal suppression. A multispoke acquisition strategy is applied to both sequences to reduce scan time. The highly T2w-Cones sequence includes four major features (Figure 1C): (i) a magnetization reset module to generate a constant magnetization recovery, (ii) a T2 preparation module with a long free decay time (e.g., 350 ms), (iii) an RF cycling or phase modulation scheme (i.e., the RF phase of the second 90º pulse alternates by 180º in adjacent TRs), and (iv) a Variable Flip Angle (VFA) technique to reduce signal variation along the multiple data acquisition spokes and improve the Signal-to-Noise Ratio performance. In each acquisition spoke (Figure 1D), a slab-selective RF pulse is utilized for signal excitation followed by center-out spiral encoding. This spiral encoding forms a 3D Cones trajectory to cover the whole k-space efficiently (Figure 1E). The PDw-Cones uses the sequence shown in Figure 1D. A relatively low flip angle (e.g., 1º) is used with this sequence to mitigate the T1 contrast (11). In addition, brain T1 values are measured using a VFA-Cones technique with B1 correction (12). The B1 maps are measured by an actual flip angle Cones (AFI-Cones) sequence (12,13). The detailed sequence parameters in this study are listed in Table 1.
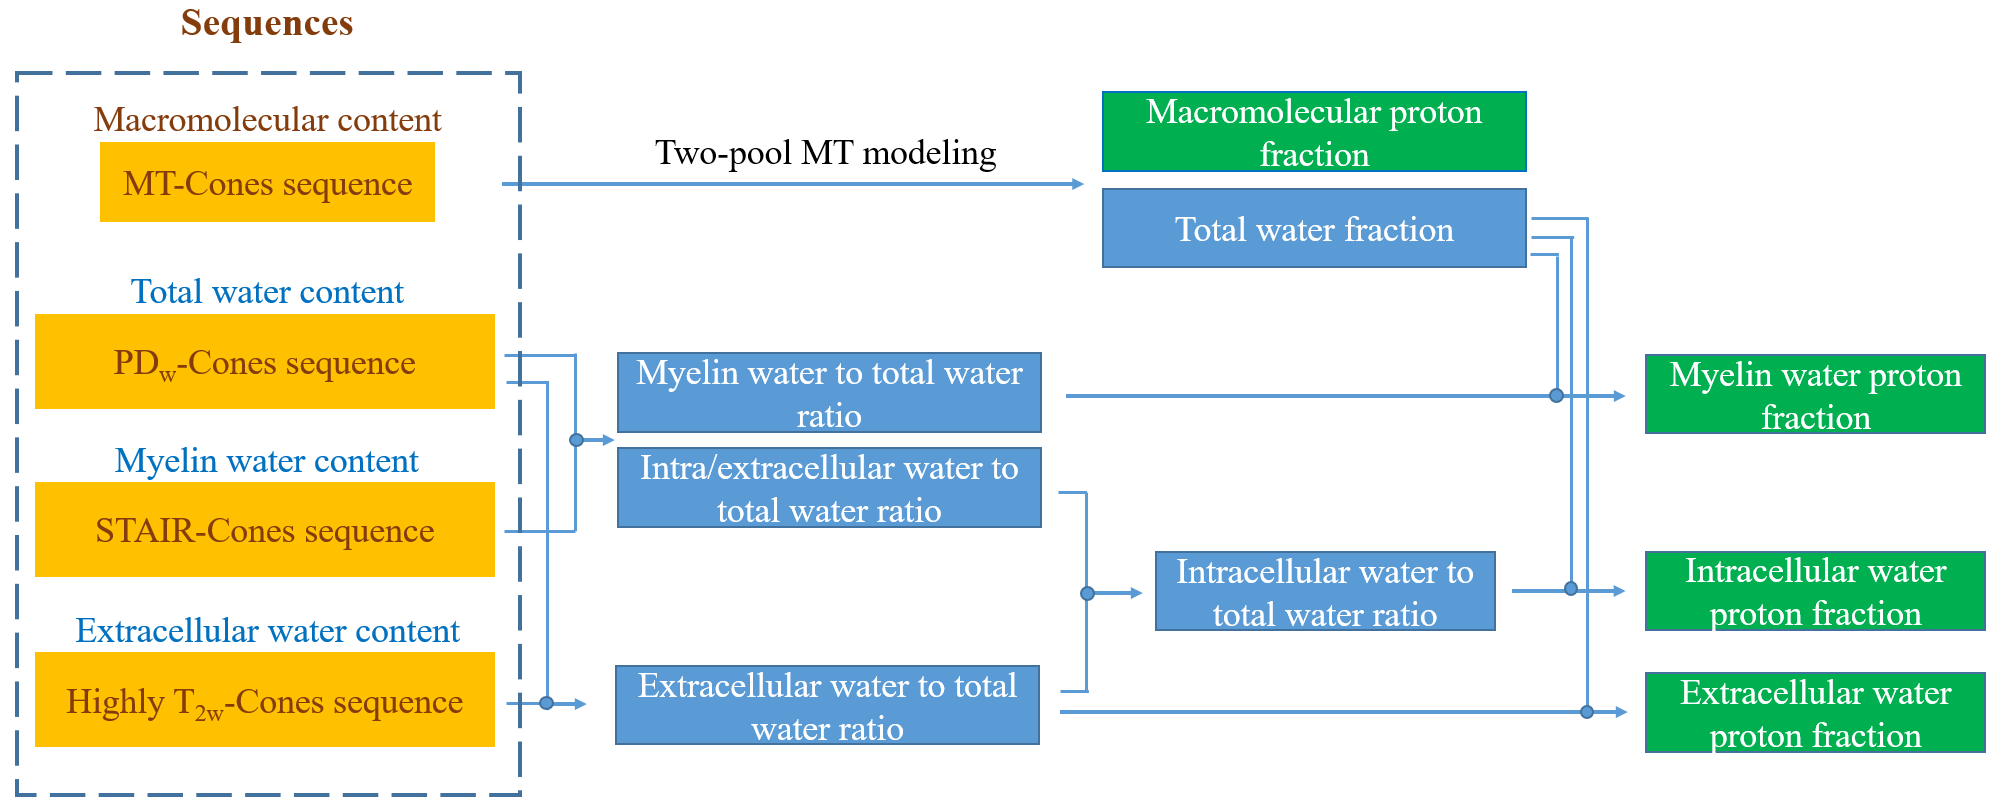
Figure 2 shows the workflow to quantify brain PFs of macromolecules, MW, IW, and EW using the proposed protocol. Macromolecular proton fraction (MMPF) and TW fraction are first estimated by two-pool MT modeling. The ratios of MW, IW, and EW to TW are calculated from STAIR-Cones, PDw-Cones, and T2w-Cones images. With known TW fraction estimated by the MT modeling, the MW PF (MWPF), IW PF (IWPF), and EW PF (EWPF) are easily obtained.
Results and Discussion
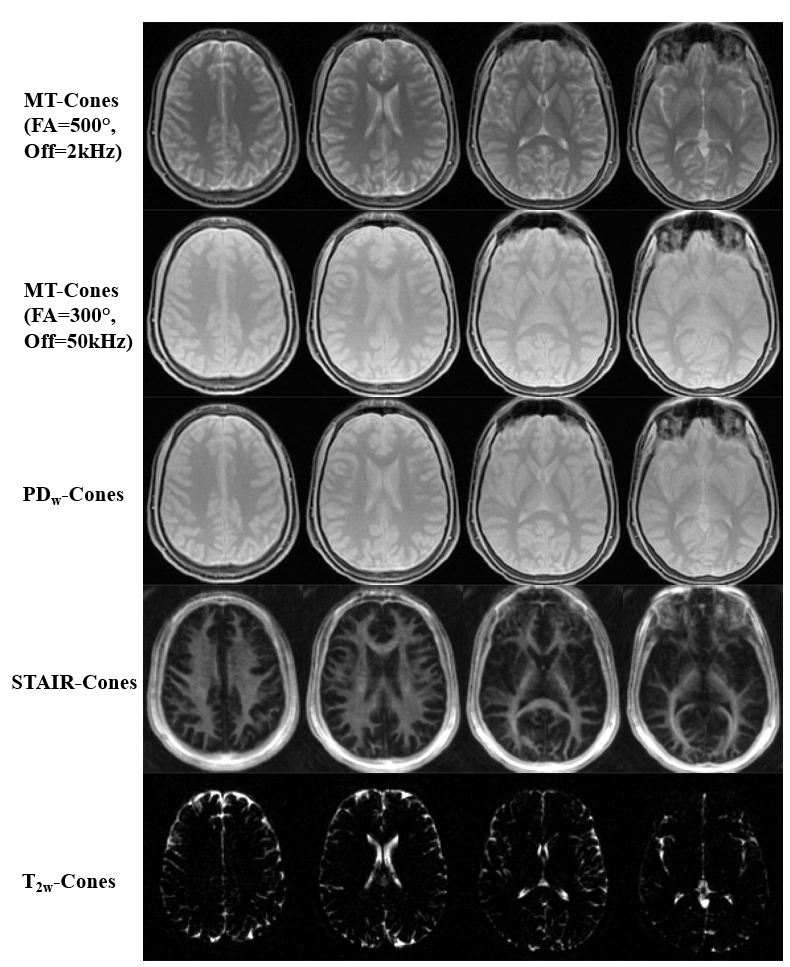
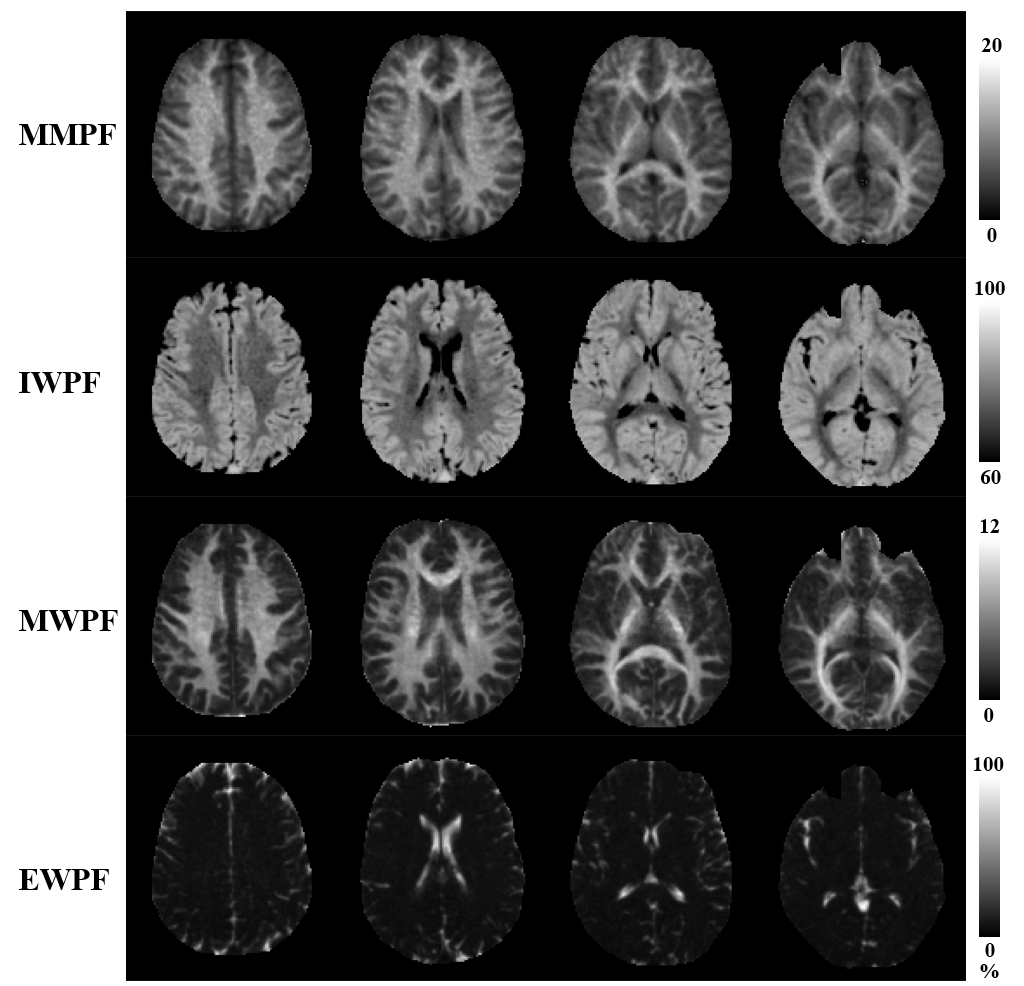
Figure 3 shows the representative images acquired with MT-Cones, PDw-Cones, STAIR-Cones and T2w-Cones sequences in a 22-year-old volunteer. Images with a higher MT FA and a smaller frequency offset show a stronger MT effect. As seen in the STAIR-Cones images, the white matter region has a much higher myelin water content than the gray matter region. Extracellular water is selectively imaged with the highly T2w-Cones sequence, when signals of all the other water compartments are completely decayed.Figure 4 shows the brain multicompartment mapping results, including MMPF, MWPF, IWPF, and EWPF maps. The MMPF, MWPF, and IWPF in white matter range from 10 to 18%, 5 to 12%, and 65 to 75%, respectively. The MMPF, MWPF, and IWPF in gray matter range from 4 to 7%, 1.5 to 3%, and 81 to 88%, respectively. The EWPF ranges from 0 to 100%. As can be seen in these maps, the white matter shows much higher values of MMPF and MWPF than the gray matter. The gray matter has a higher IWPF than the white matter. Extracellular water mainly exists in non-white and gray matter regions, such as the ventricles and subarachnoid space.
Conclusion
The brain multicompartment imaging protocol can quantify the PFs of the major tissue components including macromolecules, myelin water, intracellular water, and extracellular water components in the brain, and has considerable potential in clinical practice for assessment of neuroinflammatory and neurodegenerative diseases.Acknowledgements
The authors acknowledge grant support from the National Institutes of Health (R01AR062581, R01AR068987, R01AR075825, R01AR079484, and RF1AG075717 and R21AR075851), VA Clinical Science and Rehabilitation Research and Development Services (Merit Awards I01CX001388, I01CX002211, and I01RX002604), and GE Healthcare.References
1. Sled JG, Pike GB. Quantitative imaging of magnetization transfer exchange and relaxation properties in vivo using MRI. Magn Reson Med 2001;46:923–31.
2. Tozer D, Ramani A, Barker GJ, Davies GR, Miller DH, Tofts PS. Quantitative magnetization transfer mapping of bound protons in multiple sclerosis. Magn Reson Med 2003;50:83–91.
3. Alonso-Ortiz E, Levesque IR, Pike GB. MRI-based myelin water imaging: A technical review. Magn. Reson. Med. 2015;73:70–81.
4. MacKay AL, Laule C. Magnetic resonance of myelin water: an in vivo marker for myelin. Brain Plast. 2016;2:71–91.
5. Jin T, Kim S-G. Change of the cerebrospinal fluid volume during brain activation investigated by T(1rho)-weighted fMRI. NeuroImage 2010;51:1378–1383 doi: 10.1016/j.neuroimage.2010.03.047.
6. Qin Q. A simple approach for three-dimensional mapping of baseline cerebrospinal fluid volume fraction. Magn. Reson. Med. 2011;65:385–391.
7. White SJ, Hajnal JV, Young IR, Bydder GM. Use of Fluid-Attenuated Inversion-Recovery Pulse Sequences for Imaging the Spinal Cord. Magn. Reson. Med. 1992;28:153–162 doi: 10.1002/mrm.1910280116.
8. Gurney PT, Hargreaves BA, Nishimura DG. Design and analysis of a practical 3D cones trajectory. Magn Reson Med 2006;55:575–82 doi: 10.1002/mrm.20796.
9. Carl M, Bydder GM, Du J. UTE imaging with simultaneous water and fat signal suppression using a time-efficient multispoke inversion recovery pulse sequence. Magn. Reson. Med. 2016;76:577–582 doi: 10.1002/mrm.25823.
10. Ma Y-J, Chang EY, Carl M, Du J. Quantitative magnetization transfer ultrashort echo time imaging using a time-efficient 3D multispoke Cones sequence. Magn. Reson. Med. 2018;79:692–700.
11. Ma Y-J, Jang H, Lombardi AF, Corey-Bloom J, Bydder GM. Myelin water imaging using a short-TR adiabatic inversion-recovery (STAIR) sequence. Magn. Reson. Med. 2022;88:1156-1169.
12. Ma Y, Zhao W, Wan L, et al. Whole knee joint T1 values measured in vivo at 3T by combined 3D ultrashort echo time cones actual flip angle and variable flip angle methods. Magn Reson Med 2019;81:1634–1644.
13. Ma Y, Lu X, Carl M, et al. Accurate T1 mapping of short T2 tissues using a three-dimensional ultrashort echo time cones actual flip angle – variable TR (3D UTE-Cones AFI-VTR) method. Magn Reson Med 2018;80:598–608.
Figures