0588
S-EBM: generalising event-based modelling of disease progression for simultaneous events1Centre for Medical Image Computing, Department of Computer Science, UCL, London, UK, London, United Kingdom
Synopsis
Keywords: Neurodegeneration, Modelling, Disease progression
S-EBM generalises the event-based model (EBM) of disease progression for simultaneous events. In synthetic data, S-EBM can tell the difference between simultaneous and non-simultaneous events under a range of experimental conditions. In comparison to conventional EBM, S-EBM avoids artificial serial orderings, permitting more accurate and parsimonious descriptions of disease progression. When applied to real Alzheimer’s disease biomarker data, S-EBM estimates a sequence containing neurologically plausible simultaneous events which more closely explain the data than conventional EBM. S-EBM may be applied to recover novel patterns of disease progression thereby informing our understanding of disease evolution.
Introduction
Reconstructing sequences of biomarker abnormalities in disease facilitates earlier diagnosis and disease stage-based prognosis, treatment, and stratification for trials. Ideally, biomarker progression is derived from longitudinal data across the disease course, but often only cross-sectional data is available. Event-based modelling of disease progression (EBM)1 aims to reconstruct the ordering of biomarker abnormality events, from cross-sectional biomarker data, and has been previously applied to sequence various neurological diseases, including Alzheimer’s disease (AD)1,2. However, the conventional EBM1 (C-EBM) and subsequent approaches3 do not explicitly model the possibility that multiple biomarkers can become abnormal at the same time. Effectively-simultaneous events may occur due to the presence of shared causal factors or unresolvably small latency differences. This can lead to an artificial serial ordering for events that are simultaneous. To address this, we introduce S-EBM, a generalisation of the conventional EBM that enables estimation of simultaneous events.Methods
TheoryAn overview of EBM is shown in Fig. 1. To model simultaneous events, the sequence representation in C-EBM1 is updated from an ordered list of numbers to an ordered list of sets of numbers. The likelihood function is updated for the new sequence representation while retaining the same assumptions as C-EBM: (i) monotonicity of biomarker progression; (ii) uniform prior probability of each disease stage and each sequence and (iii) independence of biomarker measures. The S-EBM sequence with maximum a posteriori probability (MAP) is found by greedy ascent, as with C-EBM, except that the perturbation method is updated to allow the list of sets to vary arbitrarily.
Evaluation
Firstly, simulations were generated to evaluate if C-EBM uncertainty can infer event simultaneity, or if uncertainty is also influenced by measurement noise. Synthetic biomarker data was generated for sequences of two biomarkers where events occur either serially or simultaneously, and with varying measurement noise. The C-EBM positional uncertainty2 was quantified for both sequence types as a function of measurement noise. The percentage of sequences containing a substantial degree of uncertainty over the set of 1000 simulations was then calculated.
Next, data was simulated to test the accuracy of S-EBM against ground truth sequences. Data was simulated for sequences including various proportions of simultaneous events (none, one, or fully simultaneous), and the experimental conditions varied - number of biomarkers (2, 4, 10), number of subjects per stage (8, 10, 20) and biomarker standard deviation (0.1, 0.2, 0.3, 0.4, 0.5). For each combination of settings, accuracy was quantified over 100 simulations as the proportion of correctly estimated sequences. For both experiments, the disease signal was fixed at 1 for all biomarkers and the measurement noise was the same for the normal and abnormal event states.
Application
We assessed the S-EBM sequence against earlier work that applied C-EBM to AD2. Biomarker data for cerebrospinal fluid (CSF) markers, cognitive test scores and regional brain volumes were obtained from the Alzheimer’s disease Neuroimaging Initiative (ADNI) TADPOLE dataset4 (adni.loni.usc.edu) for 335 subjects (54 cognitively normal, 218 with mild cognitive impairment and 83 with probable AD-dementia). Brain volumes were normalised by intra-cranial volume to control for head size and total and phosphorylated tau were log-transformed to improve Gaussianity. The probability density functions of the normal and abnormal components for each biomarker were estimated using Gaussian mixture modelling. The MAP sequence was estimated for C-EBM using greedy ascent with 20 initialisations of 2000 perturbations; and for S-EBM using MCMC (1x10⁶ samples) initialised following a greedy ascent with 20 initialisations of 2000 perturbations.
Results and Discussion
Fig. 2 shows that uncertainty in C-EBM sequences can arise due to simultaneous events, high measurement noise, or both. Therefore, C-EBM uncertainty cannot be used to infer the presence of simultaneous events.S-EBM had high accuracy for a variety of ground truth sequences; those containing serial events, simultaneous events, or a mixture of both; and under different experimental conditions (Fig. 3). Accuracy was higher with more subjects/samples per stage, lower measurement noise, and in sequences containing fewer biomarkers. These findings suggest that with sufficiently high disease signal to noise ratio and sampling of the disease timeline, S-EBM can be used to accurately estimate a range of sequence types, including those not possible with C-EBM.
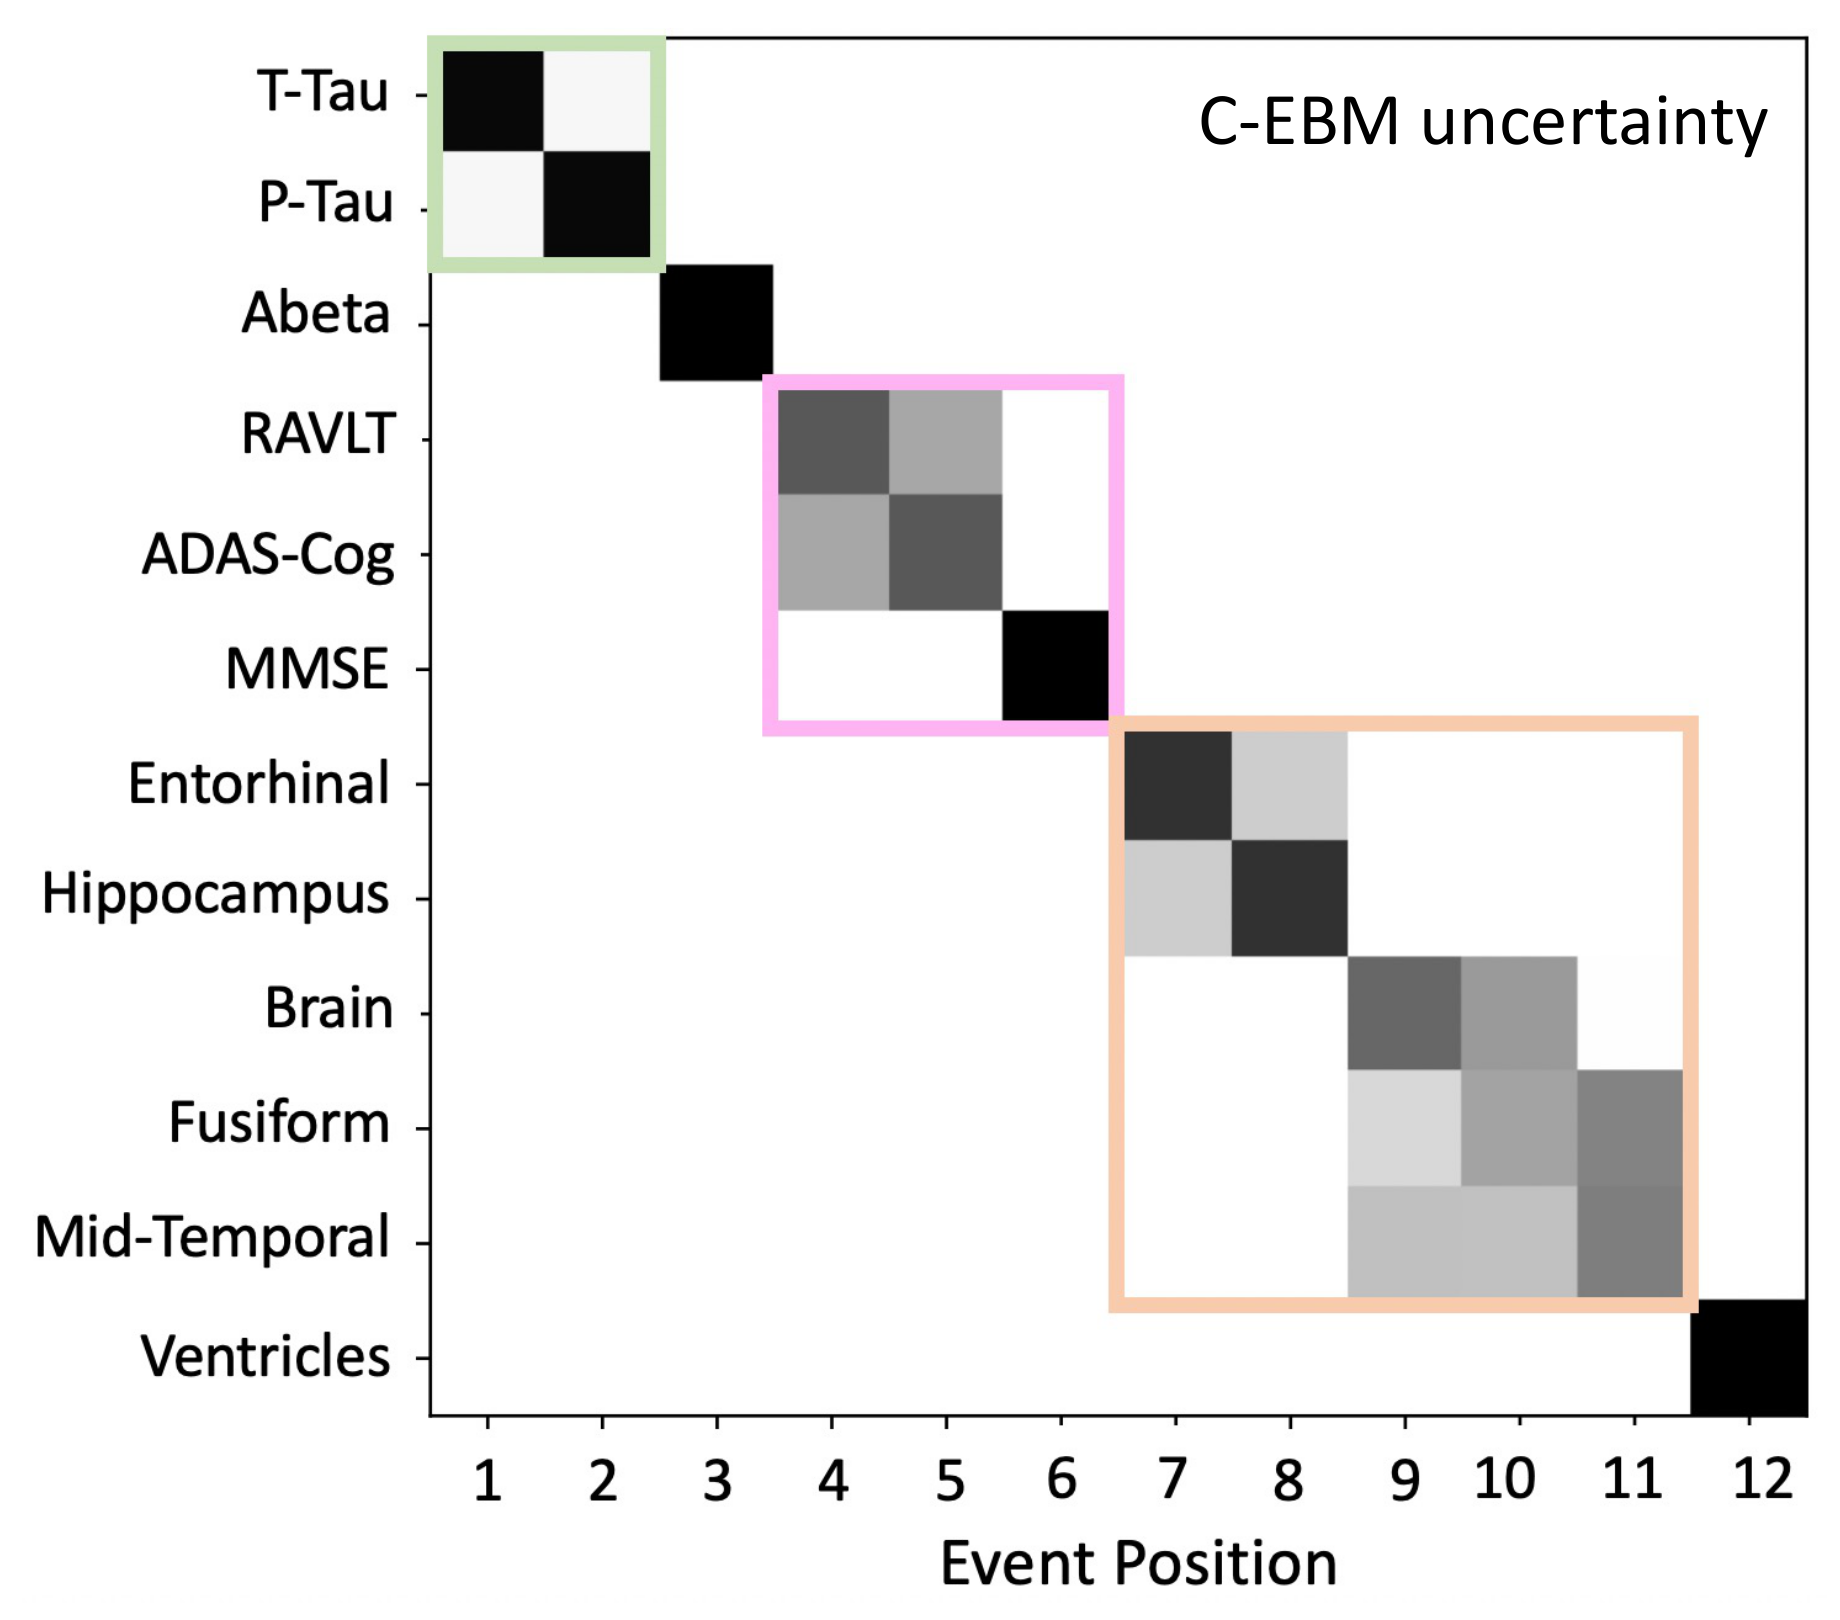
When applied to sequence AD biomarker data, S-EBM estimated a sequence containing simultaneous events which had substantially higher probability than the sequence estimated by C-EBM (Fig. 4). S-EBM identified a neurologically plausible sequence where biomarkers within modality (CSF, cognitive test score, brain volume) become abnormal at the same time. As expected, the patterns of C-EBM positional uncertainty within these groups did not reflect their apparent simultaneity (Fig. 5).
Conclusion
This work presents and validates S-EBM, a new EBM designed to disambiguate event simultaneity from noise in the pathophysiological cascade of neurodegenerative disease. By not artificially enforcing a serial ordering of events, S-EBM allows estimation of more parsimonious disease progression patterns. As demonstrated in AD, S-EBM enables identification of new sequences of biomarker abnormality in progressive diseases, which may allow more accurate stage-based predictions and improve understanding of disease mechanisms.Acknowledgements
NPO is a UKRI Future Leaders Fellow (MR/S03546X/1) who also acknowledges funding from the Early Detection of Alzheimer's Disease Subtypes project (E-DADS; EU JPND, MR/T046422/1), and the National Institute for Health Research University College London Hospitals Biomedical Research Centre.References
[1] Fonteijn, H.M., Modat, M., Clarkson, M.J., Barnes, J., Lehmann, M., Hobbs, N.Z., Scahill, R.I., Tabrizi, S.J., Ourselin, S., Fox, N.C. and Alexander, D.C., 2012. An event-based model for disease progression and its application in familial Alzheimer's disease and Huntington's disease. NeuroImage, 60(3), 1880-1889.
[2] Young, A.L., Oxtoby, N.P., Daga, P., Cash, D.M., Fox, N.C., Ourselin, S., Schott, J.M. and Alexander, D.C., 2014. A data-driven model of biomarker changes in sporadic Alzheimer's disease. Brain, 137(9), 2564-2577.
[3] Young, A.L., Marinescu, R.V., Oxtoby, N.P., Bocchetta, M., Yong, K., Firth, N.C., Cash, D.M., Thomas, D.L., Dick, K.M., Cardoso, J. and van Swieten, J., 2018. Uncovering the heterogeneity and temporal complexity of neurodegenerative diseases with Subtype and Stage Inference. Nature communications, 9(1), pp.1-16.
[4] Marinescu, R.V., Oxtoby, N.P., Young, A.L., Bron, E.E., Toga, A.W., Weiner, M.W., Barkhof, F., Fox, N.C., Eshaghi, A., Toni, T. and Salaterski, M., 2020. The alzheimer's disease prediction of longitudinal evolution (TADPOLE) challenge: Results after 1 year follow-up. arXiv preprint arXiv:2002.03419. (Machine Learning for Biomedical Imaging)
Figures
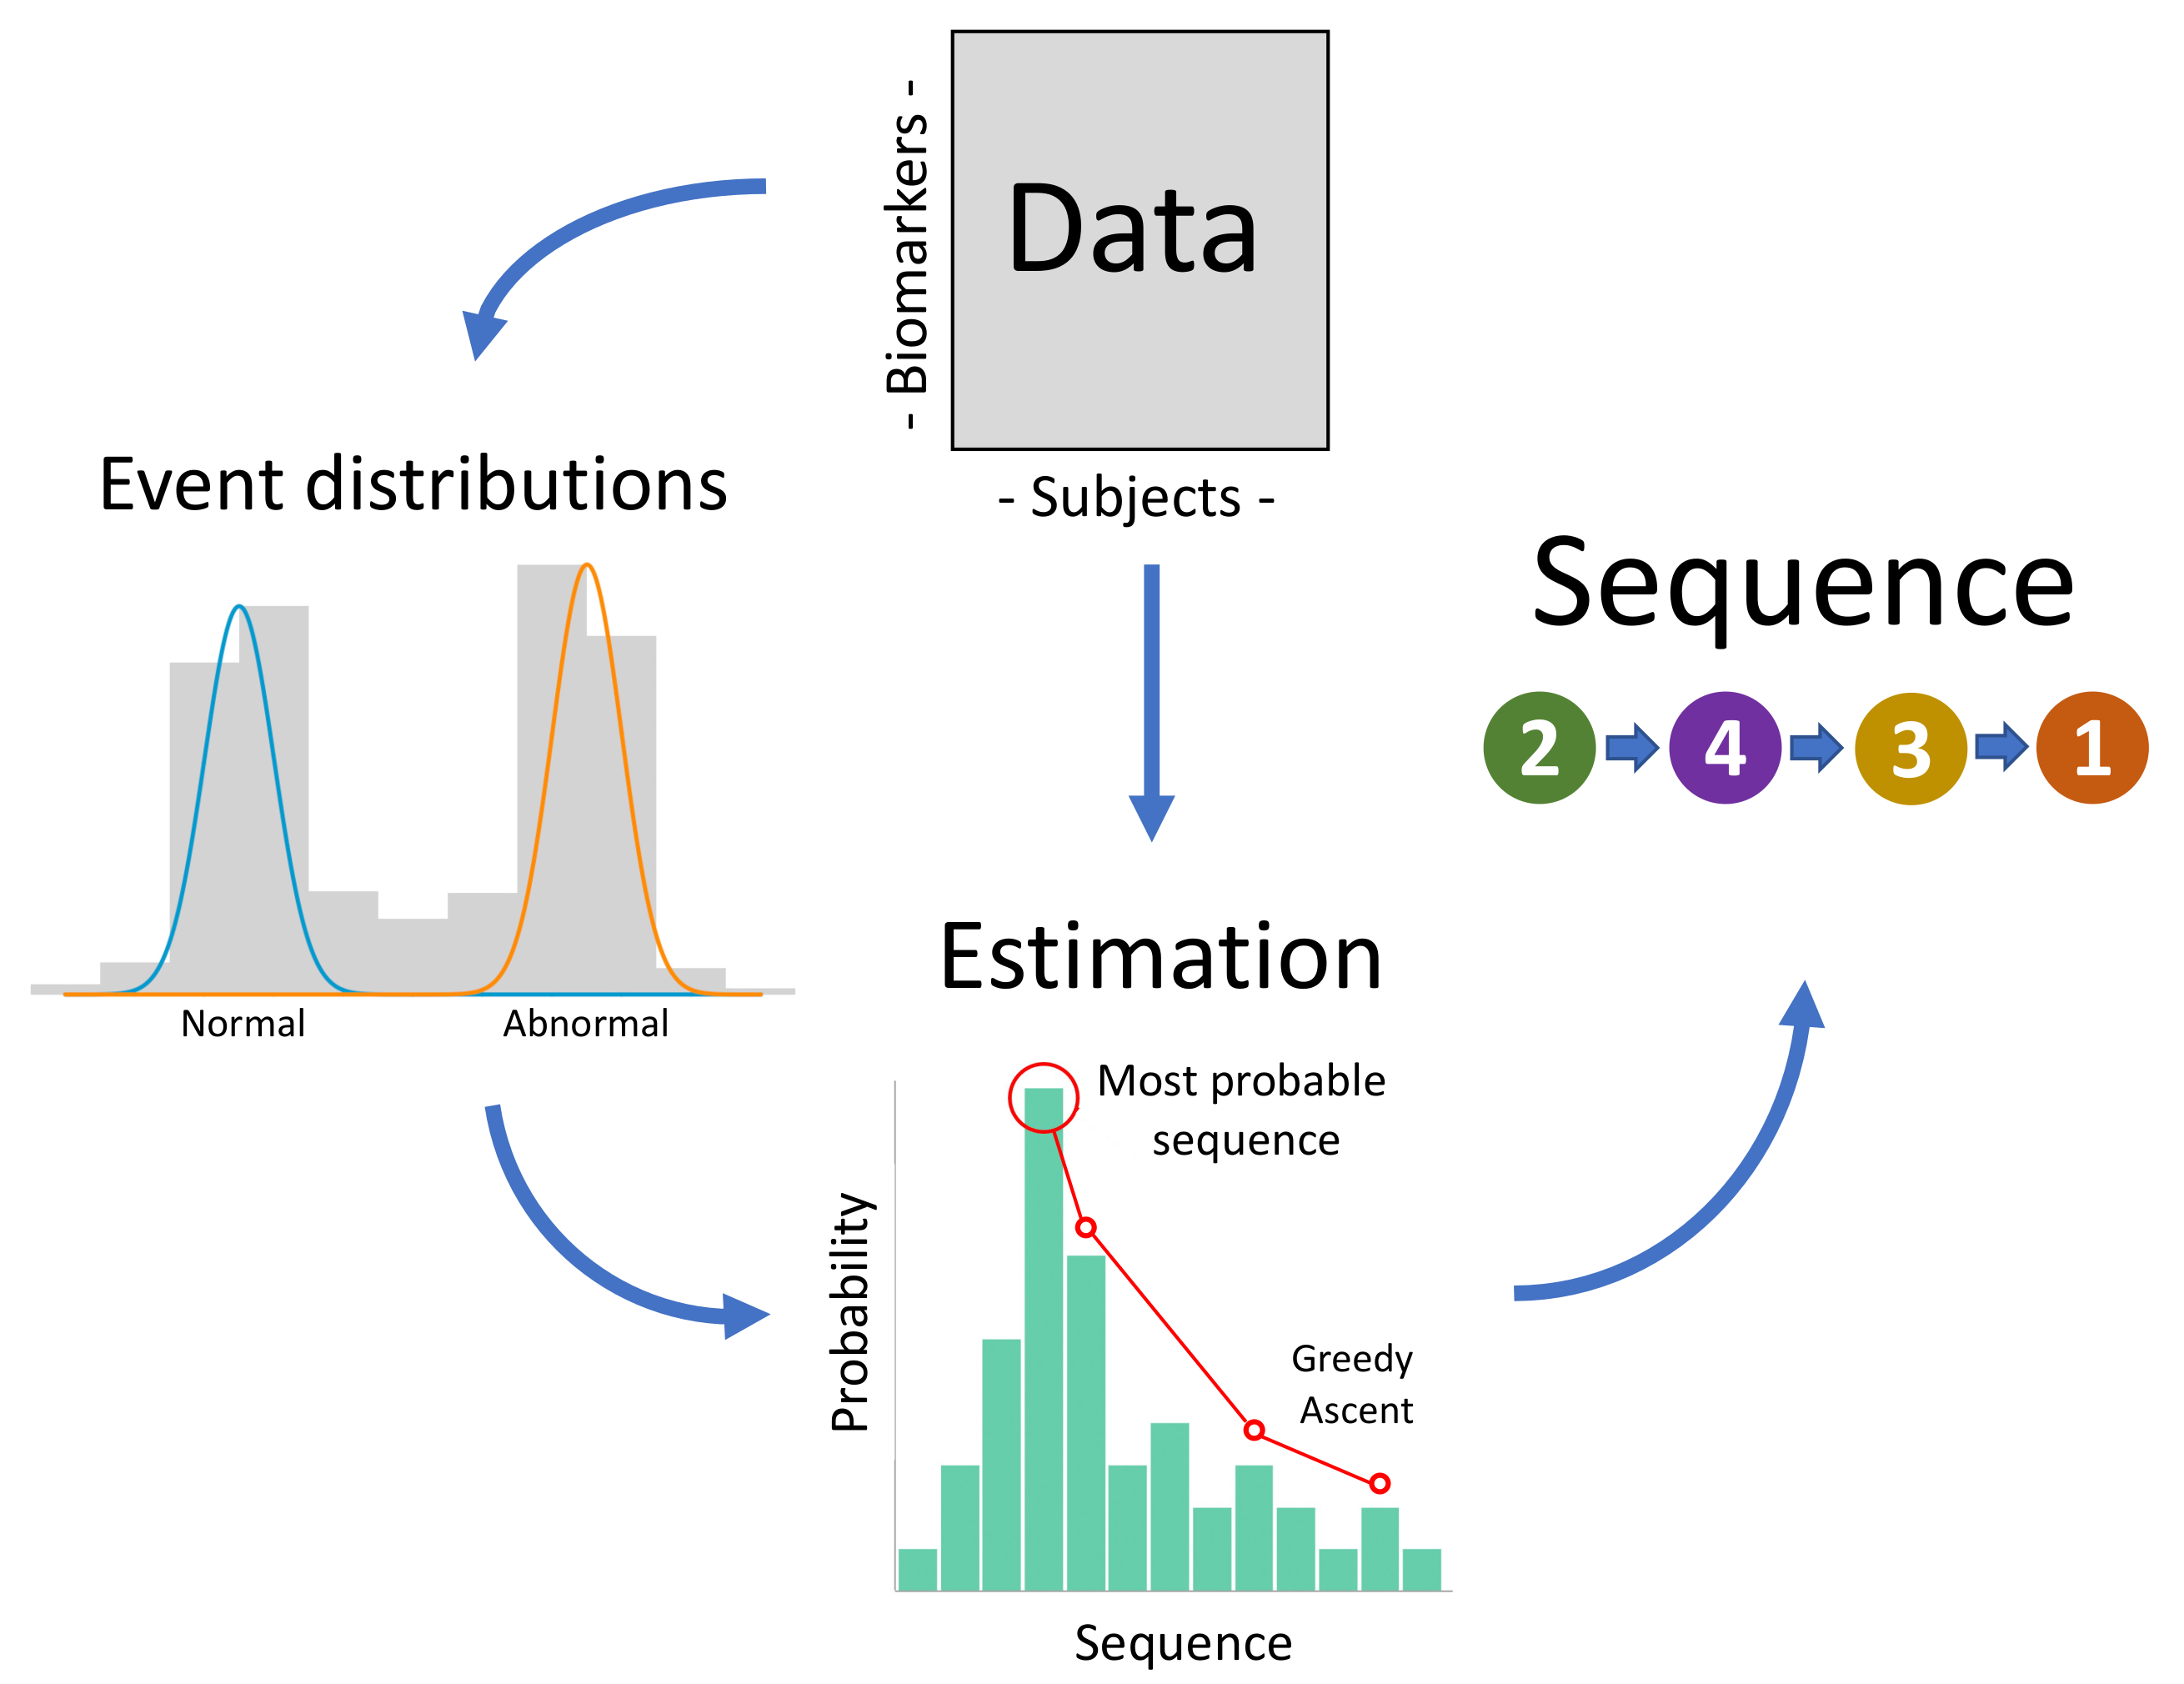
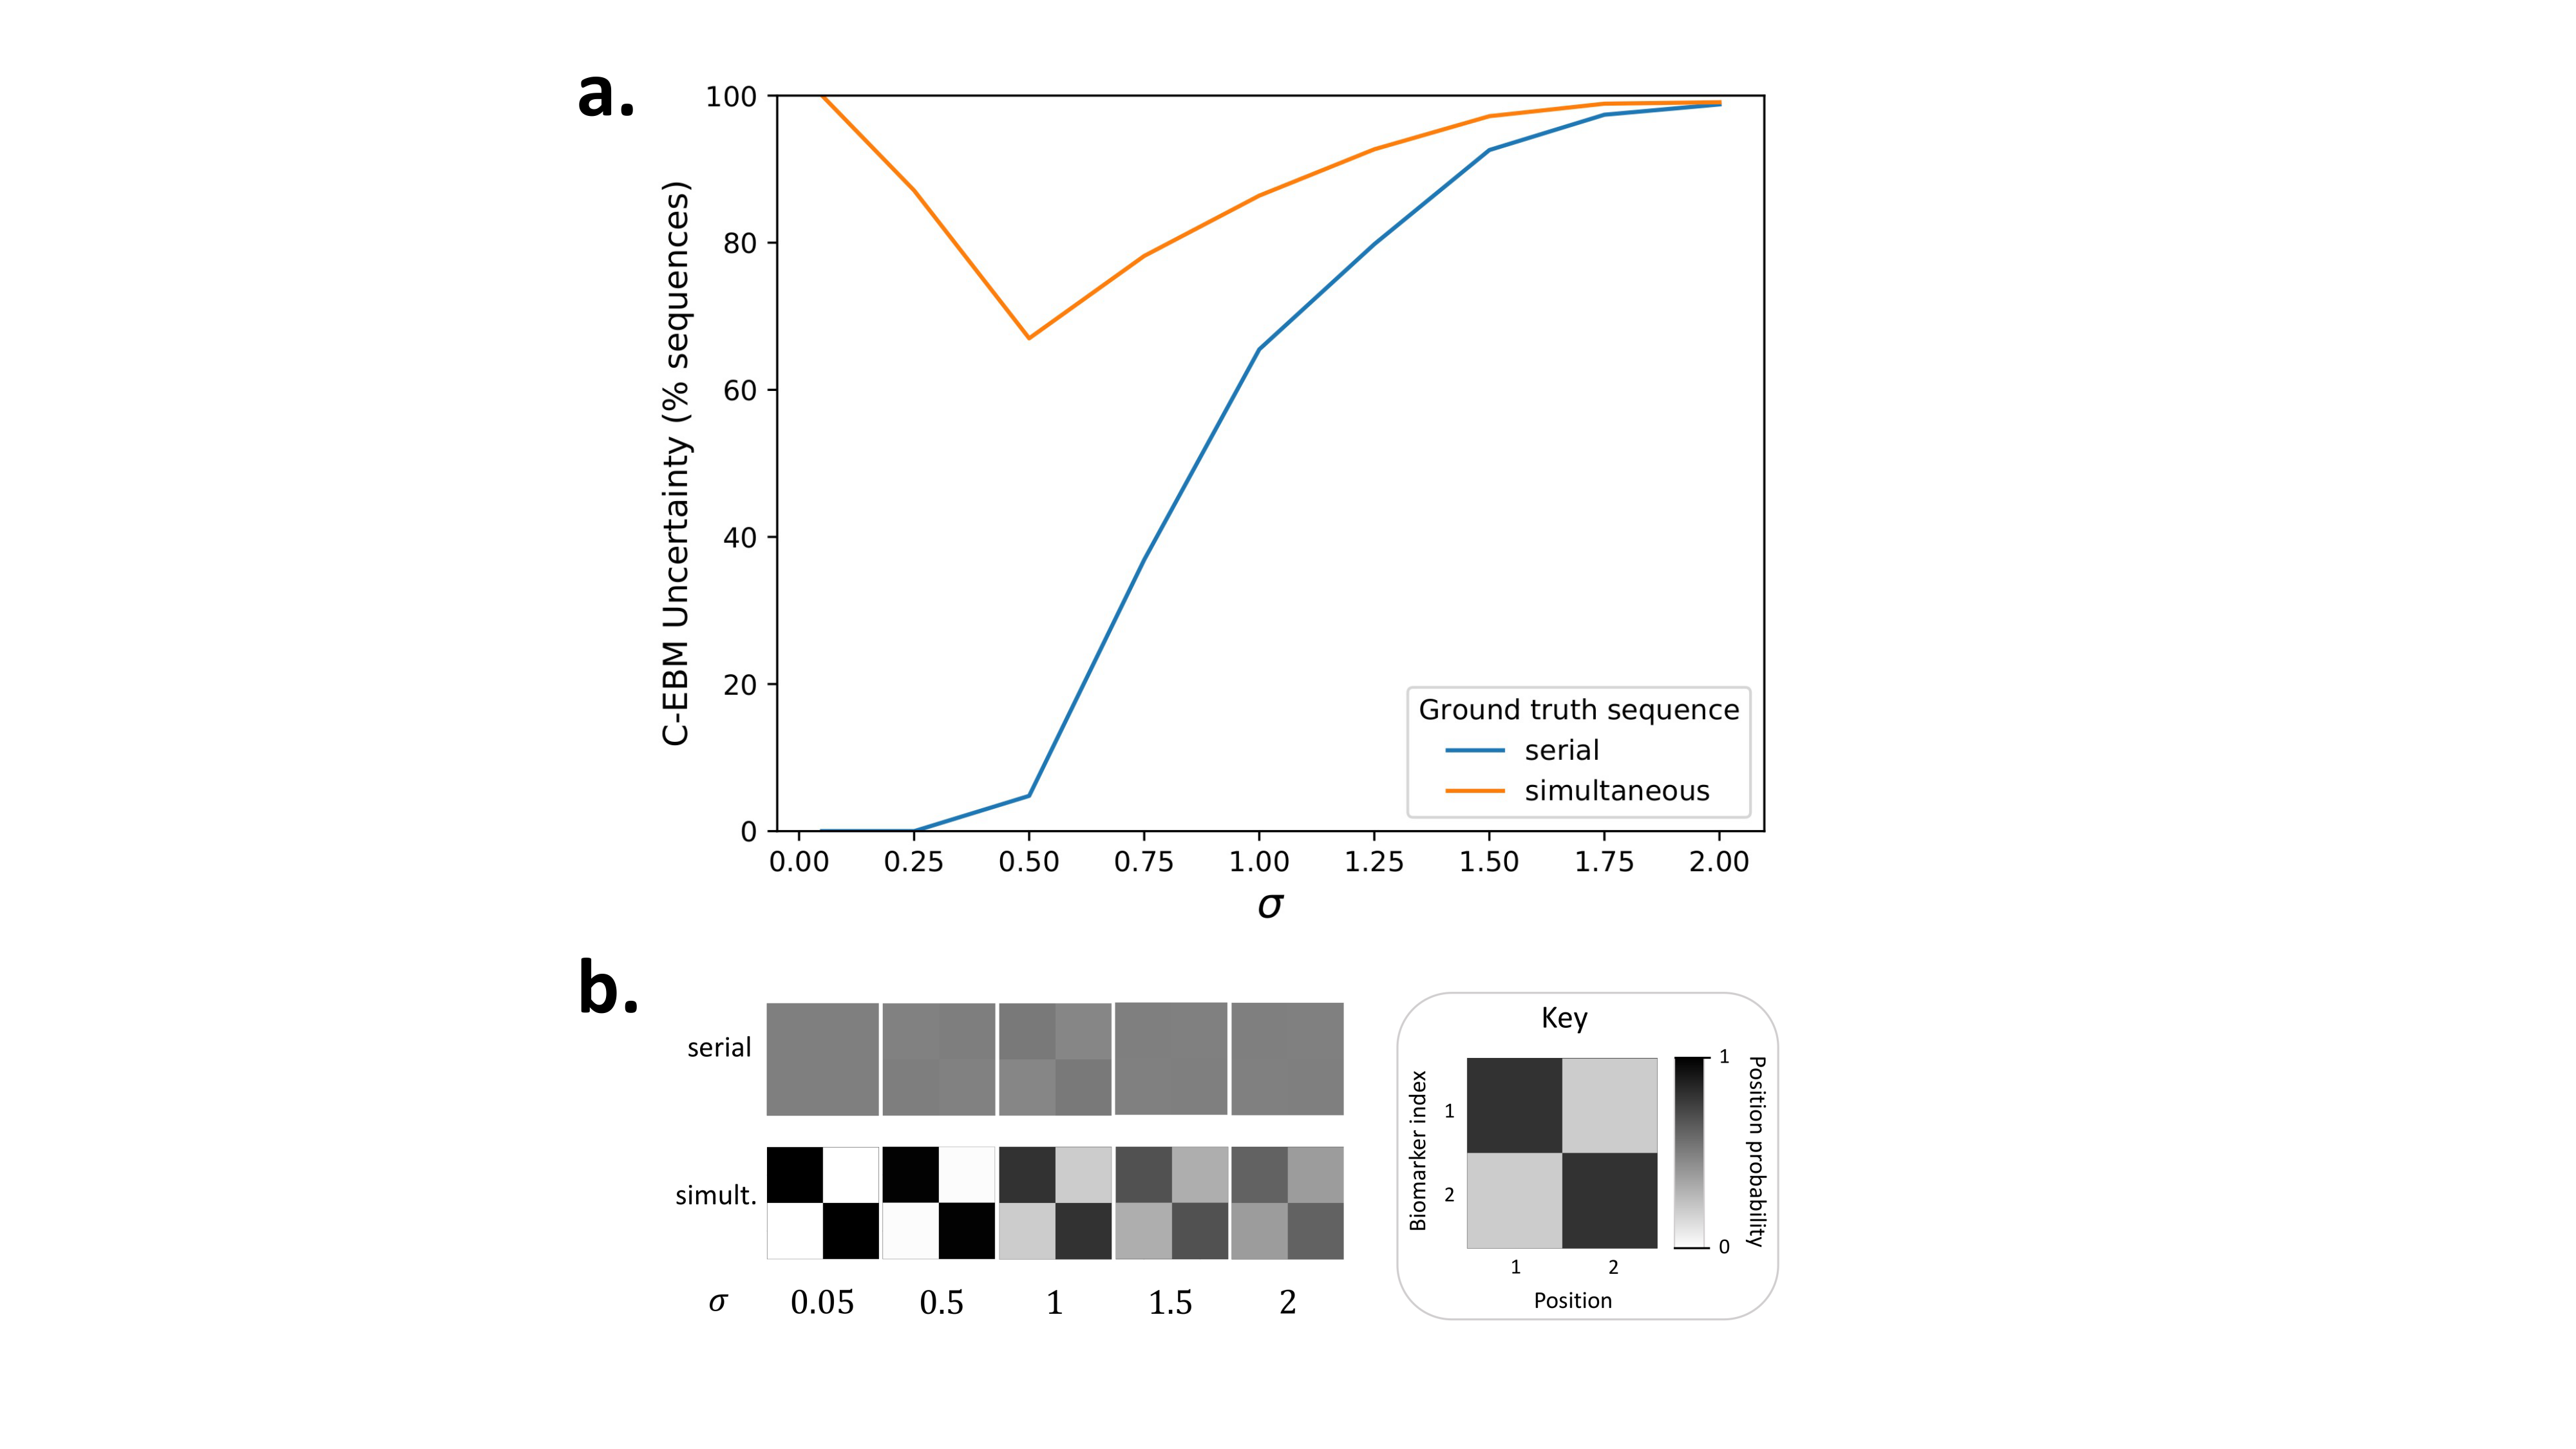
Figure 2. The dependence of C-EBM uncertainty on measurement noise and simultaneous events. a. Percent of C-EBM sequences (over simulations) with significant positional uncertainty (y-axis), plotted as a function of measurement noise (biomarker s.d., x-axis), for sequences of N=2 serial events (blue line) and sequences of simultaneous events (orange line). b. Mean C-EBM positional variance diagrams over simulations at each standard deviation for simultaneous sequences (upper) and serial sequences (lower). Matrices display positional probability, as shown in the key.
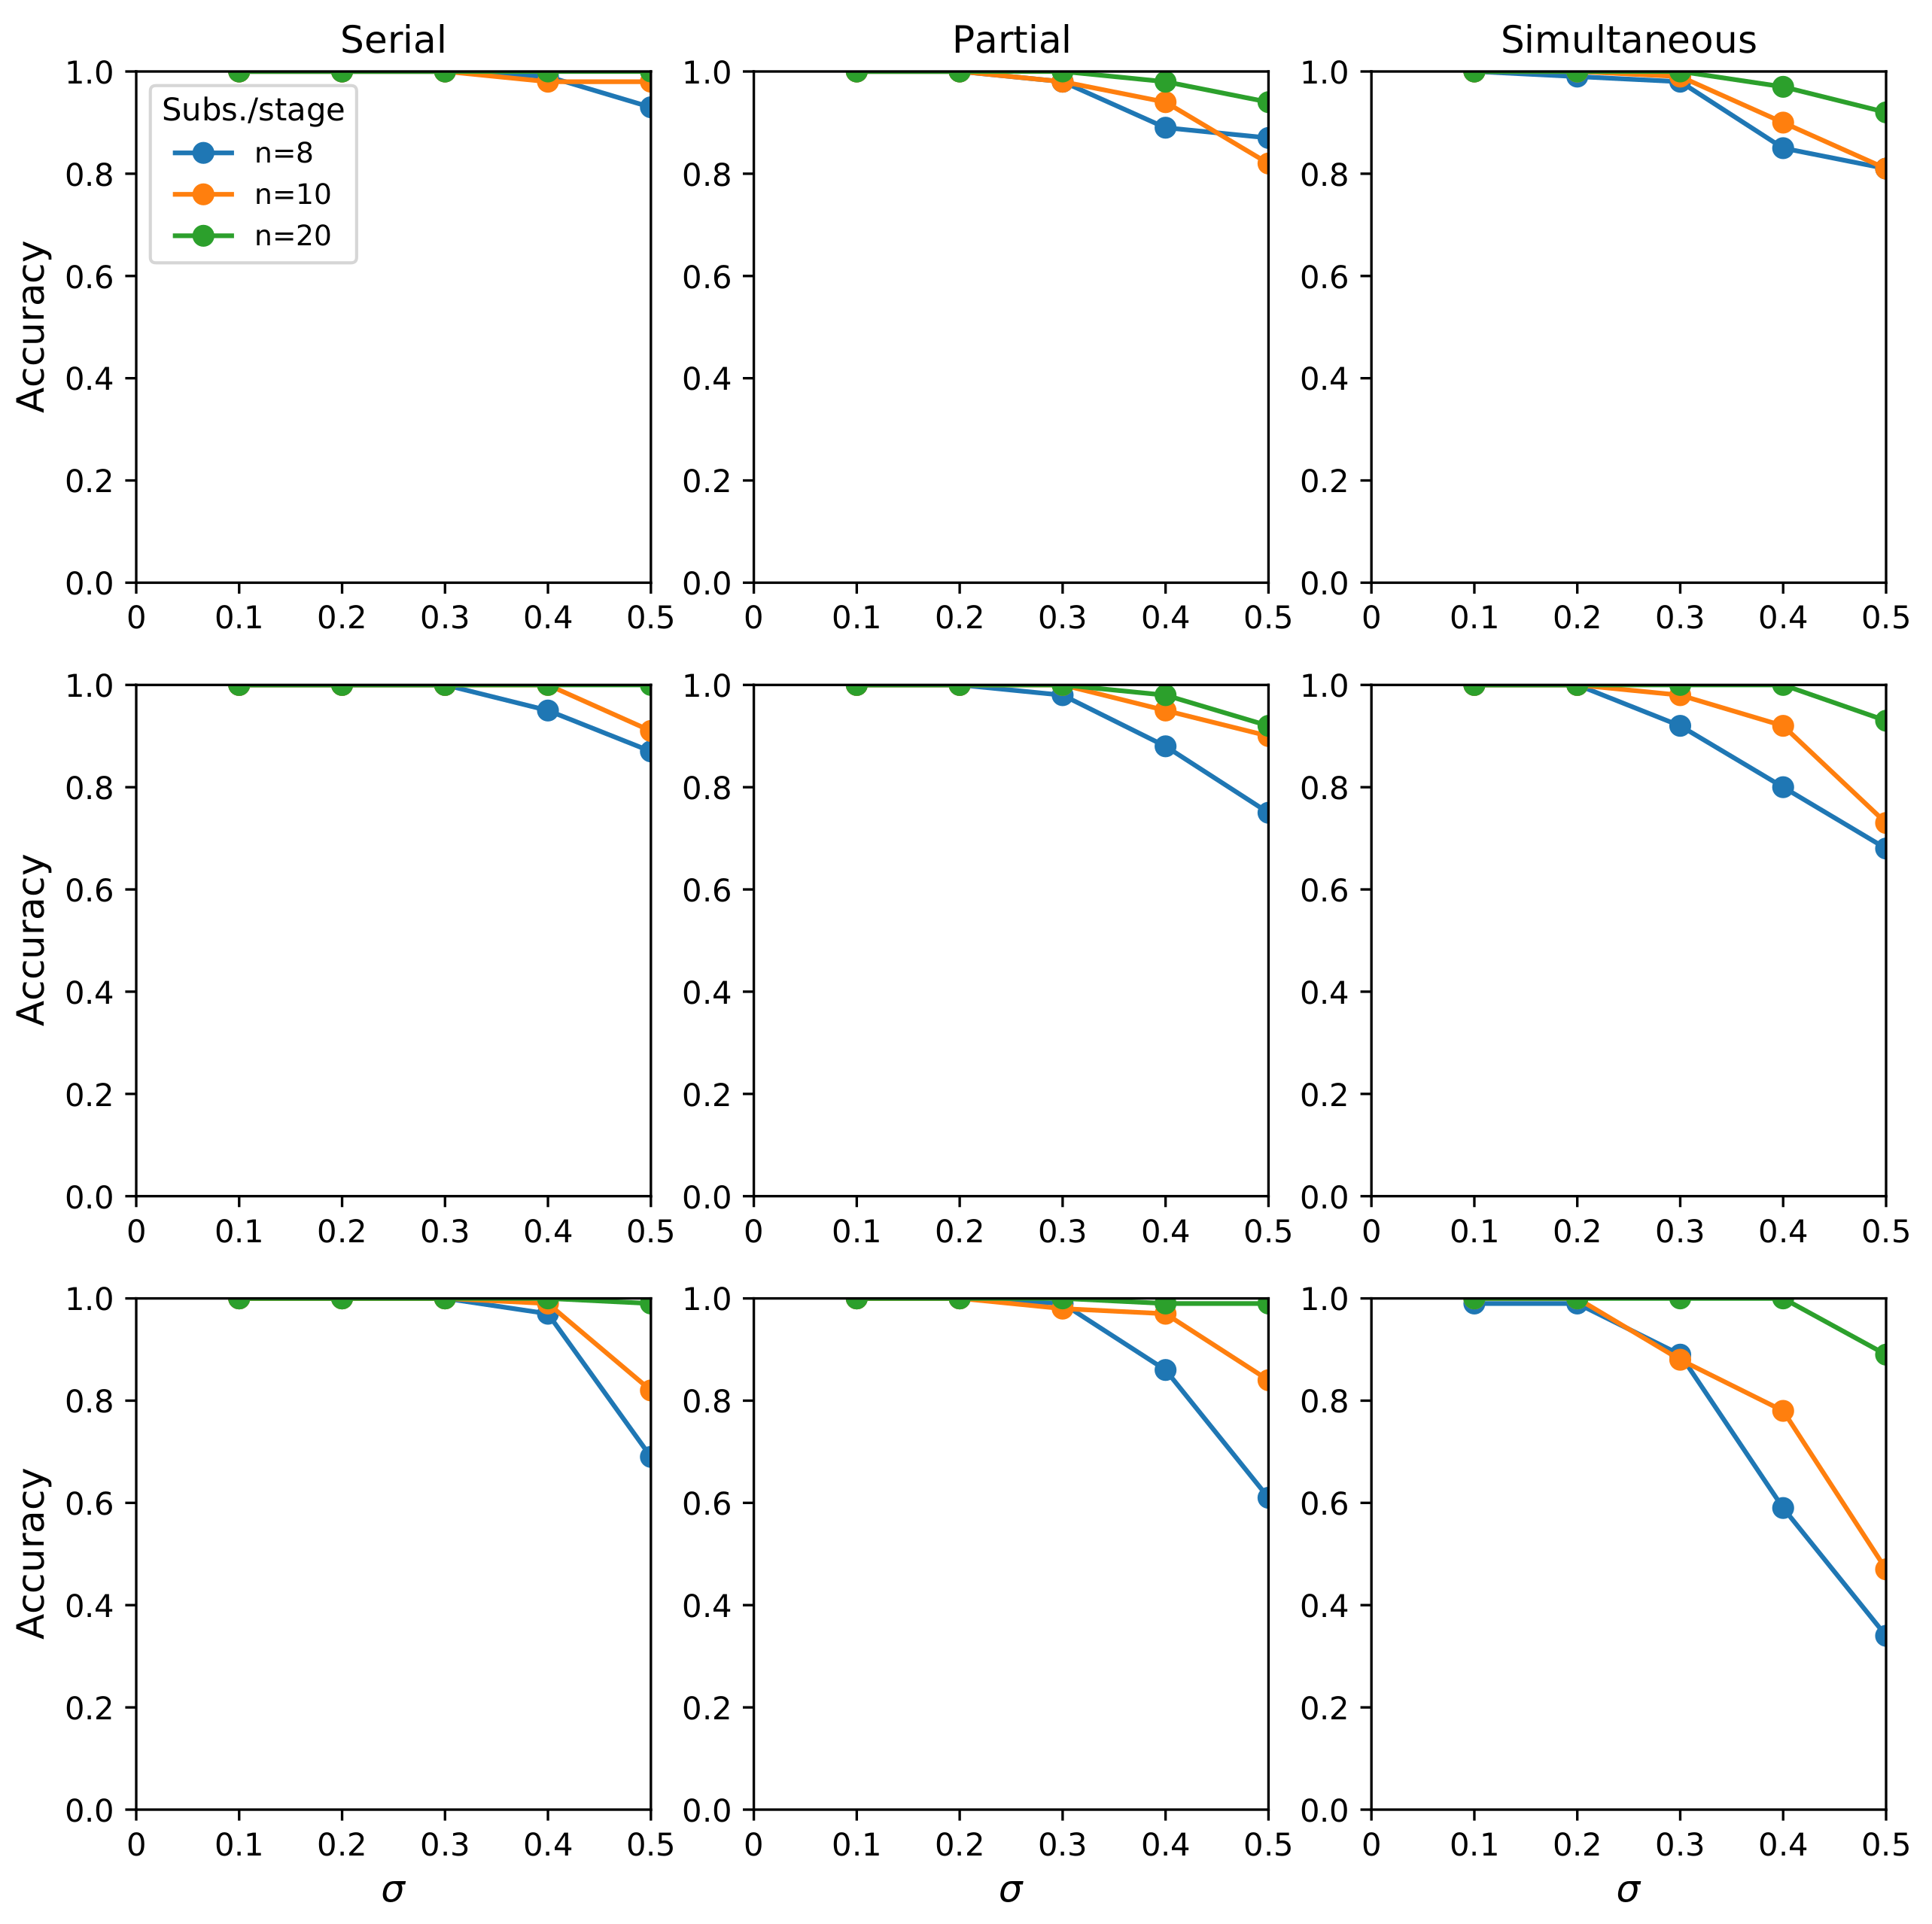
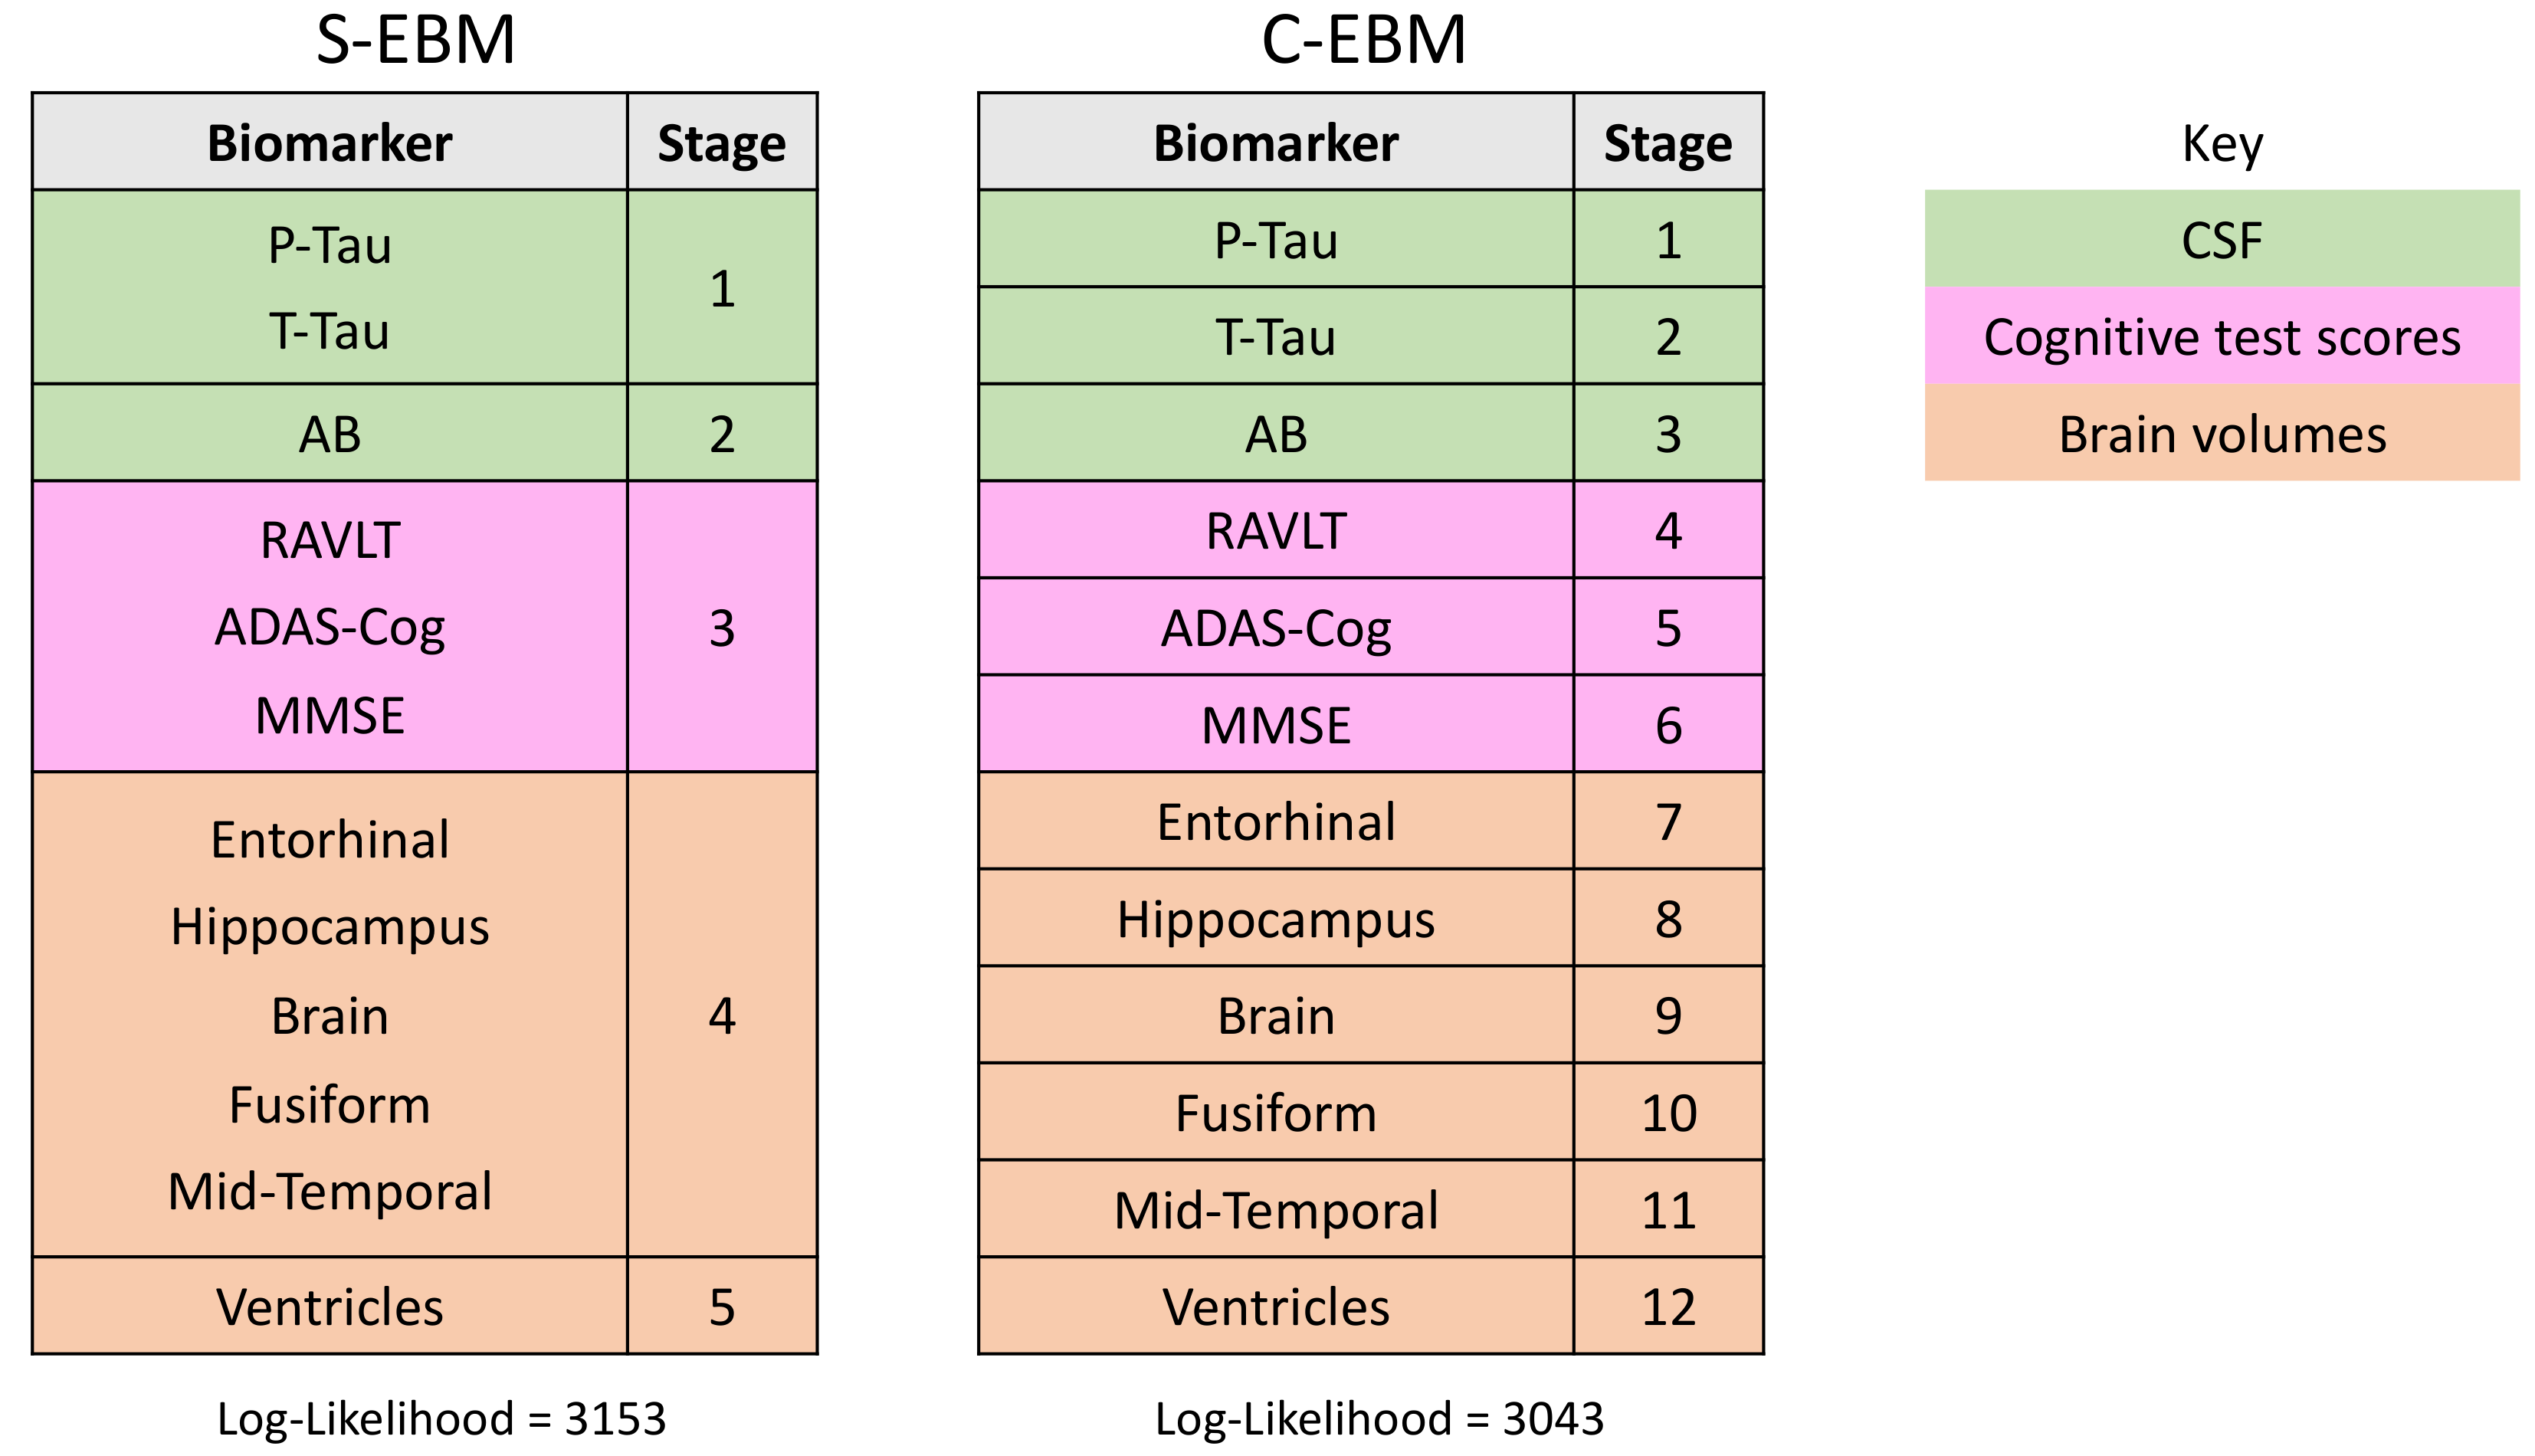
Figure 4. S-EBM and C-EBM sequences of AD progression estimated from the ADNI TADPOLE dataset. S-EBM estimated a sequence where biomarker within domains tended to become abnormal simultaneously, which had substantially higher likelihood than the serial sequence estimated by C-EBM (likelihood ratio = 5.9 x 1047). Note that as we assumed an equal prior probability of each sequence, the likelihood ratio equals the ratio of posterior probabilities.