0582
Chronic stress impacts energy metabolism and triggers motor neuropathy in an Optineurin knockout mouse model1CSIR-Centre for Cellular & Molecular Biology (CCMB), Hyderabad, India, 2Academy of Scientific and Innovative Research (AcSIR), Ghaziabad, India, 3CSIR-Indian Institute of Chemical Technology (IICT), Hyderabad, India
Synopsis
Keywords: Neurodegeneration, Spectroscopy, Amyotrophic Lateral Sclerosis
Amyotrophic Lateral Sclerosis (ALS) is the most common adult-onset progressive motor neurodegenerative disease. To study whether in vivo loss of the multifunctional adaptor protein Optineurin (OPTN) triggers ALS, a whole-body optineurin knock-out (Optn KO) mice was generated. In the absence of a clinical phenotype, we investigated the role of chronic stress as a potential ‘determinant’ of motor phenotype in Optn deficient background. Progressive motor impairment was observed after 30 days from chronic variable mild stress (CVMS) exposure in KO stressed mice. This occurs as a result of neurodegeneration and reactive gliosis associated with neuronal glucose hypometabolism and astroglial hypermetabolism.INTRODUCTION
Amyotrophic Lateral Sclerosis (ALS) is the most common adult-onset progressive motor neurodegenerative disease that causes skeletal muscle atrophy1. About 0.4-4% of ALS cases involve mutations in Optineurin (Optn), a multifunctional adaptor protein that regulates autophagy, chronic inflammation, and necroptosis2. To study whether in vivo loss of optineurin leads to ALS phenotype, a whole-body optineurin knock-out (KO) mouse model was generated3. However, these mice did not exhibit any clinical ALS phenotype. The incidence of ALS has been highly correlated with chronic exposure to physical and psychological stress4. Given the low penetrant nature of ALS-relevant Optn variants, we hypothesized that environmental stressors might act as a potential ‘determinant’ of the motor phenotype in Optineurin deficient background. The objective of the current study was to evaluate the impact of stress on ALS phenotype and energy metabolism in Optn KO mice.METHODS
All animal experiments were performed under an approved protocol by the Animal Ethics Committee of the Centre for Cellular and Molecular Biology (CCMB), Hyderabad, India. Optn knock-out (KO) and wild type (WT) mice were randomly sorted into four groups - WT Non-stress (WT+NS), KO Non-stress (KO+NS), WT Stress, and KO Stress; with 18 mice in each group. Mice in stress groups were subjected to two random stressors per day for 21 days5. The forelimb strength of mice was measured by a paw grip meter6. Motor coordination was evaluated through the rotarod test by recording the latency to fall from an accelerating wheel7. The neurological score was assigned depending on the extension reflex of hindlimbs8. In another set of experiments, KO stress mice were orally administered resveratrol (30 mg/kg) or vehicle (1% carboxymethylcellulose) for 30 days. Urethane (1.5 g/kg, intraperitoneally) anesthetized mice were intravenously administered [1,6-13C2]glucose for 10 min or [2-13C]acetate for 15 min using a bolus-variable infusion protocol to study the neuronal or astroglial metabolic activity, respectively9. Metabolites were extracted from the frozen cerebral cortex and spinal cord tissues10. The concentration and 13C labeling of neurometabolites were measured in 1H-[13C]-NMR spectra of tissue extract acquired using a 600 MHz NMR spectrometer11. The cerebral metabolic rate was calculated based on the 13C label trapped into amino acids12. The real-time quantitative polymerase chain reaction was used to assess the expression of target genes in the motor cortex and spinal cord tissues of mice. The statistical significance of differences between the groups was determined by a two-way analysis of variance (ANOVA) followed by Tukey post hoc correction for the multiple comparisons.RESULTS
Progressive impairment in neuromuscular strength and motor coordination was observed in Optn KO stress mice after 30 days of CVMS when compared to KO non-stress mice (Fig. 1), while a loss in extension reflex of hind limbs was noted only after 90 days. A representative 1H-[13C]-NMR spectra of the cortical extract of [1,6-13C2]glucose-infused Optn KO mice after 5 months from CVMS is shown in Fig. 2. There was a reduction in the 13C labeling of GluC4, GlnC4, and AspC3 in KO stress group when compared to KO non-stress group. As a result, there was a significant reduction in the rate of neuronal glucose oxidation in the cerebral cortex (KO stress: 0.25±0.07 μmol/g/min, KO non-stress: 0.36±0.08 μmol/g/min; n=5, p=0.002) and spinal cord (0.13±0.02 vs 0.17±0.04 μmol/g/min; n=5, p=0.003) of KO stress mice when compared to KO non-stress mice (Fig. 3A). In contrast, a significant (p=0.01) increase in the rate of acetate oxidation suggests enhanced astroglial activity in the cerebral cortex of KO stress mice (0.12±0.01 μmol/g/min, n=6) when compared to KO non-stress mice (0.09±0.02 μmol/g/min, n=6) (Fig. 3B). After 9 months from CVMS, gene expression studies revealed a decrease in the markers of neurons (CTIP2, -68%) and oligodendrocytes (OLIG2, -69%), with a concomitant increase in the markers of reactive astrocytes (S100β, +245%) and microglia (TMEM119, +253%) in the motor cortex of KO stress mice when compared to KO non-stress mice (Fig. 4A). Additionally, there was an upregulation of the ALS-relevant and chronic stress-associated histone deacetylases HDAC2 (+195%) and HDAC6 (+104%) (Fig. 4B). Similar observations were made in the spinal cord. Interestingly, the intervention of resveratrol, an autophagy-inducer drug, led to a recovery of motor functions in Optn KO stressed mice when compared to the vehicle-treated group after 30 days (Fig. 5).DISCUSSION
The current study suggests that chronic stress acts as an external determinant of ALS-like motor neuropathy in Optn knockout background. There have only been a few studies on the role of defective neuroglial energy metabolism in ALS. 18F-FDG-PET imaging revealed glucose hypometabolism in the cortex, with hypermetabolism in the spinal cord of ALS patients13,14. Impaired neuronal glucose metabolism with unperturbed astroglial activity has been reported in symptomatic SOD1G93A mice15. The neurometabolic measurements together with gene expression analysis in the current study reveal that neuronal glucose hypometabolism and astroglial hypermetabolism are associated with neurodegeneration and reactive gliosis in the cerebral cortex and spinal cord of Optn KO stressed mice.CONCLUSION
Chronic activation of the neuroendocrine stress response system possibly dysregulates the epigenetic machinery upstream of Optineurin-regulated neuroprotective processes, and compromises the brain energy metabolism to result in ALS.Acknowledgements
The study was supported by the Department of Science and Technology (DST/CSRI/2017/258), Government of India and Senior Research fellowship (DBT/2017/CCMB/844) to BD from the Department of Biotechnology (DBT), Government of India.
References
1. Rowland LP, Shneider NA. Amyotrophic lateral sclerosis. N Engl J Med. 2001;344(22):1688-1700.
2. Maruyama H, Morino H, Ito H, et al. Mutations of optineurin in amyotrophic lateral sclerosis. Nature. 2010;465(7295):223-226.
3. Moharir SC, Bansal M, Ramachandran G, et al. Identification of a splice variant of optineurin which is defective in autophagy and phosphorylation. Biochim Biophys Acta Mol Cell Res. 2018;1865(11 Pt A):1526-1538.
4. Mishra PK, Adusumilli M, Deolal P, Mason GF, Kumar A, Patel AB. Impaired neuronal and astroglial metabolic activity in chronic unpredictable mild stress model of depression: Reversal of behavioral and metabolic deficit with lanicemine. Neurochem Int. 2020;137:104750.
5. Fidler JA, Treleaven CM, Frakes A, et al. Disease progression in a mouse model of amyotrophic lateral sclerosis: the influence of chronic stress and corticosterone. FASEB J. 2011;25(12):4369-4377.
6. Kondziella W. Eine neue methode zur messung der muskulaeren relaxation bei weiben maeusen [A new method for the measurement of muscle relaxation in white mice]. Arch Int Pharmacodyn Ther. 1964;152:277-284.
7. Deacon RM, Croucher A, Rawlins JN. Hippocampal cytotoxic lesion effects on species-typical behaviours in mice. Behav Brain Res. 2002;132(2):203-213.
8. Hatzipetros T, Kidd JD, Moreno AJ, Thompson K, Gill A, Vieira FG. A Quick Phenotypic Neurological Scoring System for Evaluating Disease Progression in the SOD1-G93A Mouse Model of ALS. J Vis Exp. 2015;(104):53257.
9. Tiwari V, Ambadipudi S, Patel AB. Glutamatergic and GABAergic TCA cycle and neurotransmitter cycling fluxes in different regions of mouse brain. J Cereb Blood Flow Metab. 2013;33(10):1523-1531.
10. Patel AB, Rothman DL, Cline GW, Behar KL. Glutamine is the major precursor for GABA synthesis in rat neocortex in vivo following acute GABA-transaminase inhibition. Brain Res. 2001;919(2):207-220.
11. de Graaf RA, Mason GF, Patel AB, Rothman DL, Behar KL. Regional glucose metabolism and glutamatergic neurotransmission in rat brain in vivo. Proc Natl Acad Sci U S A. 2004;101(34):12700-12705.
12. Mishra PK, Kumar A, Behar KL, Patel AB. Subanesthetic ketamine reverses neuronal and astroglial metabolic activity deficits in a social defeat model of depression. J Neurochem. 2018;146(6):722-734.
13. Buhour MS, Doidy F, Mondou A, et al. Voxel-based mapping of grey matter volume and glucose metabolism profiles in amyotrophic lateral sclerosis. EJNMMI Res. 2017;7(1):21.
14. Marini C, Morbelli S, Cistaro A, et al. Interplay between spinal cord and cerebral cortex metabolism in amyotrophic lateral sclerosis. Brain. 2018;141(8):2272-2279.
15. Tefera TW, Borges K. Neuronal glucose metabolism is impaired while astrocytic TCA cycling is unaffected at symptomatic stages in the hSOD1G93A mouse model of amyotrophic lateral sclerosis. J Cereb Blood Flow Metab. 2019;39(9):1710-1724.
Figures
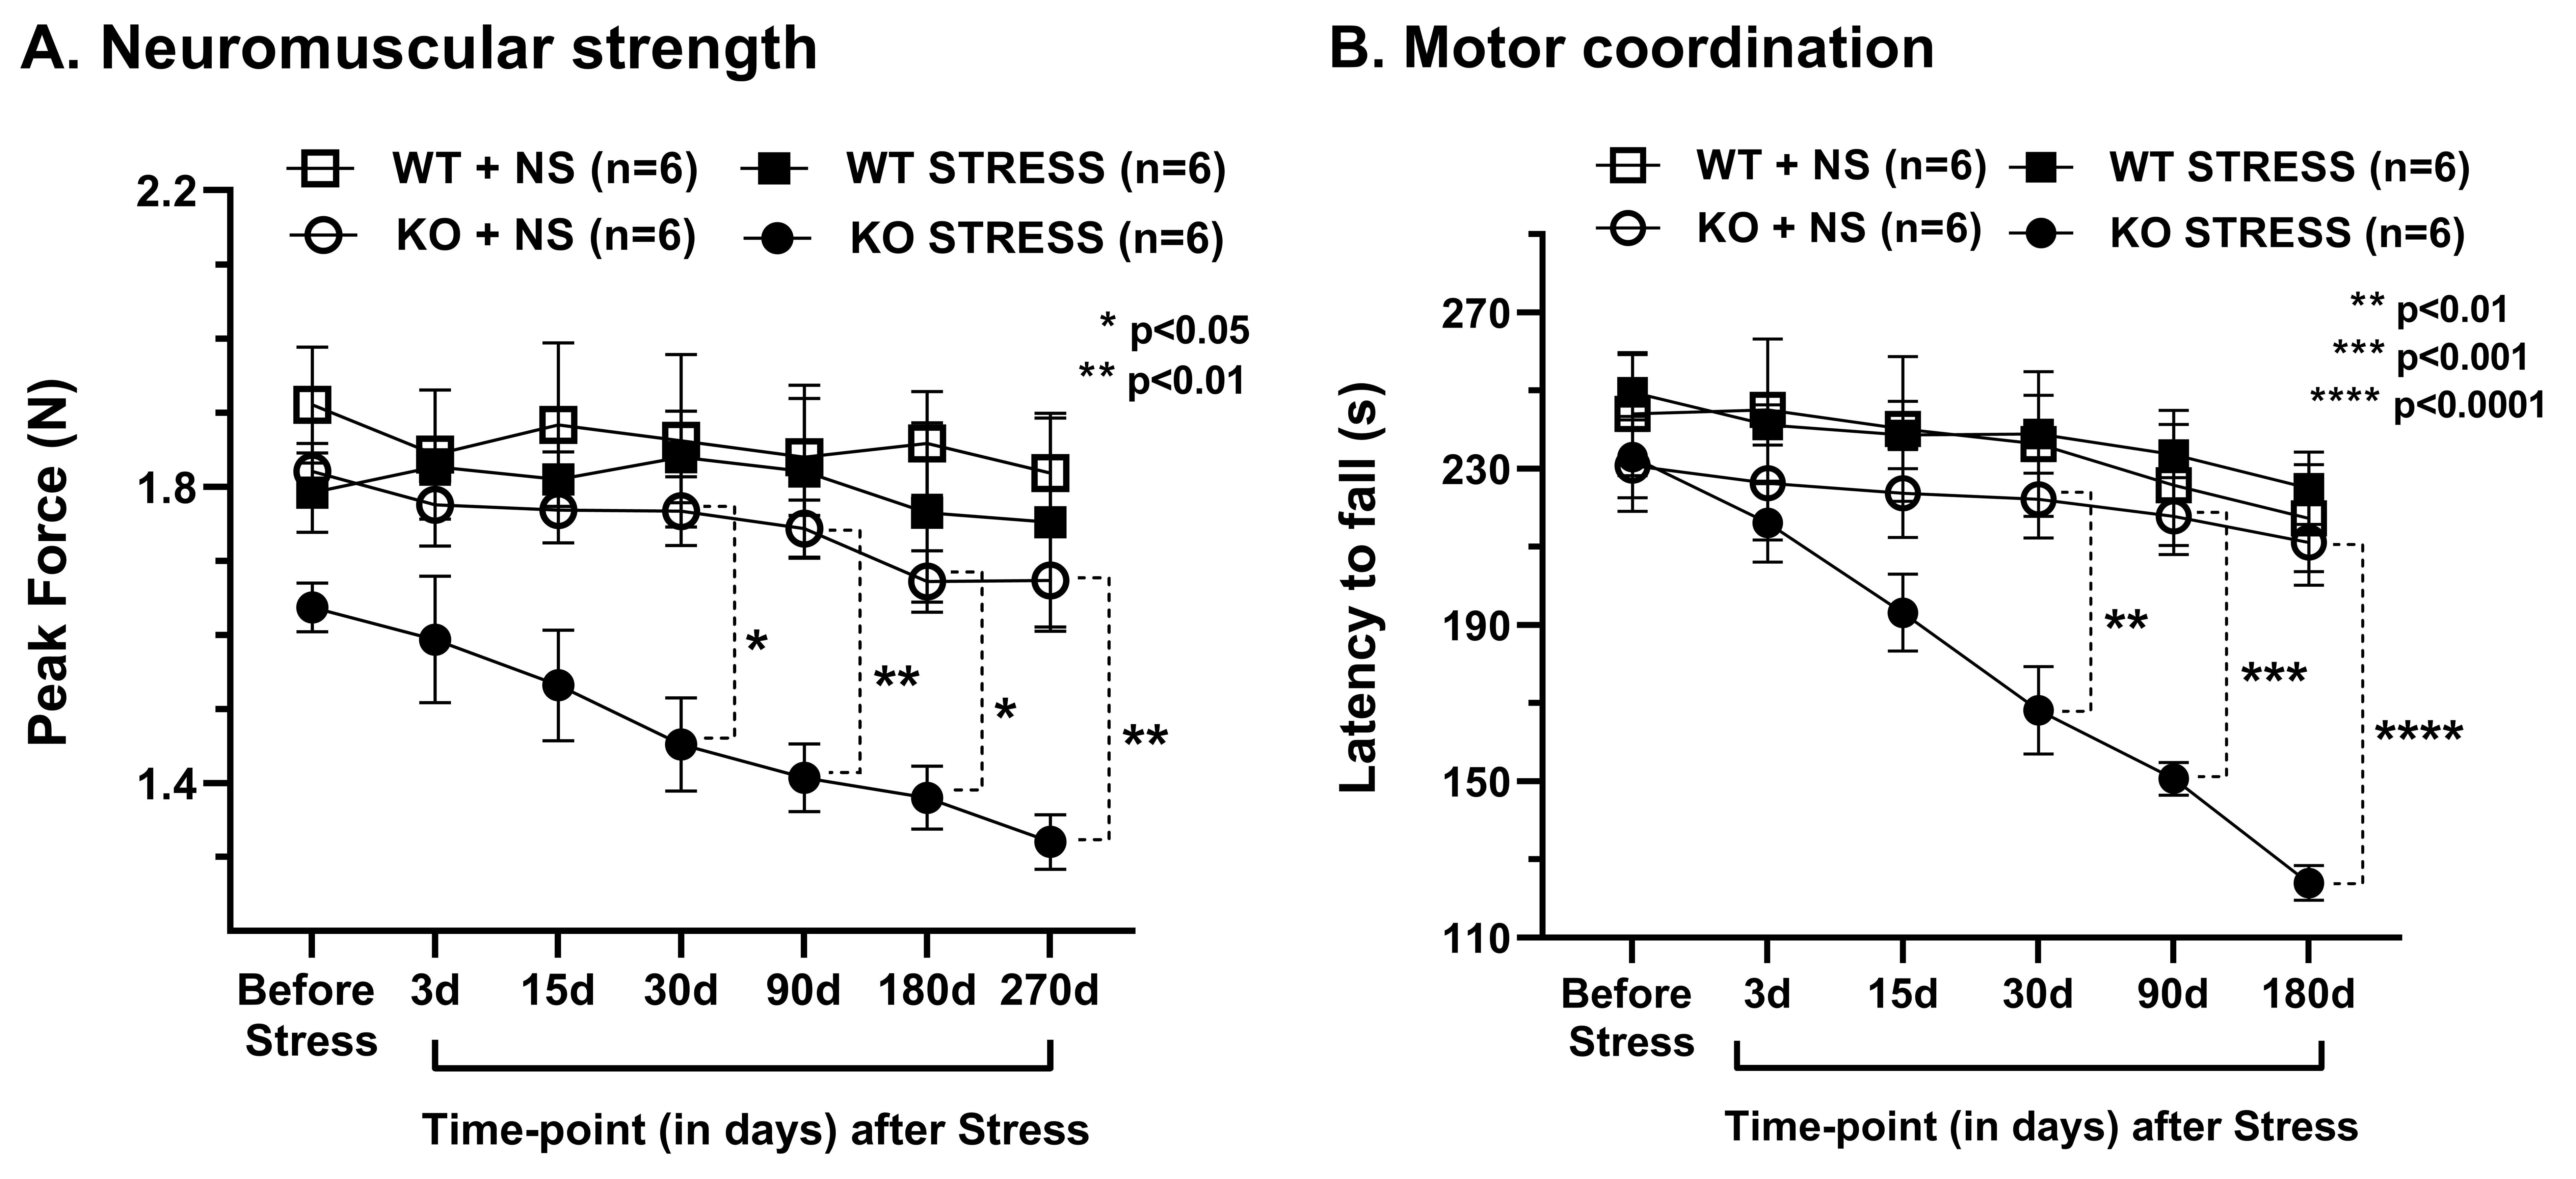
Fig. 1. Motor phenotype after Chronic Variable Mild Stress (CVMS) exposure in Optn KO mice: A. Neuromuscular strength measured by the grip meter test, B. Motor coordination measured as the latency to fall in the rotarod test. Mice (n=6 in each group) were exposed to CVMS at 9 months of age. Each symbol with an error bar denotes the values as mean±SD for each time point. *p<0.05, **p<0.01, ***p<0.001, ****p<0.0001 when KO stress group is compared with KO non-stress (NS) group. WT: wild type.
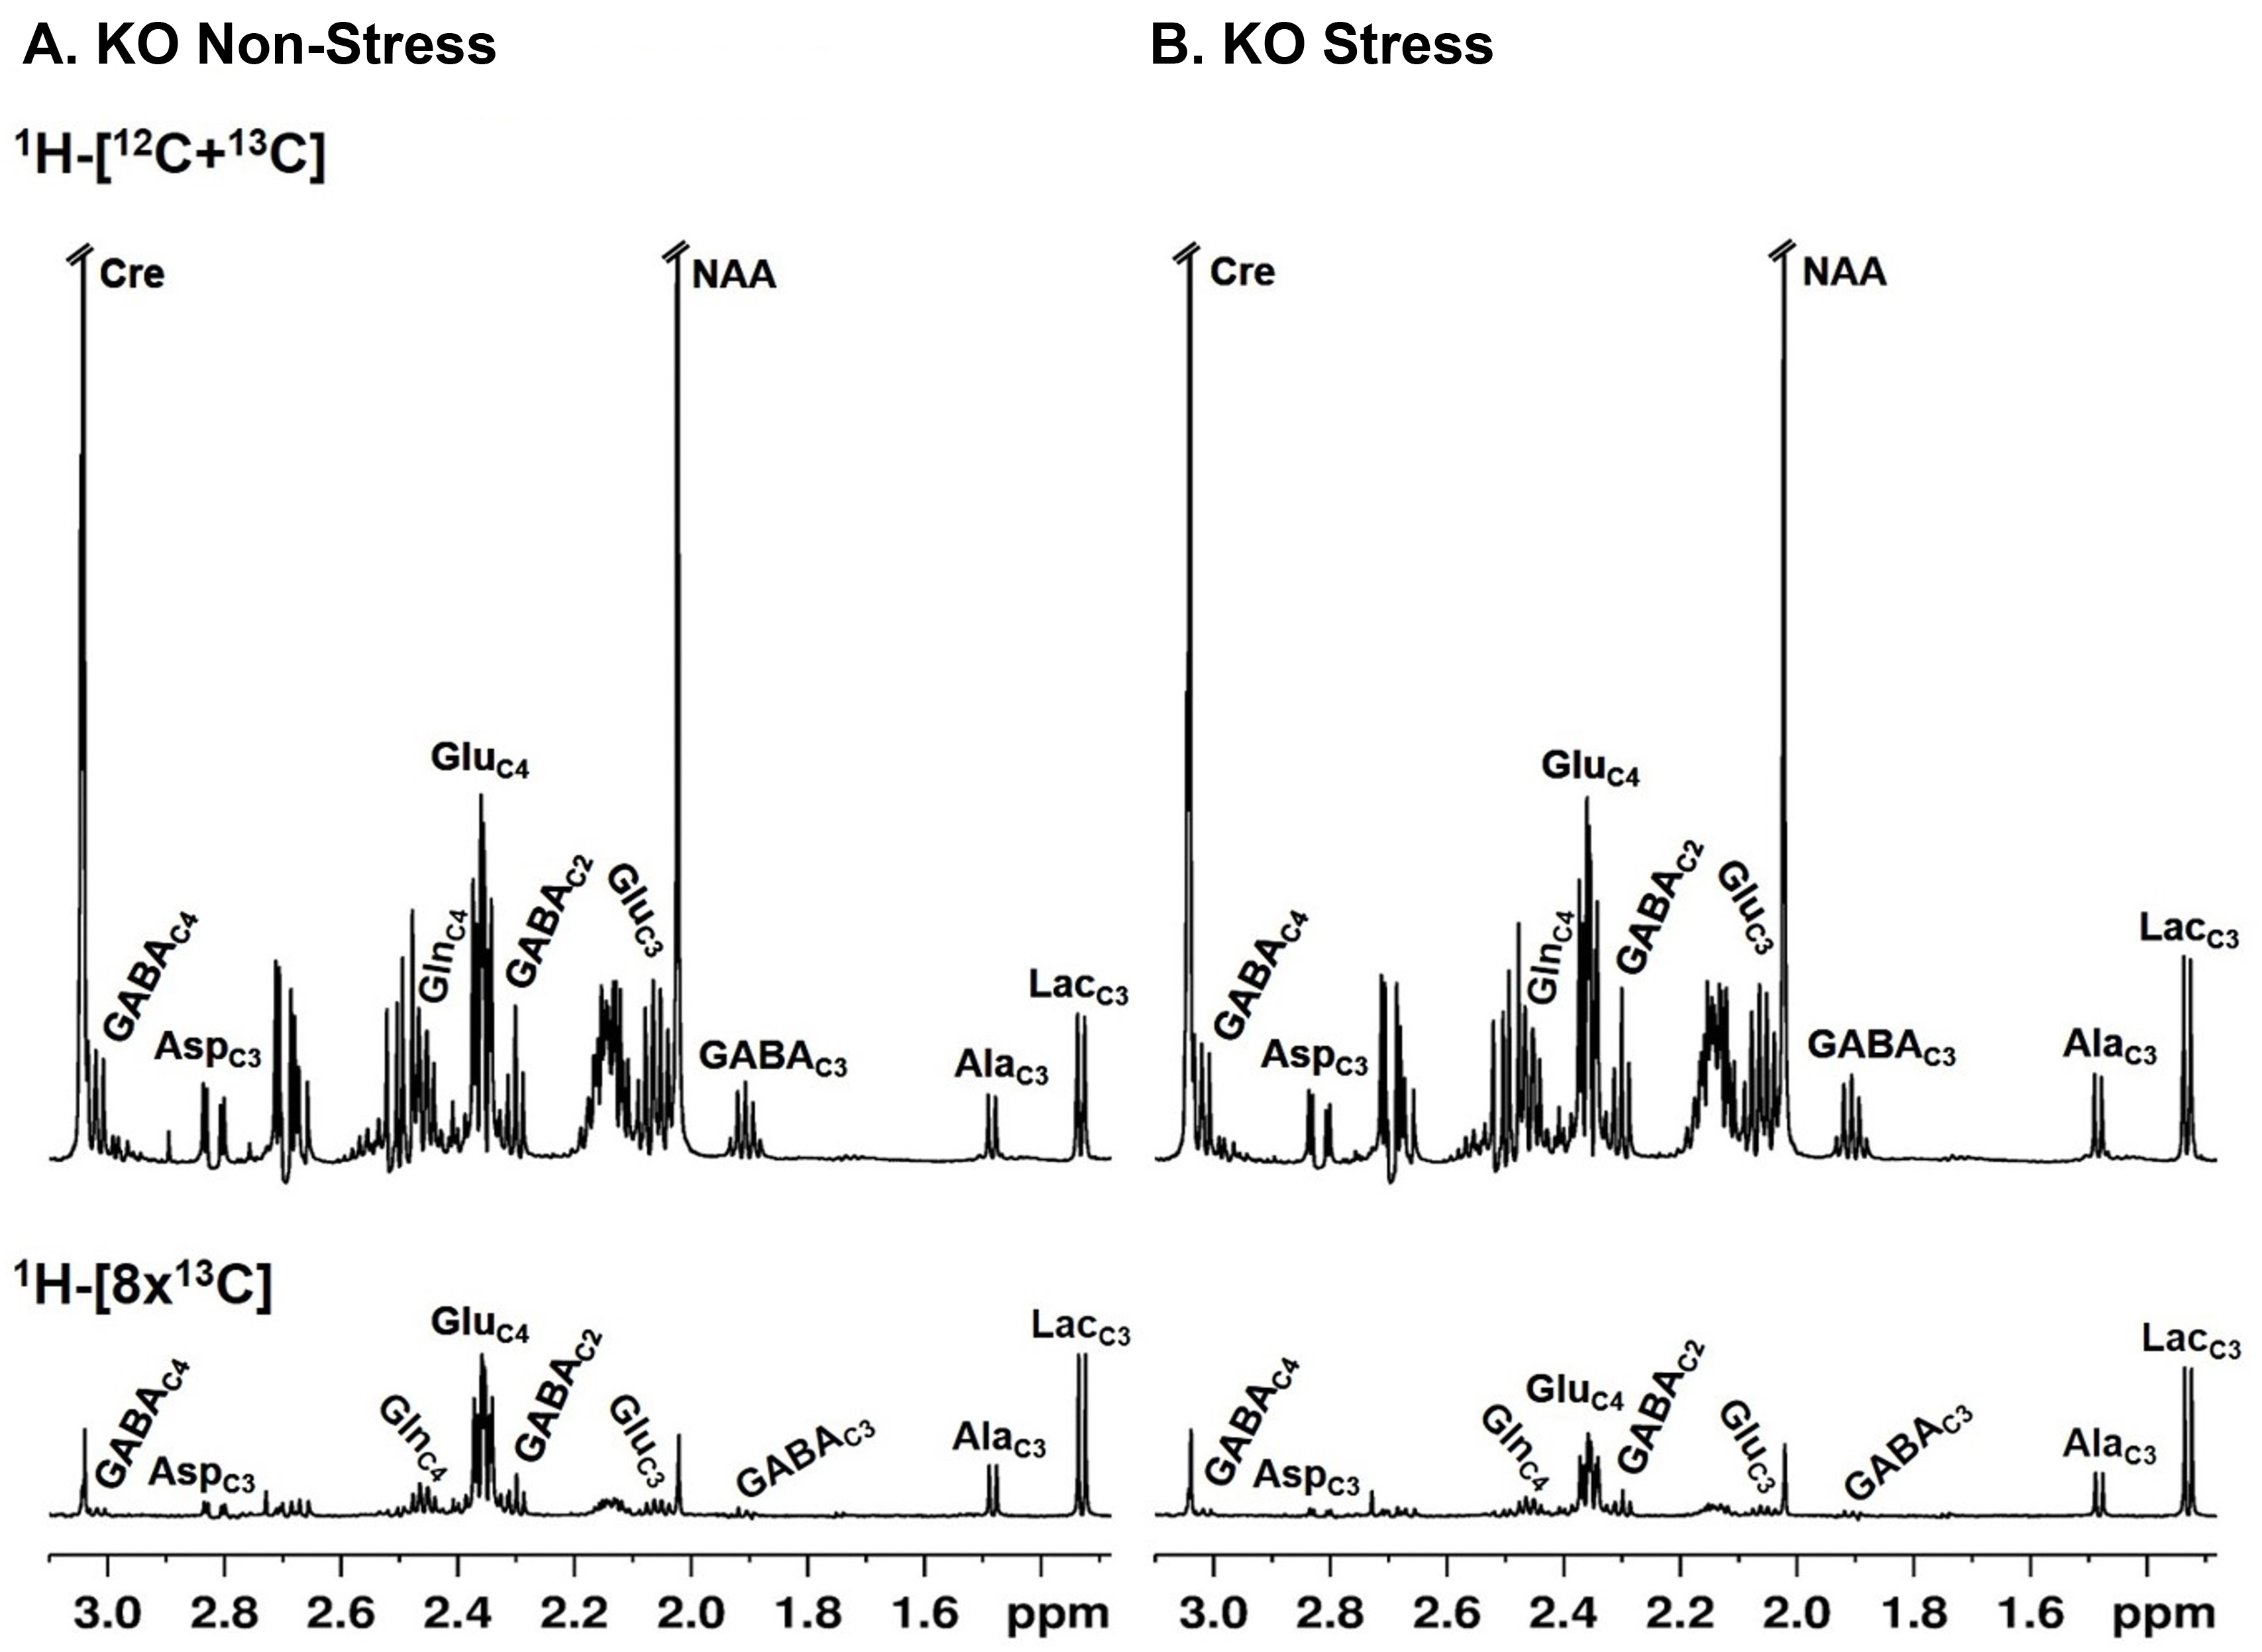
Fig. 2. 1H-[13C]-NMR spectra of the cortical extract of 15 months old Optn KO mice: A. KO non-stress, B. KO stress mouse. Mice were infused with [1,6-13C2]glucose for 10 mins. Spectra in the upper panel depict the signal intensities from 1H attached to 12C and 13C at specific carbon positions of neurometabolites, while those in the lower panel denote 13C labeling only. AlaC3, alanine-C3; AspC3, aspartate-C3; GABAC2, GABA-C2; GlnC4, glutamine-C4; GluC4, glutamate-C4; LacC3, lactate-C3.
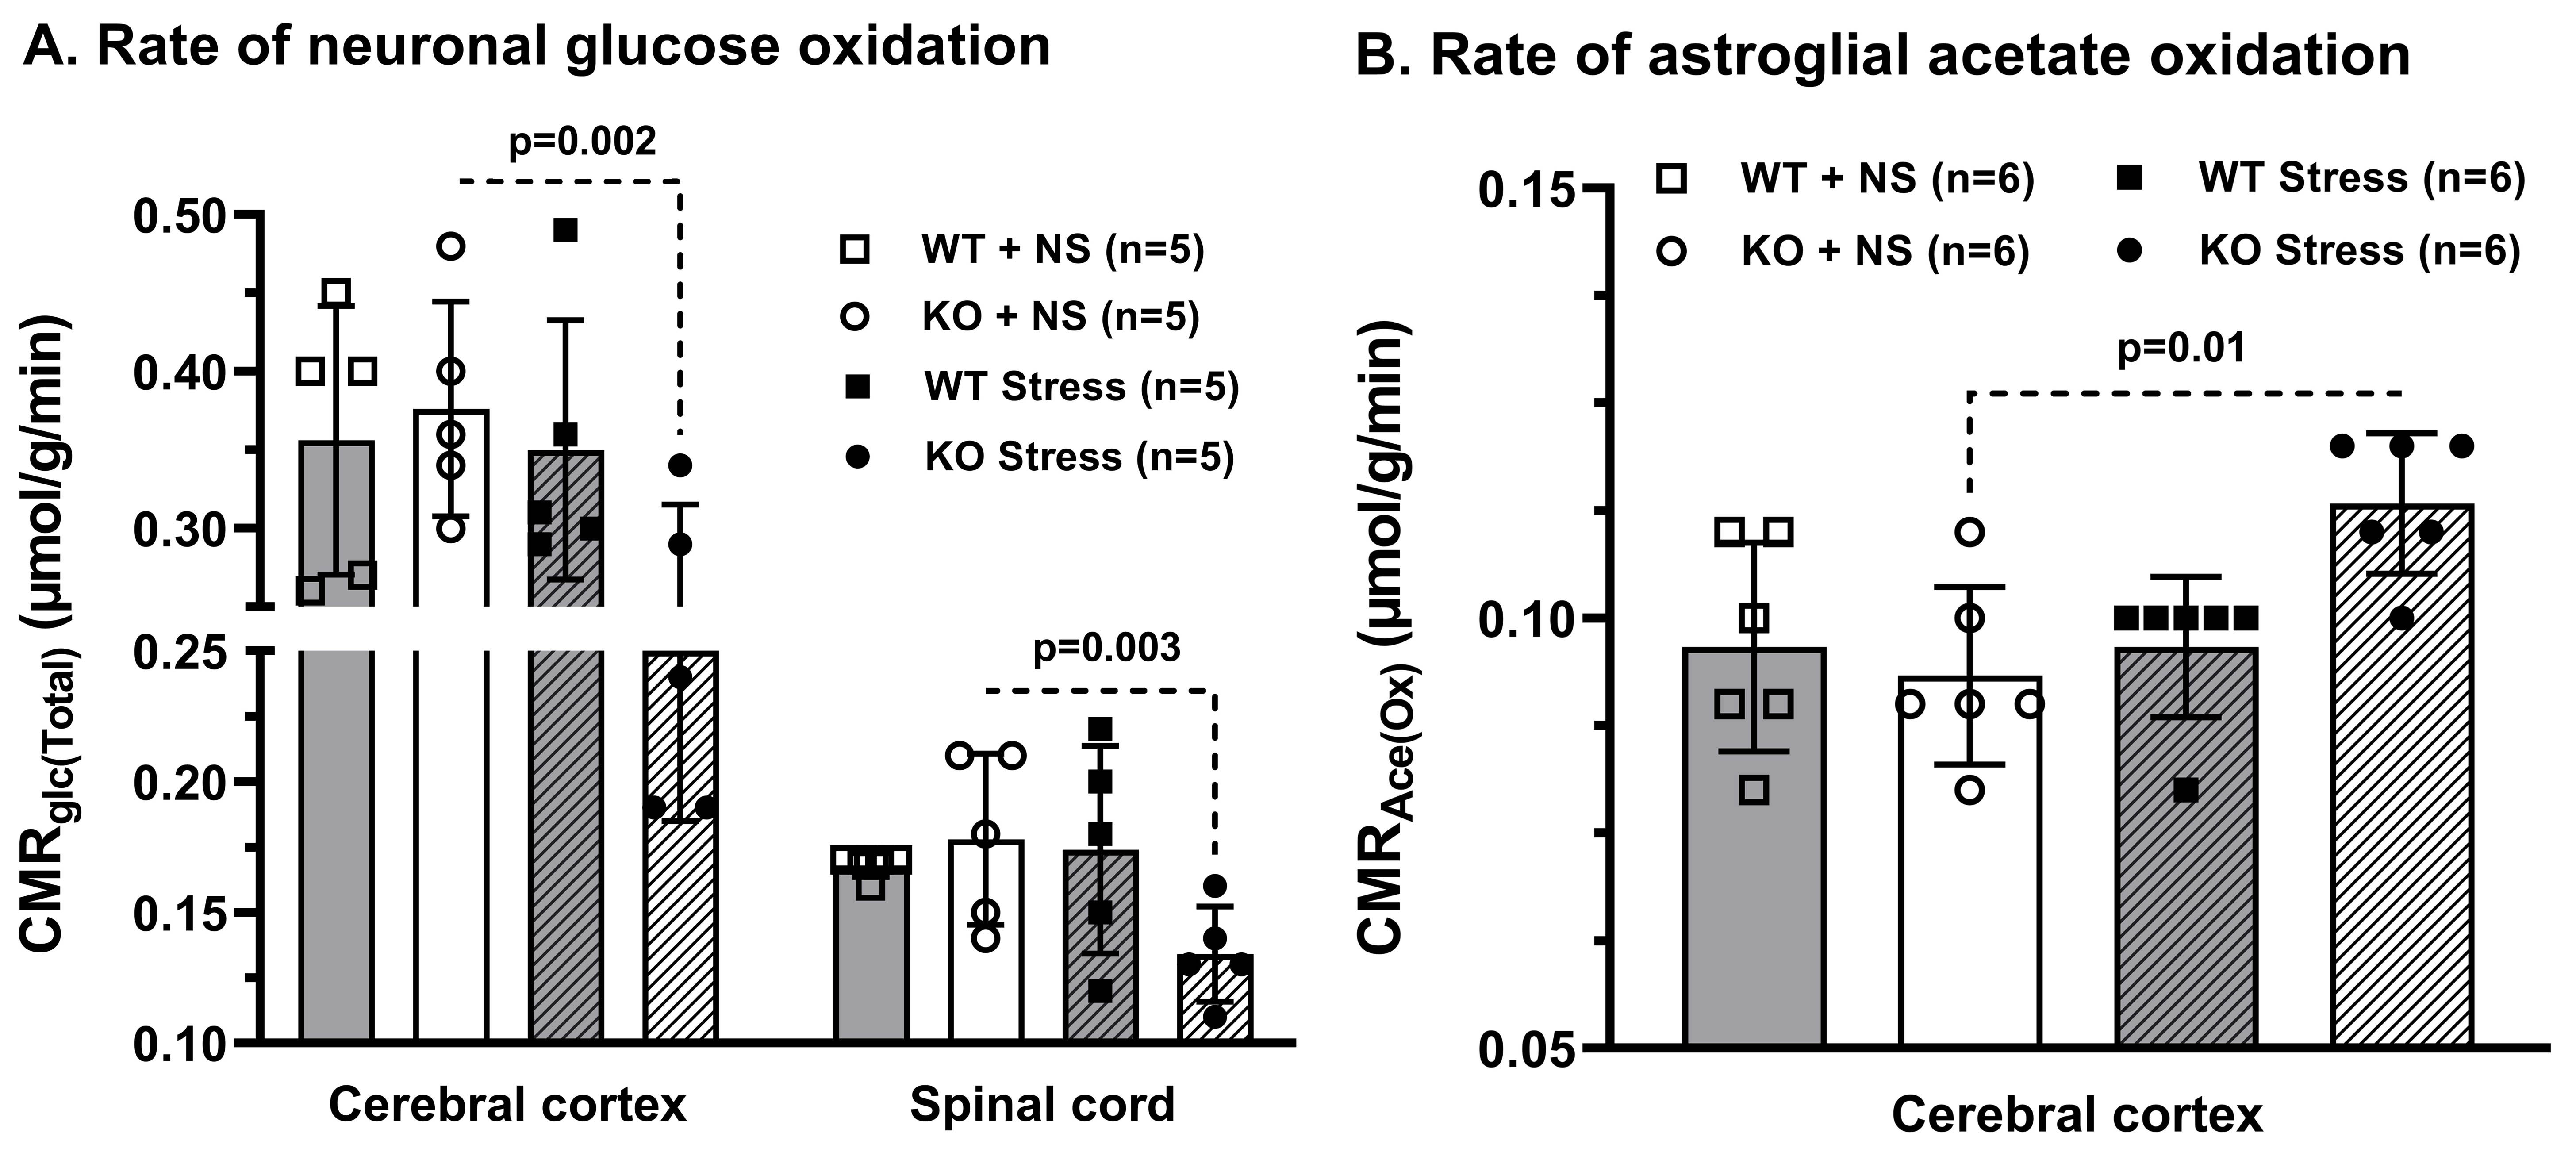
Fig. 3. Cerebral metabolic rate in Optn KO mice after 5 months from CVMS: A. Glucose oxidation (CMRGlc(Total)), B. Acetate oxidation (CMRAce(Ox)). Each dot represents the measurements from an individual animal. The vertical bars represent the values for each group as mean±SD. The p-value denoted is for KO stress group compared to KO non-stress (NS) group. WT: wild type.
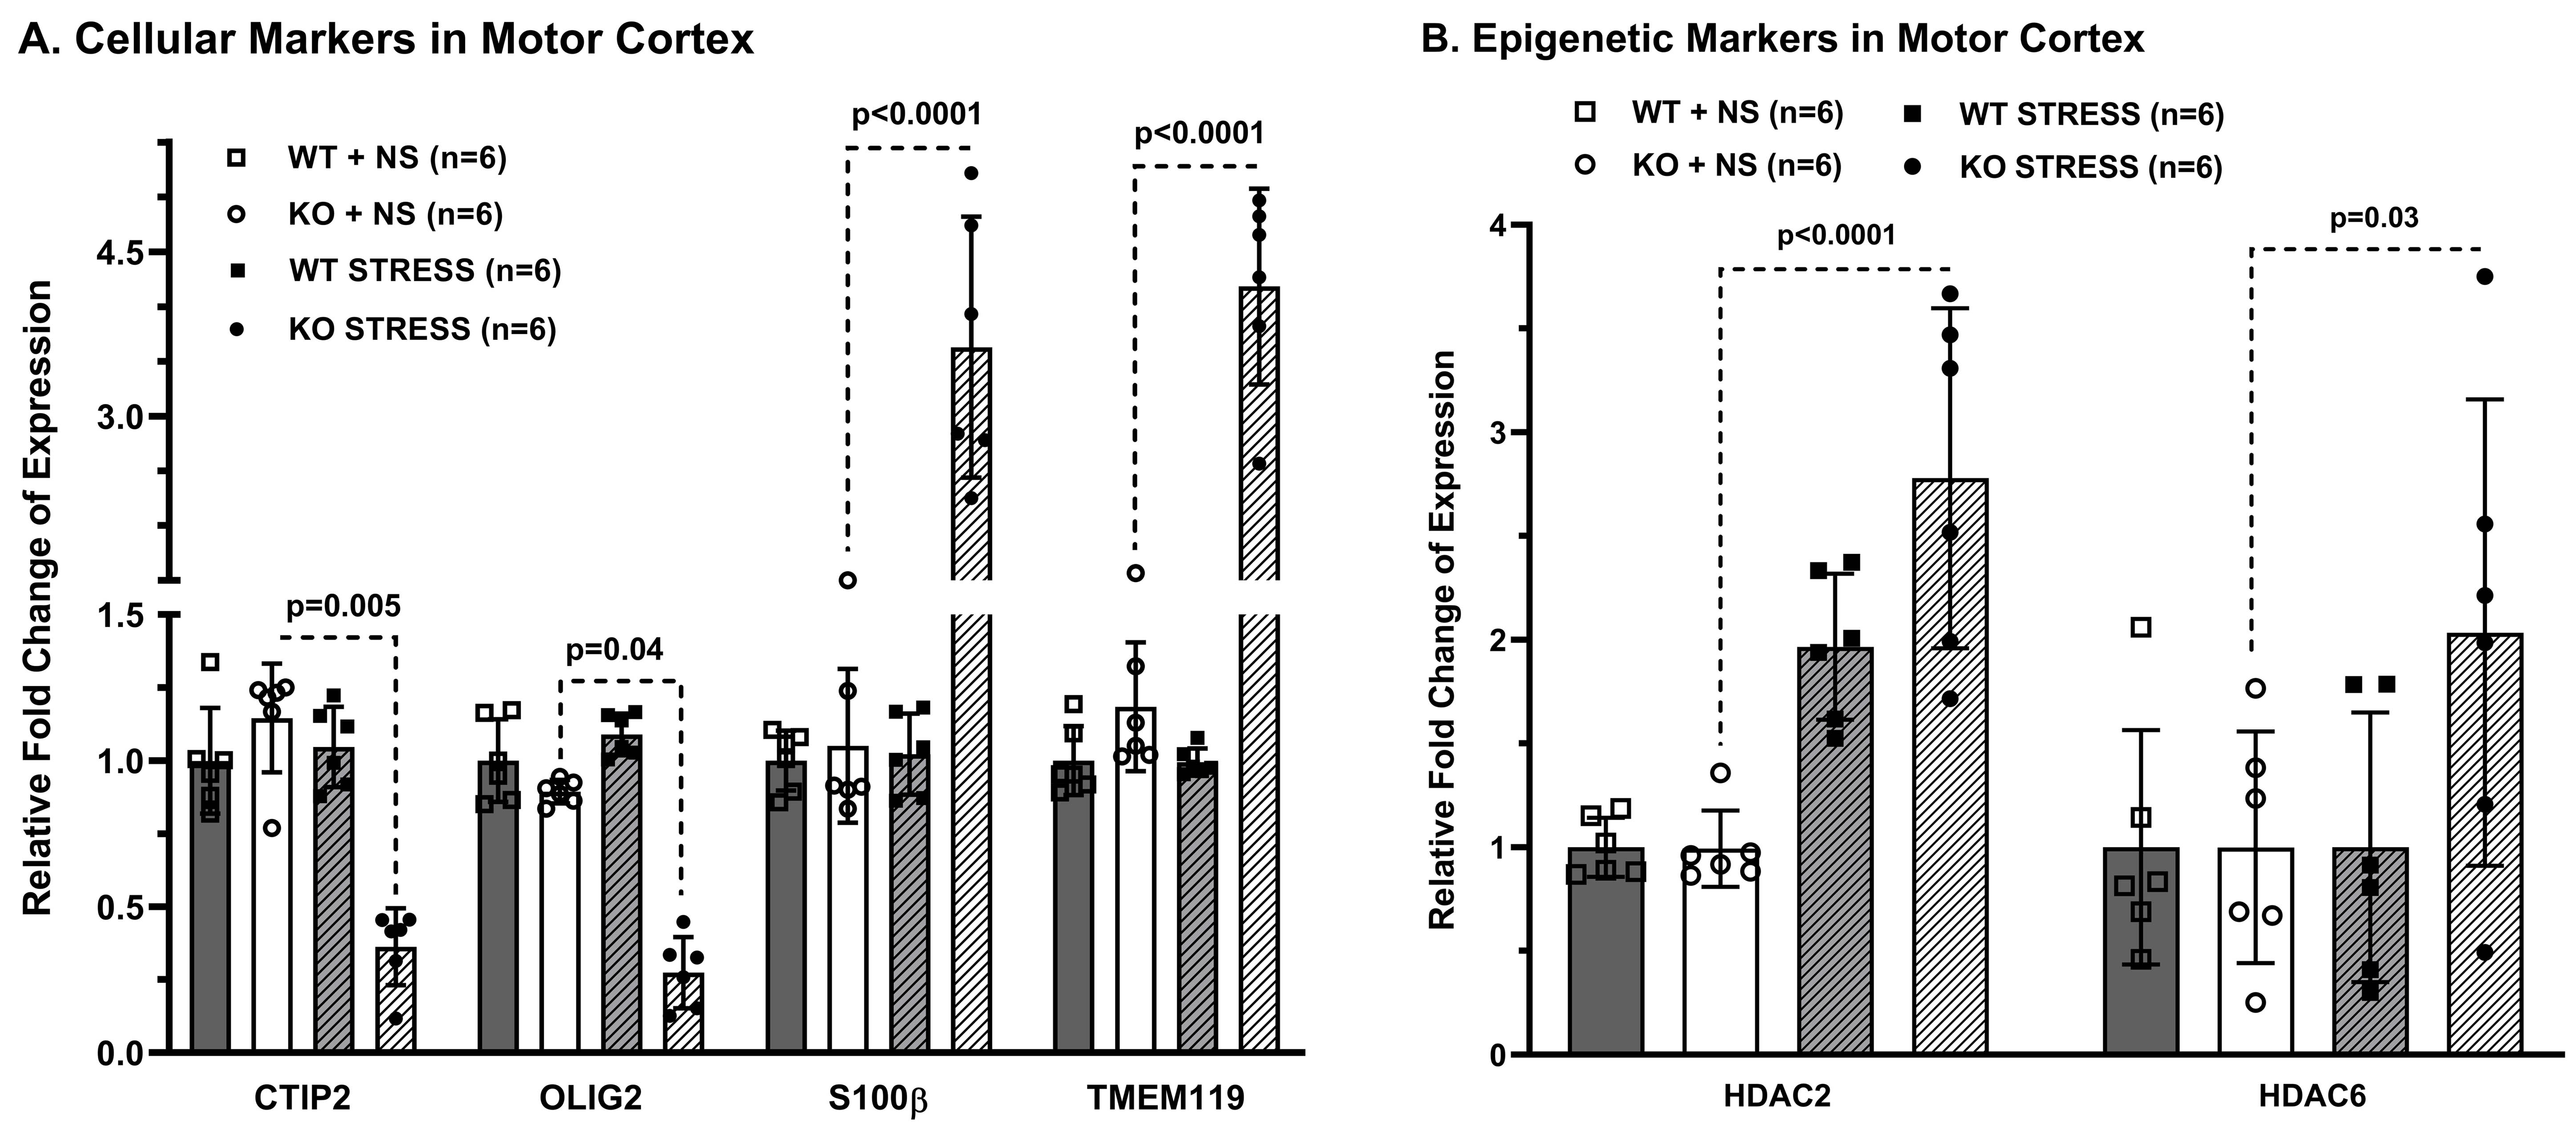
Fig. 4. Expression of ALS-relevant genes in the motor cortex of Optn KO mice after 9 months from CVMS: A. Markers of neurons (CTIP2), oligodendrocytes (OLIG2), reactive astrocytes (S100β), microglia (TMEM119), B. Epigenetic regulators (HDAC2, HDAC6). Mice were CVMS exposed at 9 months. Relative fold change was calculated after normalization with β-Actin. Each dot represents the measurement from an individual animal. The vertical bars represent the values for each group as mean±SD. The p-value denoted is for KO stress group compared to KO non-stress (NS) group. WT: wild type.
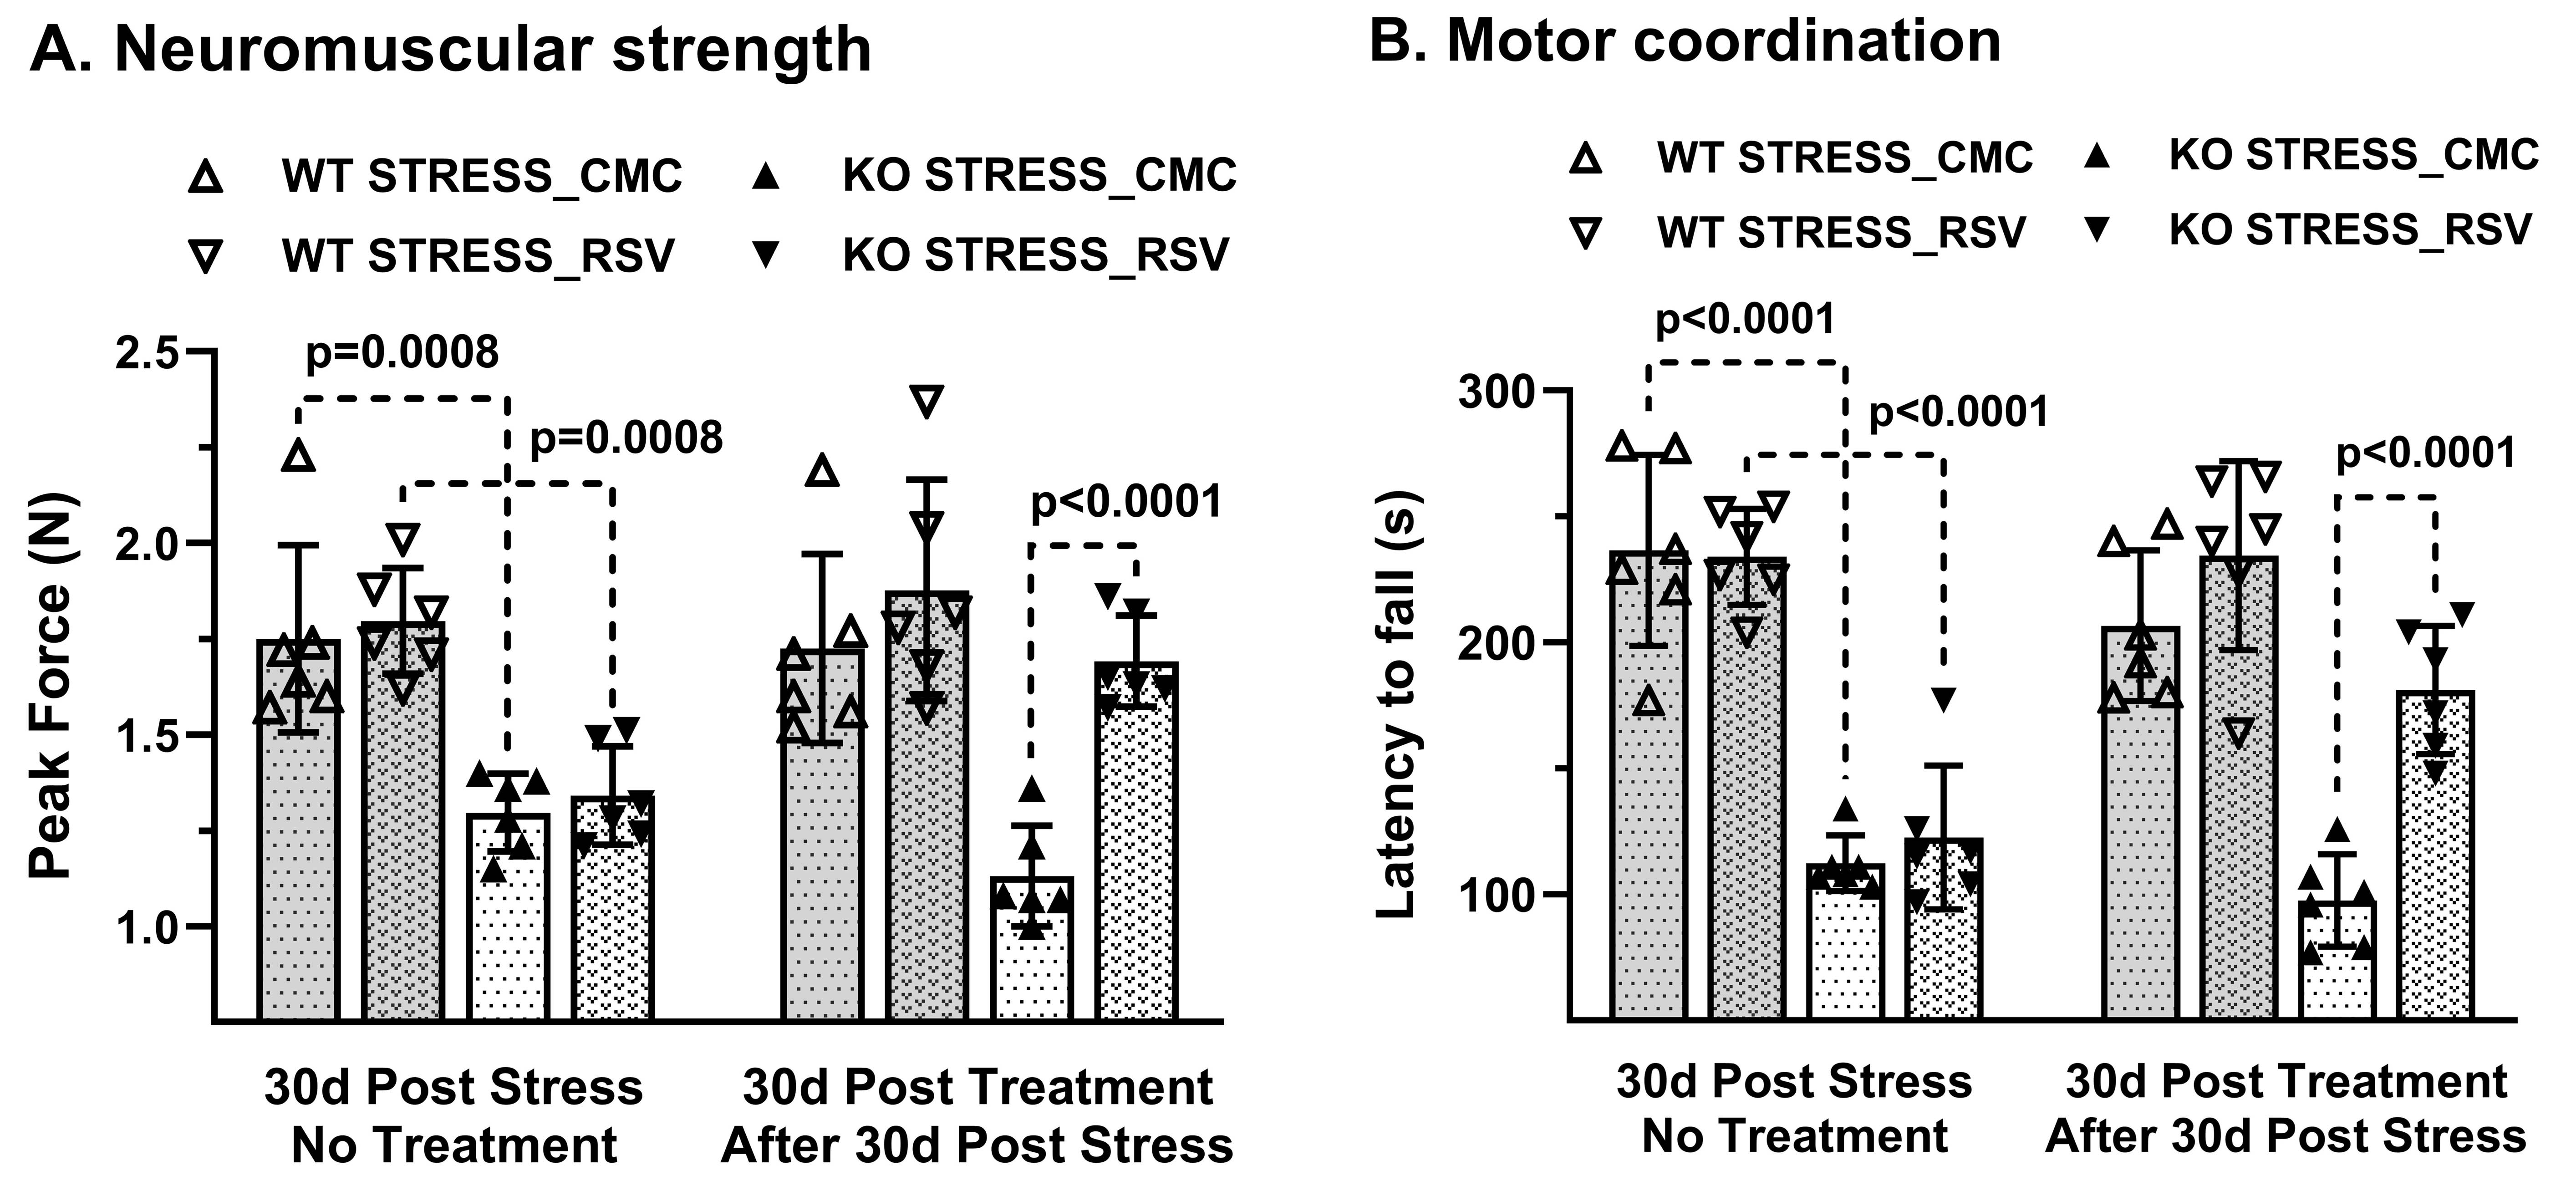
Fig. 5. Motor function after resveratrol (RSV) intervention in 12 months old Optn KO stress mice: A. Peak force measured by grip meter test, B. Latency to fall measured by rotarod test. Treatment was given for 30 days upon confirming the motor phenotype in KO mice after 30 days from CVMS. Each dot represents the measurements from an individual animal. The vertical bars represent the values for each group as mean±SD. WT: wild type; CMC: carboxymethylcellulose.