0581
Region-specific characteristics of brain oxygen extraction fraction: relationships to aging and white matter hyperintensities1Department of Biomedical Engineering, Johns Hopkins University School of Engineering, Baltimore, MD, United States, 2Department of Biomedical Engineering, Johns Hopkins University School of Medicine, Baltimore, MD, United States, 3Department of Radiology, Johns Hopkins University School of Medicine, Baltimore, MD, United States, 4Department of Medicine, Johns Hopkins School of Medicine, Baltimore, MD, United States, 5Department of Neurology, Johns Hopkins University School of Medicine, Baltimore, MD, United States
Synopsis
Keywords: Neurodegeneration, Aging
Aging is a multifaceted process involving both structural and metabolic alterations. Cerebral oxygen-extraction-fraction (OEF) is an important physiological parameter indexing the brain’s oxygen metabolism. In this work, we assessed regional OEF in young and older adults, and investigated its associations with aging and white-matter-hyperintensities. We observed significant age-related increase in cortical OEF but not in subcortical OEF, suggesting that aging may have different effects on tissue metabolism in cortical and subcortical regions. Furthermore, we found a significant inverse correlation of WMH with OEF in internal-cerebral-veins, implying that OEF of subcortical structures may be useful in predicting WMH.INTRODUCTION
Aging is a complex and multifaceted process, with diminishment in certain measures (e.g., brain volumes) while compensatory increases in others (e.g., elevated activations in certain brain regions as measured by fMRI).1 The situation is even more complicated when the aging process deviates from normal to abnormal, such as that in the occurrence of white matter hyperintensities (WMH).2 Cerebral oxygen-extraction-fraction (OEF) is an important physiological parameter indexing the brain’s oxygen utilization and thereby energy consumption. Previous studies have demonstrated an age-related increase in OEF in the cortical tissues.3-6 However, there is a paucity of literature on the association of subcortical OEF with aging or white matter lesions. Recently, a novel MRI technique, accelerated-T2-relaxation-under-phase-contrast (aTRUPC), has been developed to measure regional OEF in both cortical and subcortical structures.7 In this work, we used aTRUPC to assess regional OEF in young and older adults, and examined the aging effect on cortical and subcortical OEF. We further investigated the associations between regional OEF and WMH in the older adults.METHODS
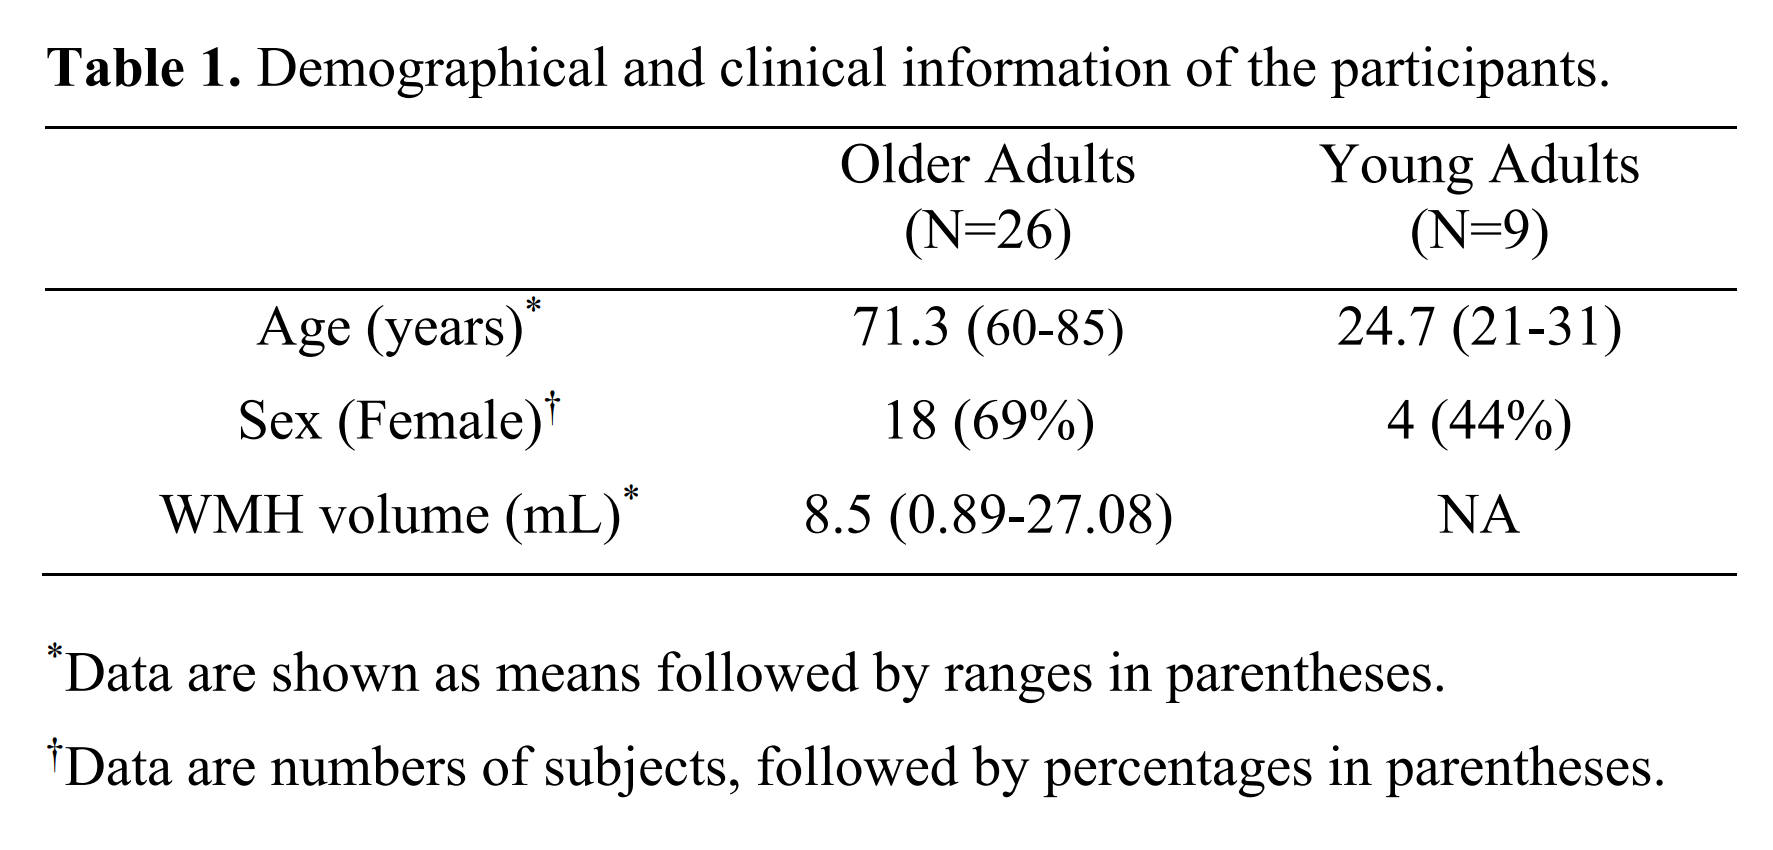
Participants: We studied 9 young adults (aged 21-31 years) and 26 older adults (aged 60-85 years). Table 1 summarizes the demographical and clinical information of the participants. This study was IRB-approved and all participants gave written informed consent.MRI Experiments: All MRI experiments were performed on a 3T Siemens Prisma scanner. On all participants, aTRUPC was acquired to evaluate regional OEF, using the following parameters:7 2D single-slice in the mid-sagittal plane, field-of-view (FoV)=200×200mm2, reconstructed resolution=0.8×0.8mm2, slice thickness=10mm, 3 effective-TEs (eTEs): 0, 40 and 80ms, velocity-encoding=15cm/s, GRAPPA=2, and scan duration=2.1min.
On older subjects, 3D FLAIR and T1-MPRAGE scans were performed to assess WMH. FLAIR used FoV=256×256×176mm3, voxelsize=1×1×1mm3, TR/TI/TE=5000ms/1800ms/388ms, and scan duration=6.5min. T1-MPRAGE used FoV=256×256×176mm3, voxelsize=1×1×1mm3, TR/TI=2530ms/1100ms, and scan duration=5.9min.
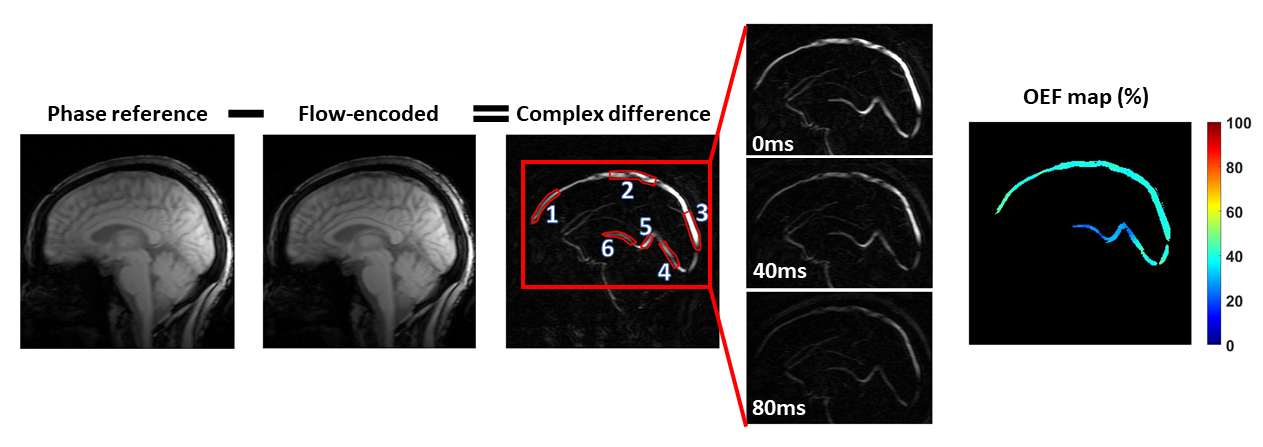
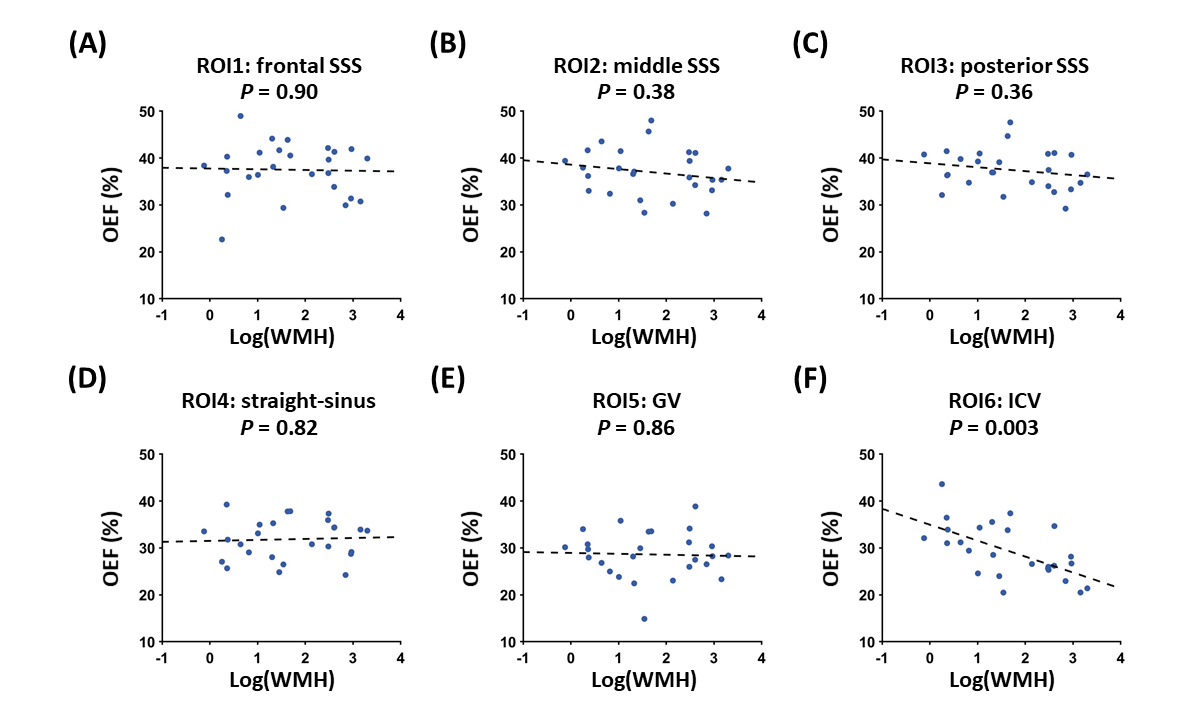
Data Processing: Venous oxygenation (Yv) maps of the major cerebral veins were computed from the aTRUPC data, following procedures in the literature.7 OEF maps were calculated by OEF=(Ya−Yv)/Ya×100%, where the arterial oxygenation Ya was assumed to be 98%. For quantitative analyses, we extracted OEF values from six regions-of-interest (ROIs) placed on cortical and subcortical veins: ROI#1-3 were positioned on the frontal, middle and posterior segments of superior-sagittal-sinus (SSS); ROI#4-6 were placed on the deep veins, i.e., straight-sinus, vein-of-Galen (GV) and internal-cerebral-veins (ICVs), respectively (Figure 1).
The FLAIR and T1-MPRAGE images were processed to obtain the WMH volume using an automatic Bayesian-based algorithm.8
Statistical Analysis:
We first evaluated the aging effect on regional OEF using both the young and elderly data. Linear regression analyses were performed in which OEF of each ROI was the dependent variable and age was the independent variable, with sex as a covariate.
We then examined the association between regional OEF and WMH using the elderly data. The WMH volume was log-transformed, i.e., log(WMH), to reduce the skewness of the WMH data.9 Linear regression analyses were conducted using OEF of each ROI as the dependent variable and log(WMH) as the independent variable, with age and sex as covariates.
RESULTS
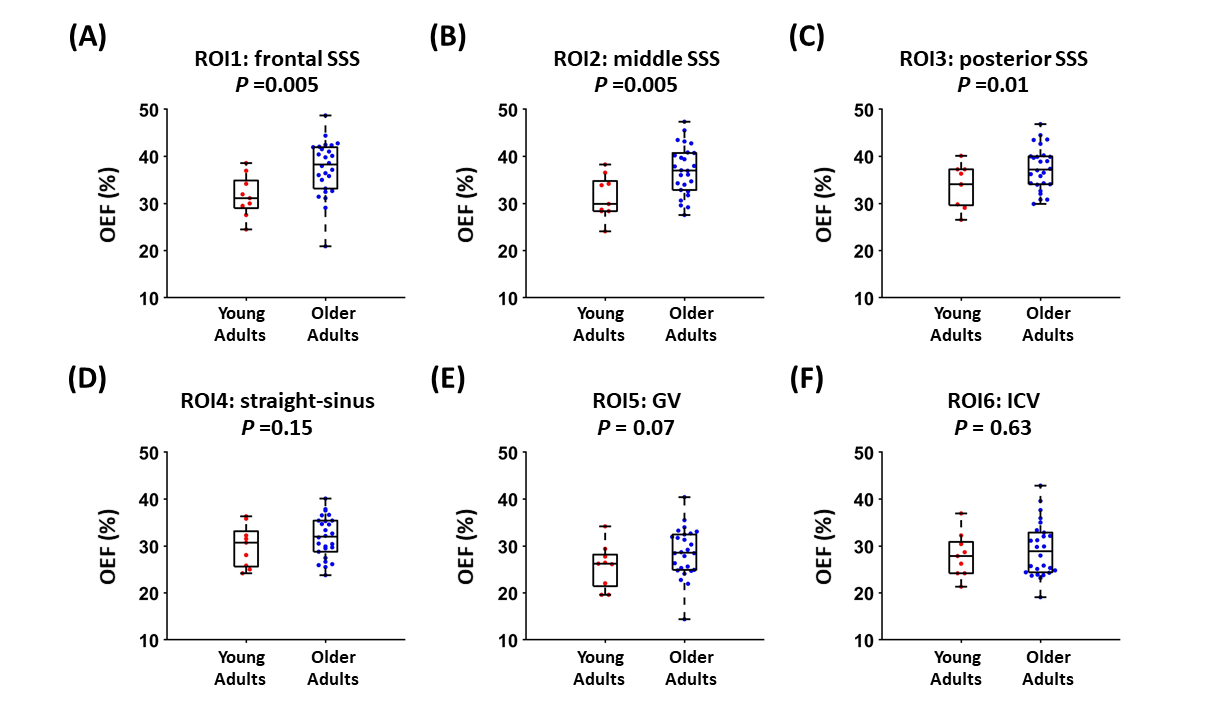
Figure 1 shows representative aTRUPC data of an older adult.Figure 2 illustrates the aging effects on regional OEF. We found significant age-related increases in OEF in the three SSS ROIs (P<0.05), which is consistent with recent studies.3-6 However, there was no significant age effect on OEF in the three deep vein ROIs (P>0.05). Note that SSS drains the cortical tissues while the deep veins drain the subcortical structures.
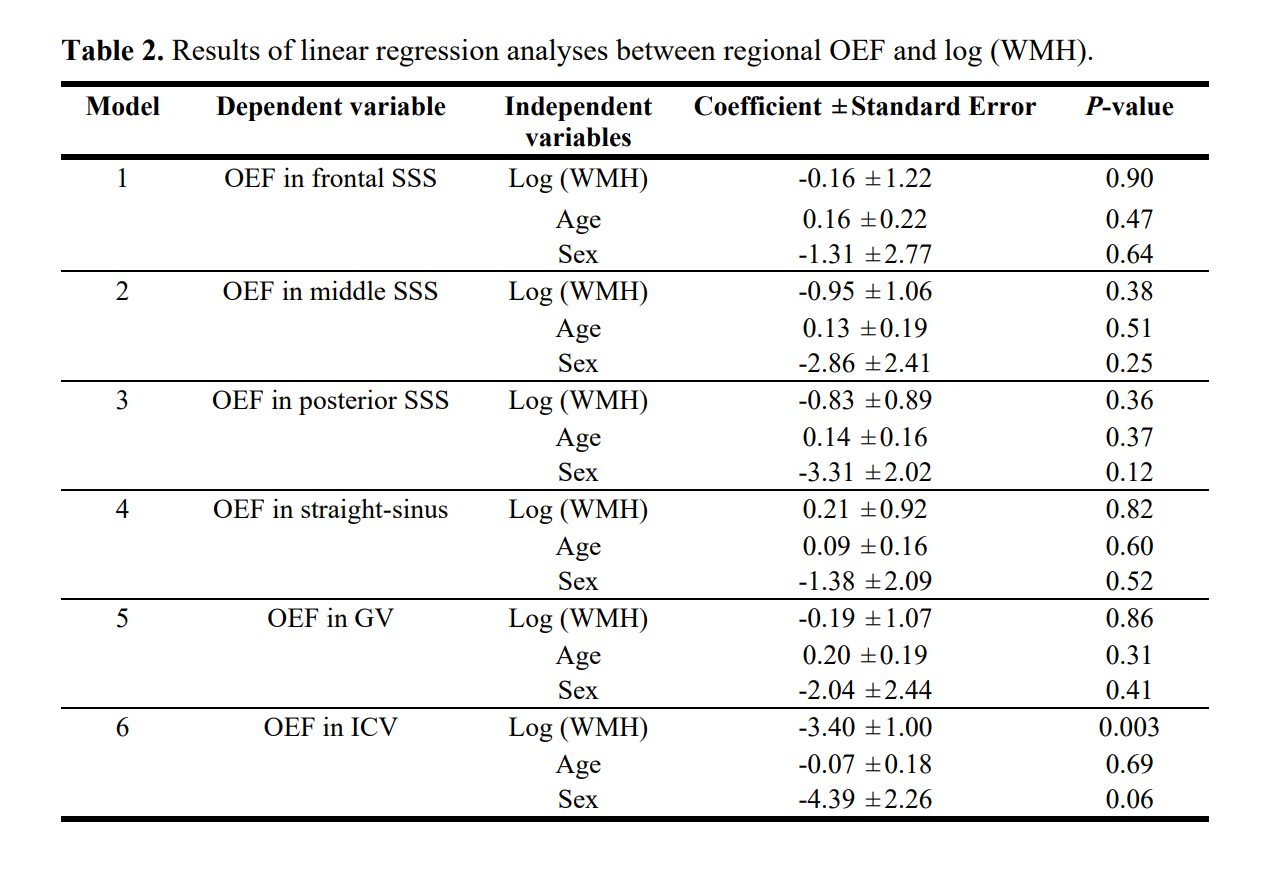
Figure 3 displays the association between regional OEF and WMH. Table 2 summarizes the linear regression results. Interestingly, as shown in Figure 3F, there was a significant inverse correlation between OEF in ICV and log(WMH) (P=0.003). That is, individuals with more white matter lesions had lower OEF in ICV. No significant association was found between log(WMH) and OEF in other ROIs (P>0.3).
DISCUSSION AND CONCLUSION
In this study, we observed significant age-related increase in cortical OEF but not in subcortical OEF, suggesting that aging may have different effects on the tissue metabolism in cortical and subcortical regions. Furthermore, we found a significant inverse correlation of log(WMH) with OEF in ICV, but not with OEF in other ROIs. White matter is known to be partly drained by deep medullary veins. These veins empty into subependymal veins, which finally drain into ICVs.10 This may explain why only OEF in ICV (among all ROIs) was associated with the amount of white matter lesions. The negative correlation we observed can be explained by the notion that the lesioned white matter tissues may have diminished oxygen consumption rate and thus lower OEF. An alternative explanation is that this is an indirect effect, in that white matter damages will result in decreased neural activities in basal-ganglia and thalami (which are connected to the cortices via white matter, and are also drained by ICVs), resulting in lower metabolism and OEF.In summary, OEF of the brain revealed different patterns between cortical and subcortical structures in aging. OEF of the subcortical structure may be more useful in predicting WMH than the cortical OEF.
Acknowledgements
No acknowledgement found.References
1. Sperling RA, Bates JF, Chua EF, Cocchiarella AJ, Rentz DM, Rosen BR, Schacter DL, Albert MS. fMRI studies of associative encoding in young and elderly controls and mild Alzheimer's disease. J Neurol Neurosurg Psychiatry 2003;74:44-50.
2. Prins ND, Scheltens P. White matter hyperintensities, cognitive impairment and dementia: an update. Nat Rev Neurol 2015;11:157-165.
3. Peng SL, Dumas JA, Park DC, Liu P, Filbey FM, McAdams CJ, Pinkham AE, Adinoff B, Zhang R, Lu H. Age-related increase of resting metabolic rate in the human brain. Neuroimage 2014;98:176-183.
4. Lu H, Xu F, Rodrigue KM, Kennedy KM, Cheng Y, Flicker B, Hebrank AC, Uh J, Park DC. Alterations in cerebral metabolic rate and blood supply across the adult lifespan. Cereb Cortex 2011;21:1426-1434.
5. Catchlove SJ, Macpherson H, Hughes ME, Chen Y, Parrish TB, Pipingas A. An investigation of cerebral oxygen utilization, blood flow and cognition in healthy aging. PLoS One 2018;13:e0197055.
6. Aanerud J, Borghammer P, Chakravarty MM et al. Brain energy metabolism and blood flow differences in healthy aging. J Cereb Blood Flow Metab 2012;32:1177-1187.
7. Jiang D, Lu H, Parkinson C, Su P, Wei Z, Pan L, Tekes A, Huisman T, Golden WC, Liu P. Vessel-specific quantification of neonatal cerebral venous oxygenation. Magn Reson Med 2019;82:1129-1139.
8. DeCarli C, Fletcher E, Ramey V, Harvey D, Jagust WJ. Anatomical mapping of white matter hyperintensities (WMH): exploring the relationships between periventricular WMH, deep WMH, and total WMH burden. Stroke 2005;36:50-55.
9. Lin Z, Lim C, Jiang D, Soldan A, Pettigrew C, Oishi K, Zhu Y, Moghekar A, Liu P, Albert M. Longitudinal changes in brain oxygen extraction fraction (OEF) in older adults: Relationship to markers of vascular and Alzheimer's pathology. Alzheimer's & Dementia 2022. doi.
10. Taoka T, Fukusumi A, Miyasaka T, Kawai H, Nakane T, Kichikawa K, Naganawa S. Structure of the Medullary Veins of the Cerebral Hemisphere and Related Disorders. Radiographics 2017;37:281-297.
Figures