0580
ASL spatial coefficient of variance predicts increased white matter hyperintensities volume over time in cognitively unimpaired subjects1Radiology and Nuclear Medicine, Amsterdam UMC, Amsterdam, Netherlands, 2Department of Neurology, Neuroscience Campus Amsterdam, VU University Medical Center, Location VUmc, Alzheimer Center, Amsterdam, Netherlands, 3University College London, Centre for Medical Image Computing (CMIC), London, United Kingdom, 4Institute of Radiopharmaceutical Cancer Research, Helmholtz-Zentrum Dresden-Rossendorf, Dresden, Germany
Synopsis
Keywords: Neurodegeneration, Perfusion, Cerebral blood flow, Dementia
Arterial transit artifacts (ATAs) in arterial spin labeling (ASL) images are common in populations with prolonged arterial transit time (ATT) and may be associated with vascular insufficiency. The spatial coefficient of variance (sCoV) of ASL images can quantify the presence of these artifacts. Vascular insufficiency could contribute to the development of white matter hyperintensities (WMH), a common marker of cerebral small vessel disease. We demonstrated that baseline sCoV of CBF is associated with WMH at baseline and predicts WMH volume change, in a cognitively unimpaired population of 88 subjects.1. Introduction
Arterial transit artifacts (ATAs) in arterial spin labeling (ASL) perfusion MRI images are common in healthy aging and vascularly compromised populations, caused by prolonged arterial transit time (ATT). ATAs reflect delayed arrival of the labeled blood to brain tissue, possibly reflecting vascular insufficiency. Prolonged ATT has been implicated in aging1,2 and in a wide range of neurodegenerative diseases3–5. ATAs can be quantified by the spatial coefficient of variance (sCoV)6 of ASL signal across the gray matter (GM). SCoV was shown to be associated with cognitive decline7.Vascular insufficiency can ultimately lead to cerebral small vessel disease, often assessed by the extent of white matter hyperintensities (WMH). While previous studies have shown a correlation between high sCoV and cognitive decline in an impaired population, its relationship with WMH has not yet been investigated. This study investigated the association between the ASL-sCoV and WMH burden over time in a cognitively unimpaired population. To this end, sCoV values from both total GM and the vascular territories supplied by the anterior (ACA), middle (MCA) and posterior cerebral arteries (PCA) of the brain were determined.2. Methods
2.1. ParticipantsData were drawn from the EMIF-AD PreclinAD8 Twin60++ cohort, a study investigating dementia biomarkers in cognitively unimpaired monozygotic twins. We included 88 participants that had MRI scans both on baseline and after four-year follow-up.
2.2. Image acquisition and processing
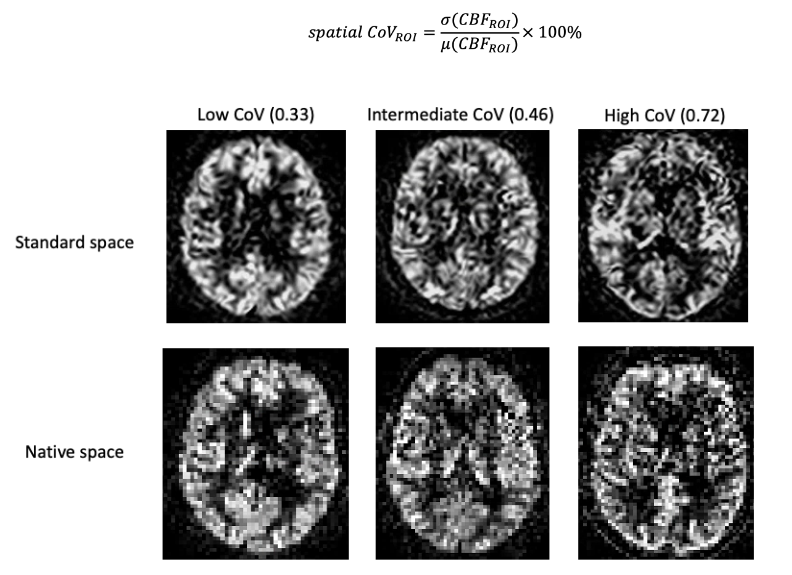
3D T1-weighted, 3D FLAIR scan, and 2D EPI pseudo-continuous ASL images were obtained using a 3T PET-MRI Philips Ingenuity scanner. ASL parameters were: post-labeling delay (PLD) = 2025:38.2:2904 ms (for 23 slices), labeling duration = 1650 ms, 3x3x6 mm3 voxel size, background suppression and a separate M0 scan. Images were processed with ExploreASL9 and visually reviewed for motion and labeling artifacts. The mean GM CBF and sCoV were assessed in the whole brain, and in the vascular territories supplied by the bilateral ACA, MCA, and PCA. Global WMH volume was obtained from the 3D FLAIR scans using the Lesion Segmentation Tool10 2.0.15. sCoV was defined as the standard deviation of CBF divided by the mean CBF within an ROI (Figure 1).
2.3. Statistical analysis
We used linear mixed models (LMMs) to determine the predictive value of baseline sCoV in various ROIs (total GM and vascular territories ACA, MCA, PCA) on WMH volume, adjusted for baseline WMH volume and time. The Akaike information criterion (AIC) was calculated as an estimator of LMM performance. Age at baseline, sex, and twin dependency were accounted for in all analyses. All statistical analyses were performed in R version 3.3.1.
3. Results
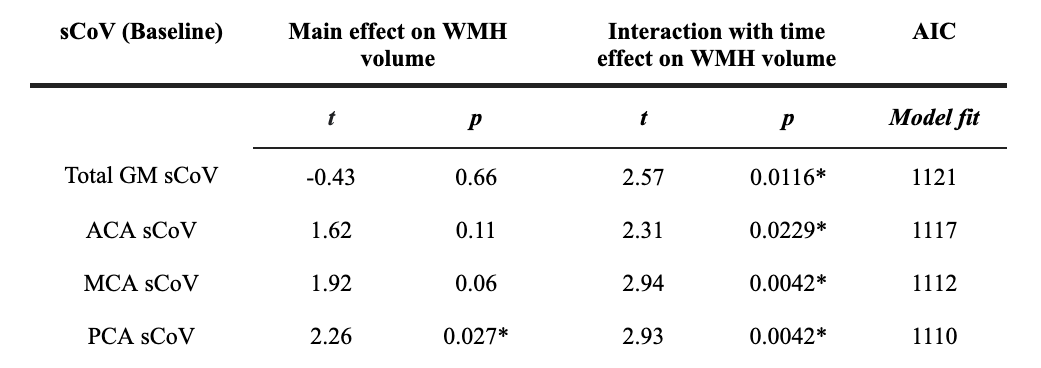
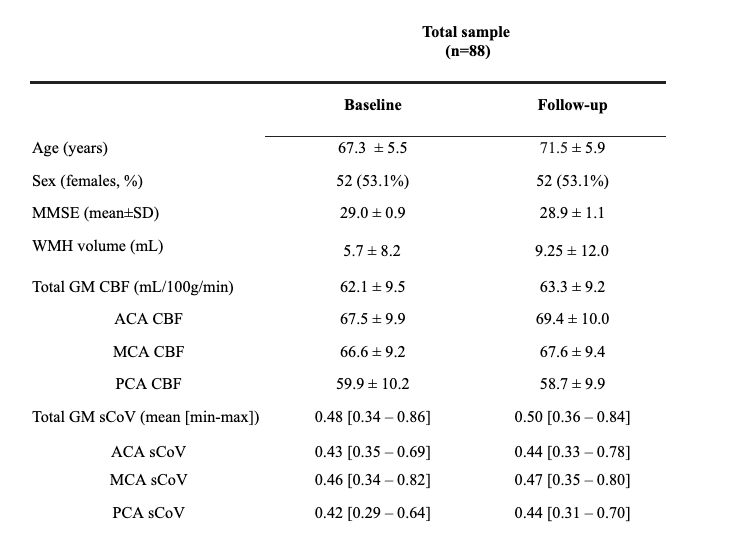
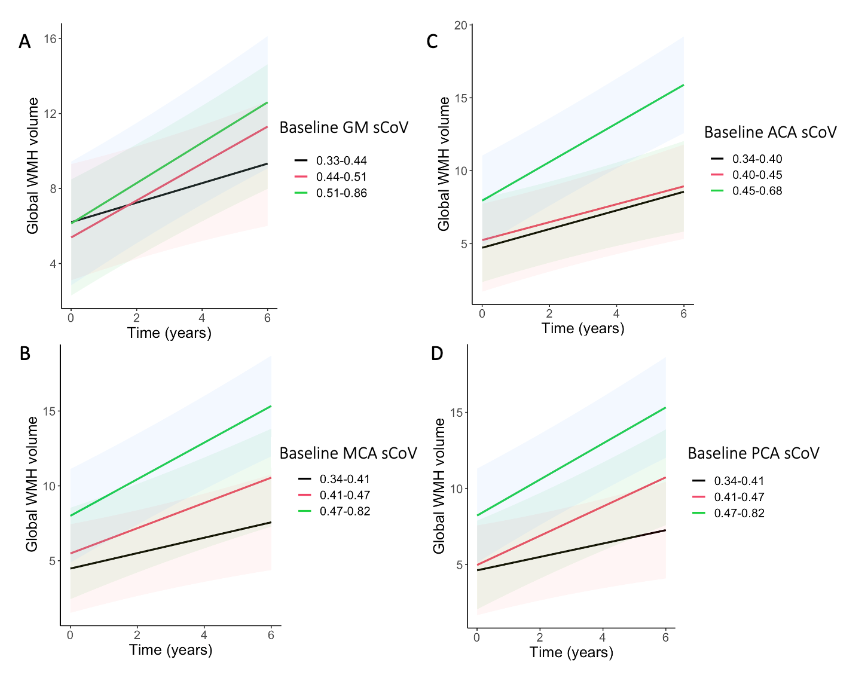
Baseline age was 67.3±5.5 years and 52 (53.1%) were female (Table 1). Mean WMH volume increased (p<0.0001) from baseline (5.7±8.2 mL) to follow-up (9.25±12.0 mL). Only PCA sCoV had a main effect on WMH volume (t=2.24, p=0.027, Table 2). The interaction between sCoV and time was predictive of WMH volume increase (Figure 2), for all ROIs: global GM sCoV (t=2.57, p=0.0116; Figure 2) and sCoV in the individual vascular territories ACA (t=2.31, p=0.0229), MCA (t=2.94, p=0.0042) and PCA (t=2.93, p=0.0042). Additionally, MCA and PCA sCoV as predictors outperformed the global GM sCoV model (∆AIC=9 and ∆AIC=11, respectively).4. Discussion
In a cognitively unimpaired population, we observed that baseline sCoV of ASL in the PCA territory was associated with WMH volume. Moreover, all sCOV ROIs predicted longitudinal WMH volume changes, more strongly in the MCA and PCA, suggesting that vascular territories may differ in their vascular vulnerability.In addition, in line with previous studies that illustrated the importance of regional investigations in an early population to optimize sensitivity1,11,12, we observed that the MCA and PCA sCoV models outperformed the global gray matter sCoV in predicting WMH changes over time. The better performance of the PCA sCoV model compared to the global GM sCoV can be explained by the fact that the posterior circulation is known to have longer ATTs13. This regional finding encourages future studies to investigate if regional sCoV predicts regional WMH. In conclusion, our findings suggest that regional vascular insufficiency in a preclinical population contributes to white matter lesion volume, suggesting that sCoV can be a potential early biomarker of vascular inefficiency.Acknowledgements
No acknowledgement found.References
1. Mutsaerts, H. J. M. M. et al. Cerebral Perfusion Measurements in Elderly with Hypertension Using Arterial Spin Labeling. PLoS One 10, e0133717 (2015).
2. Liu, Y. et al. Arterial spin labeling MRI study of age and gender effects on brain perfusion hemodynamics. Magn. Reson. Med. 68, 912–922 (2012).
3. Al-Bachari, S. et al. Arterial spin labelling reveals prolonged arterial arrival time in idiopathic Parkinson’s disease. Neuroimage Clin 6, 1–8 (2014).
4. Paling, D. et al. Cerebral arterial bolus arrival time is prolonged in multiple sclerosis and associated with disability. J. Cereb. Blood Flow Metab. 34, 34–42 (2014).
5. Mak, H. K. F. et al. Quantitative assessment of cerebral hemodynamic parameters by QUASAR arterial spin labeling in Alzheimer’s disease and cognitively normal Elderly adults at 3-tesla. J. Alzheimers. Dis. 31, 33–44 (2012).
6. Mutsaerts, H. J. et al. The spatial coefficient of variation in arterial spin labeling cerebral blood flow images. J. Cereb. Blood Flow Metab. 37, 3184–3192 (2017).
7. Morgan, C. A. et al. Spatial variation of perfusion MRI reflects cognitive decline in mild cognitive impairment and early dementia. Sci. Rep. 11, 23325 (2021).
8. Konijnenberg, E. et al. The EMIF-AD PreclinAD study: study design and baseline cohort overview. Alzheimers. Res. Ther. 10, 75 (2018).
9. Mutsaerts, H. J. M. M. et al. ExploreASL: An image processing pipeline for multi-center ASL perfusion MRI studies. Neuroimage 219, 117031 (2020).
10. Schmidt, P. et al. An automated tool for detection of FLAIR-hyperintense white-matter lesions in Multiple Sclerosis. Neuroimage 59, 3774–3783 (2012).
11. Steketee, R. M. E. et al. Early-stage differentiation between presenile Alzheimer’s disease and frontotemporal dementia using arterial spin labeling MRI. Eur. Radiol. 26, 244–253 (2016).
12. Sierra-Marcos, A. Regional Cerebral Blood Flow in Mild Cognitive Impairment and Alzheimer’s Disease Measured with Arterial Spin Labeling Magnetic Resonance Imaging. Int. J. Alzheimers. Dis. 2017, 5479597 (2017).
13. Petersen, E. T. et al. The QUASAR reproducibility study, Part II: Results from a multi-center Arterial Spin Labeling test-retest study. Neuroimage 49, 104–113 (2010).
Figures