0578
A Method for Detection of Subtle Blood-Brain Barrier Disruption using Non-Contrast MR Fingerprinting
Emma L Thomson1,2, Elizabeth Powell1, Claudia A M Gandini Wheeler-Kingshott3,4,5, and Geoff J M Parker1,6,7
1Centre for Medical Image Computing, Department of Medical Physics and Biomedical Engineering, University College London, London, United Kingdom, 2UCL Queen Square Institute of Neurology, Faculty of Brain Sciences, London, United Kingdom, 3NMR Research Unit, Queen Square MS Centre, Department of Neuroinflammation, London, United Kingdom, 4Department of Brain & Behavioural Sciences, University of Pavia, Pavia, Italy, 5Brain Connectivity Centre Research Department, IRCCS Mondino Foundation, Pavia, Italy, 6NMR Research Unit, Queen Square MS Centre, Department of Neuroinflammation, UCL Queen Square Institute of Neurology, Faculty of Brain Sciences, London, United Kingdom, 7Bioxydyn Limited, Manchester, United Kingdom
1Centre for Medical Image Computing, Department of Medical Physics and Biomedical Engineering, University College London, London, United Kingdom, 2UCL Queen Square Institute of Neurology, Faculty of Brain Sciences, London, United Kingdom, 3NMR Research Unit, Queen Square MS Centre, Department of Neuroinflammation, London, United Kingdom, 4Department of Brain & Behavioural Sciences, University of Pavia, Pavia, Italy, 5Brain Connectivity Centre Research Department, IRCCS Mondino Foundation, Pavia, Italy, 6NMR Research Unit, Queen Square MS Centre, Department of Neuroinflammation, UCL Queen Square Institute of Neurology, Faculty of Brain Sciences, London, United Kingdom, 7Bioxydyn Limited, Manchester, United Kingdom
Synopsis
Keywords: Neurodegeneration, Blood vessels
Using magnetic resonance fingerprinting (MRF), we propose a method for regional quantification of blood volume (νb) and BBB water exchange (by quantifying capillary water residence time, τb), as a metric of BBB function/dysfunction. A single axial slice was acquired for seven healthy volunteers using an MRF SPGR sequence. Matching to a precomputed dictionary was performed to simultaneously quantify intra and extravascular T1, B1+, νb, and τb. Initial findings in volunteers show that it is possible to quantify these five parameters simultaneously. Our results show promise for patient studies of blood-brain barrier disruption.Introduction
Disruption to the blood brain barrier (BBB) is seen in a wide range of neurological diseases, such a multiple sclerosis and Alzheimer's disease.1 Early-stage imaging of this disruption may help the diagnosis and monitoring of disease progression, as well as localisation of disease origin. There are many proposed solutions to the detection of breakdown of the BBB using MRI. Currently the most commonly-applied imaging method, dynamic contrast enhanced MRI (DCE-MRI)2, requires a gadolinium-based contrast agent (GBCA) and is only viable for quantifying severe damage as it measures the exchange of the relatively large contrast agent over the barrier: it is known to suffer from poor sensitivity and a low signal-to-noise ratio (SNR) when trying to assess subtle damage.3,4,5 Arterial spin labelling (ASL) methods use the measurement of water exchange over the BBB to probe less profound damage6, but often suffer from low SNR. We propose utilising the robustness to noise of magnetic resonance fingerprinting (MRF)7 to implement a novel non-contrast method for the regional quantification of blood volume ( $$$\nu_b$$$) and BBB water exchange (by quantifying capillary water residence time, $$$\tau_b$$$), as a metric of BBB function/dysfunction simultaneously with the intra and extravascular $$$T_1$$$, and inhomogeneities in the $$$B_1$$$ field using an RF-spoiled gradient echo MRF acquisition. A small-scale healthy volunteer study was performed to demonstrate this application in vivo.Methods
An array of spin isochromats was simulated assuming a two-site exchange system of intra and extravascular compartments, with defined compartmental volumes and a semipermeable barrier mimicking the BBB. The Bloch equations were used to simulate signals arising from this array during the magnetisation evolution over time. Signal 'fingerprints' were generated for an RF-spoiled gradient echo acquisition by varying input flip angle ($$$\alpha$$$) and repetition time ($$$TR$$$), while assuming a short and unvarying $$$TE$$$ = 2 ms. A ‘dictionary’ of signals was generated with a variation of blood volume from 1 to 10% in steps of 0.5%, denoted $$$\nu_b$$$([1:0.5:10]%), with residence time of water in the intravascular compartment, $$$\tau_b$$$([200:100:1600]ms), T1 of the intravascular compartment: $$$T_{1,b}$$$( [1500:200:1900]ms), T1 of the extravascular compartment: $$$T_{1,e}$$$( [600:70:2000]ms), and field inhomogeneity $$$B_1^+$$$( [0.5:0.05:1.2]).Seven healthy volunteers (23-30 years old, 4 male) were scanned on a 3T Philips Ingenia system using a T1-fast field echo (T1-FFE, RF-spoiled gradient echo) acquisition with an MRF sequence of 2000 $$$TR$$$ periods, FOV = 224 mm x 244 mm, reconstruction matrix = 64 x 64, slice thickness = 5 mm (giving a voxel size of 3.5 x 3.5 x 5 mm3), $$$TE$$$= 2 ms, fully sampled variable density spiral readout, SPIR fat saturation, IR pulse for CSF suppression, with $$$\alpha$$$ and $$$TR$$$ variation as outlined in Figure 1a. Total MRF acquisition time was 19 minutes. A single central axial slice was acquired, which was segmented and masked using $$$T_1$$$-w and $$$T_2$$$-w images.8,9,10 Regional segmentations were performed through registration to the Harvard-Oxford cortical and subcortical structural atlases.11,12,13,14 Repeat scans were performed for all subjects within the same session as the initial scan after repositioning of the subject. Matching was performed voxel-wise between the simulated dictionary and experimental data was performed using the inner-point method,7 after which regional averages were taken. Repeatability assessment involved generation of Bland-Altman plots and calculation of the repeatability coefficient (RC).19
Results
Figure 1 shows the flip angle and $$$TR$$$ variation used, and example of a fingerprint match with a white matter voxel. Plots of parameter maps of $$$T_{1,e}$$$, $$$T_{1,b}$$$, $$$B_1^+$$$, $$$\nu_b$$$, and $$$\tau_b$$$ for each volunteer with alongside the repeat scan can be seen in Figure 2. Across the seven subjects, mean $$$T_{1,e}$$$ values for white/grey matter were found to be $$$[780\pm60] / [1000\pm100]$$$ ms, for $$$T_{1,b}$$$: $$$[1740\pm30] / [1700\pm100]$$$ ms, for $$$\nu_b$$$ : $$$[2.4\pm0.6] / [4\pm1]$$$ %, and for $$$\tau_b$$$: $$$[600\pm100] / [600\pm300]$$$ ms. Bland-Altman plots in Figure 3 show the repeatability for two regions, left cerebral white matter (RC[$$$T_{1,e}$$$]:35 ms, RC[$$$T_{1,b}$$$]:60 ms, RC[$$$\nu_{b}$$$]:0.7 %, RC[$$$\tau_{b}$$$]:183 ms) and the occipital pole (RC[$$$T_{1,e}$$$]:114 ms, RC[$$$T_{1,b}$$$]:92 ms, RC[$$$\nu_{b}$$$]:2.7 %, RC[$$$\tau_{b}$$$]:370 ms); negligible bias is observed between measurements. A complete set of means and repeatability coefficients for all regions present can be seen in Table 1. Generally good repeatability is observed in all regions.Discussion
This is the first demonstration of MRF methods to provide regional mapping of BBB water exchange. Maps of residence time, $$$\tau_b$$$ provide values that are consistent with literature values18 and show good inter-subject agreement. Differences between white and grey matter $$$T_{1,e}$$$ and $$$\nu_b$$$ are observed, with no differences seen in $$$T_{1,b}$$$ or $$$\tau_b$$$. $$$T_{1,e}$$$ values are lower than expected at 3T but are consistent with results seen when slice profile is not accounted for in the dictionary simulations15,16. Blood volume is slightly underestimated for both white and grey matter, but broadly falls within the expected range17. Good repeatability is seen between parameters.Conclusion
Our initial findings in healthy volunteers suggest that it is feasible to quantify regional blood volume and residence time, simultaneously with $$$T_{1,e}$$$, $$$T_{1,b}$$$, and $$$B_1^+$$$ using an SPGR MRF acquisition within a reasonable scan time. Our approach holds promise for patient-based measurements of subtle disruption.Acknowledgements
This work is supported by the EPSRC-funded UCL Centre for Doctoral Training in Intelligent, Integrated Imaging in Healthcare (i4health) (EP/S021930/1), the Department of Health’s NIHR-funded Biomedical Research Centre at University College London Hospitals and by EPSRC grant EP/S031510/1. The authors wish to thank Dr. David Higgins of Philips Healthcare and Julia Markus for their help implementing this work in vivo.References
- Zlokovic BV. The blood-brain barrier in health and chronic neurodegenerative disorders. Neuron. 2008;57:178-20.
- Tofts PM, Kermode AG. Measurement of the blood-brain barrier permeability and leakagespace using dynamic MR imaging. Magnetic Resonance in Medicine. 1991;17:357-367
- Barbier EL, St Lawrence KD, Grillon E et al. A model of blood–brain barrier permeability to water: Accountingfor blood inflow and longitudinal relaxation effects. Magnetic Resonance in Medicine. 2002; 47:1100-1109
- Starr JM, Farrall AJ, Armitage P, et al. Blood-brain barrier permeability in Alzheimer’s disease: A case-control MRI study. Neuroimaging. 2009;171:232-242
- van de Haar HJ, Burgmans S, Jansen JFA, et al. Blood-brain barrier leakage in patients with early Alzheimer disease. Radiology. 2016;281:527-535
- Parkes LM, Tofts PS. Improved Accuracy of Human Cerebral Blood Perfusion Measurements Using Arterial Spin Labeling: Accounting for Capillary Water Permeability. Magnetic Resonance in Medicine. 2002;48:27-41
- Ma D, Gulani V, Seiberlich N, et al. Magnetic Resonance Fingerprinting, Nature. 2013;495:187–192.
- Zhang, Y, Brady M, Smith SA. Segmentation of Brain MR Images through a Hidden Markov Random Field Model and the Expectation Maximization Algorithm. IEEE Trans Med Imag, 2001;20(1):45-57
- Jenkinson M, Smith SM. A global optimisation method for robust affine registration of brain images. Medical Image Analysis, 2001;5(2):143-156
- Jenkinson M, Bannister PR, Brady JM, Smith SM. Improved optimisation for the robust and accurate linear registration and motion correction of brain images. NeuroImage, 2002;17(2):825-841
- Makris N, Goldstein JM, Kennedy D, et al. Decreased volume of left and total anterior insular lobule in schizophrenia. Schizophr Res. 2006 Apr;83(2-3):155-71
- Frazier JA, Chiu S, Breeze JL, et al. Structural brain magnetic resonance imaging of limbic and thalamic volumes in pediatric bipolar disorder. Am J Psychiatry. 2005 Jul;162(7):1256-65
- Desikan RS, Ségonne F, Fischl B, et al. An automated labeling system for subdividing the human cerebral cortex on MRI scans into gyral based regions of interest. Neuroimage. 2006 Jul 1;31(3):968-80.
- Goldstein JM, Seidman LJ, Makris N, et al. Hypothalamic abnormalities in schizophrenia: sex effects and genetic vulnerability. Biol Psychiatry. 2007 Apr 15;61(8):935-45
- Wang J, Mao W, Qiu M, et al. Factors influencing flip angle mapping in MRI: RF pulse shape, slice-select gradients, off- resonance excitation, and B0 inhomogeneities. Magn Reson Med 2006;56:463–468
- Wansapura JP, Holland SK, Dunn RS, et al. NMR Relaxation Times in the Human Brain at 3.0 Tesla. Journal of magnetic Resonance Imaging. 1999;9:531-538
- Dickie BR, Parker GJM, Parkes LM. Measuring water exchange across the blood-brain barrier using MRI. Progress in Nuclear Magnetic Resonance Spectroscopy 2020;116:19–39
- Grubb RL, Raichle ME, Higgins CS, Eichling JO. Measurement of regional cerebral blood volume by emission tomography. Annals of Neurology. 1978;4:322-328
- Vas S, Falkmer T, Passmore AE, et al. The Case for Using the Repeatability Coefficient When Calculating Test-Retest Reliability. 2013;PLoS ONE 8(9): e73990
Figures
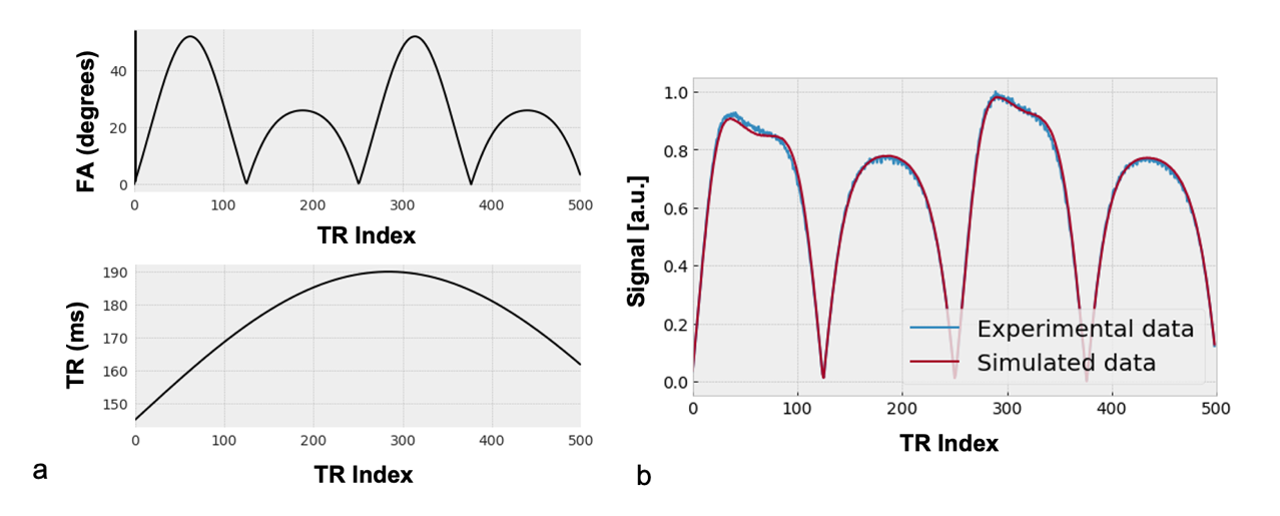
Figure 1: (a) Partial visualisation of variations in flip angle (FA) and repetition time (TR) used (this variation repeats for the remaining acquisitons). The signals generated by these variations are matched to a precomputed dictionary. (b) An example matched signal from a white matter voxel. [T1,e:810 ms, T1,b:1900 ms. B1+: 1.0, νb: 2 %, and τb:1000 ms]
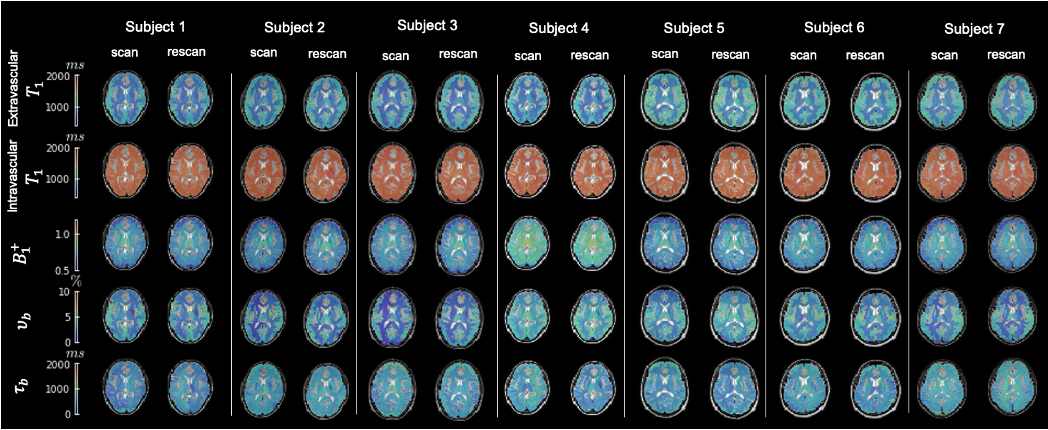
Figure 2: Regional quantitative parameter maps of T1,e, T1,b, B1+, νb, and τb for all volunteers with repeat scan. Good inter- and intra- subject agreement is seen across all scans and all parameters.
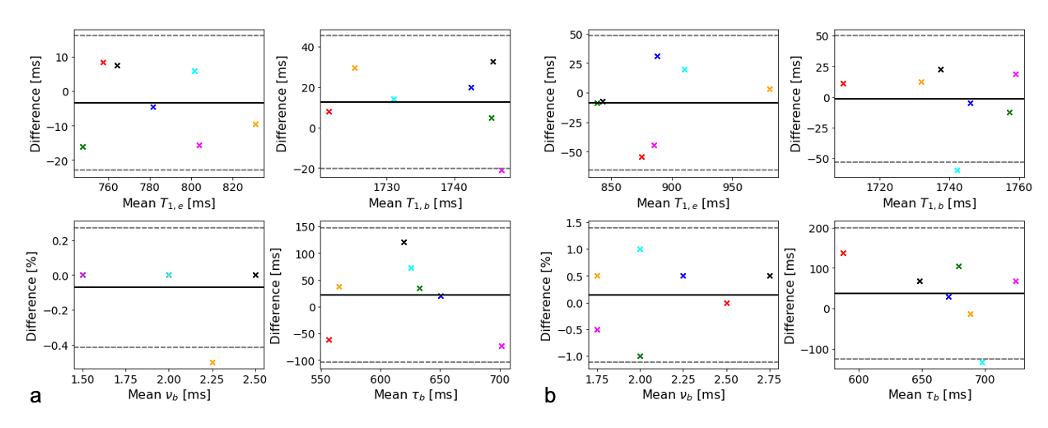
Figure 3: Bland-Altman plot comparing repeat measurements for T1,e, T1,b, νb, and τb for two regions (a) left cerebral white matter, and (b) the occipital pole. For a complete set of repeatability measurements see the table in Table 1. Marker colour is consistent across plots for each volunteer. Solid black line indicates mean difference between scan/rescan, with the 95% confidence intervals shown with dotted lines.
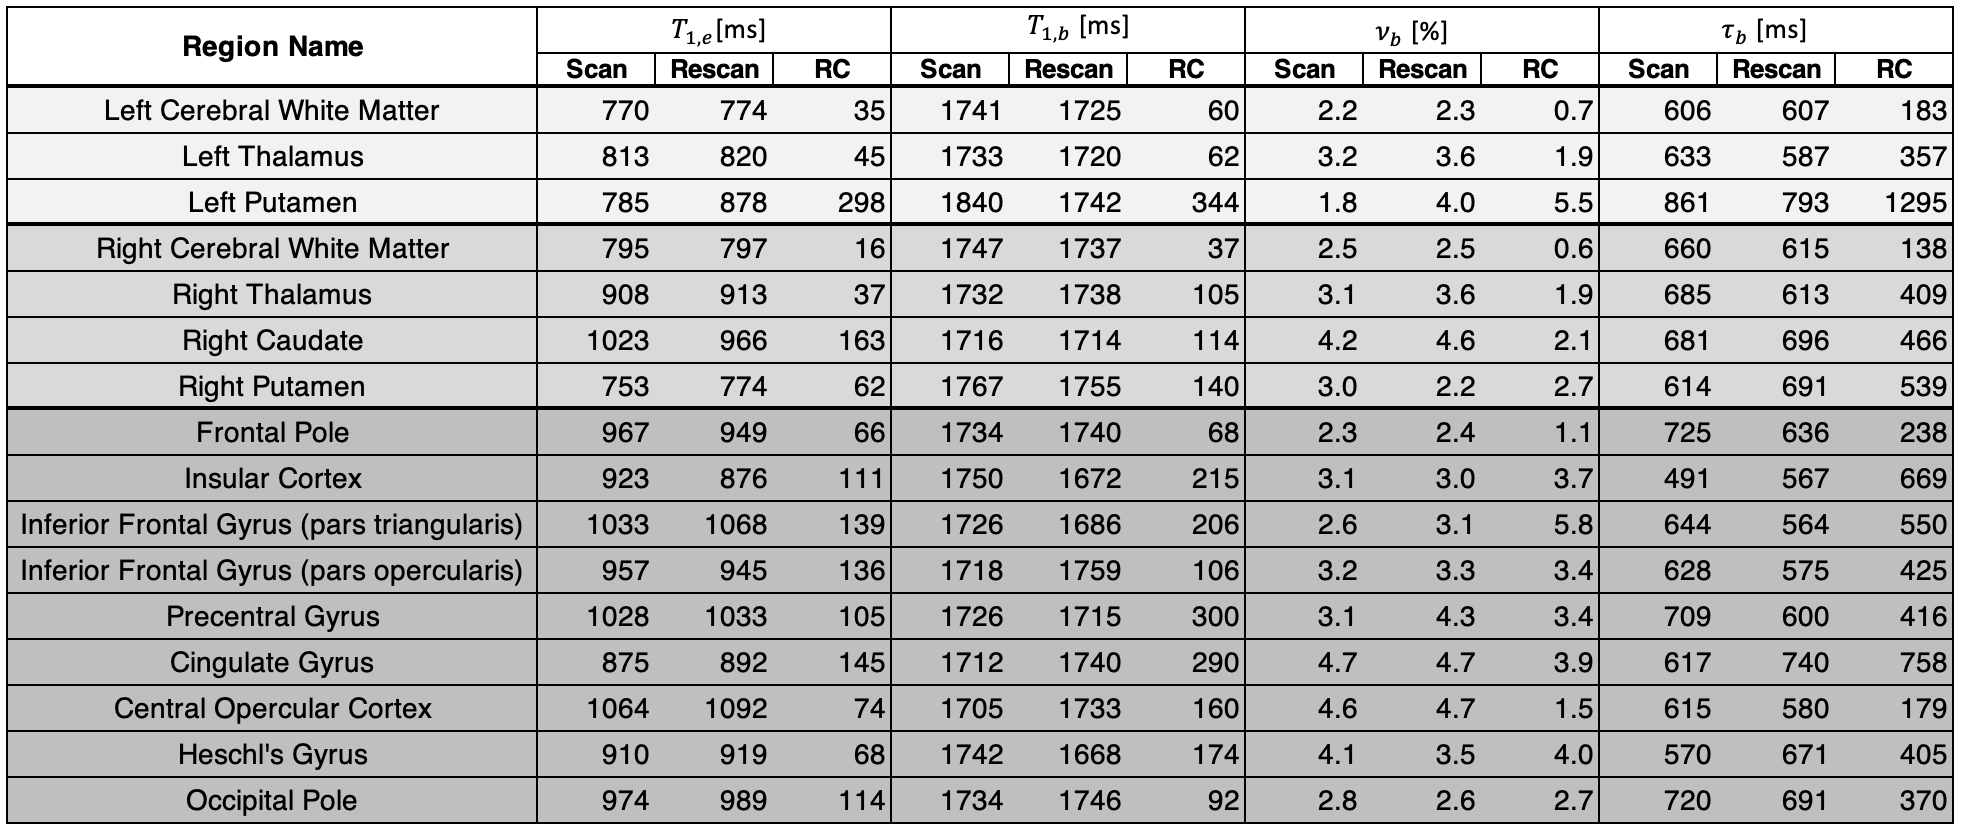
Table 1: Means for the scan and rescan maps across all volunteers for the four parameters of interest, along with their repeatability coefficients (RC). Left subcortical, right subcortical, and cortical regions are separated by background colour. A region was only included if it was present in all volunteer scans.
DOI: https://doi.org/10.58530/2023/0578