0574
7T MRI Reveals Abnormal Iron Deposition and Microstructure in Premanifest and Manifest Huntington’s Disease1Department of Radiology and Biomedical Imaging, University of California, San Francisco, San Francisco, CA, United States, 2UCSF/UCB Graduate Program in Bioengineering, University of California, San Francisco, San Francisco, CA, United States, 3Department of Neurology, University of California, San Francisco, San Francisco, CA, United States
Synopsis
Keywords: Neurodegeneration, Neurodegeneration, Huntington's disease, Movement disorder
We used QSM and DTI at 7T to investigate iron dysregulation and microstructure disruption in subcortical regions in Huntington’s disease (HD). We observed significant volume loss and increased iron deposition in the striatum and globus pallidus, and increased FA in the striatum. The deep cerebellar nuclei (dentate nuclei) showed a unique transient increase in volume and susceptibility in premanifest patients, implicating it as a new marker of HD disease progression that is sensitive to the pre-symptomatic window of HD. We also found varying relationships between imaging features in different brain regions, warranting further analyses of subregional changes.Background
Huntington’s disease (HD) is a monogenic neurodegenerative disorder caused by CAG repeat expansion in the huntingtin gene. Currently, the evaluation of disease burden mainly relies on age and CAG repeat length, which are insufficient to explain the significant variability in clinical manifestation1. Robust imaging biomarkers are therefore desired to monitor disease progression and assess treatment efficacy before the symptom onset. Quantitative susceptibility mapping (QSM) has been reported to reveal abnormal iron deposition in the striatum and globus pallidus in premanifest (PM) and manifest HD2, whereas changes in diffusion tensor imaging (DTI) have been shown to reflect increased microstructural organization despite neuronal degeneration in these regions3. This study aimed to leverage the improved sensitivity at ultra-high field along with QSM and DTI to investigate the interplay between iron dysregulation and microstructure alterations in subcortical regions with HD progression.Methods
SubjectsWe prospectively recruited 33 healthy volunteers (HC: 43.9±12.2yr), 14 PM (38.0±11.0yr), and 20 manifest HD patients (48.9±12.4yr). Among them, 2 HC and 13 HD patients were evaluated twice at one-year intervals. The premanifest patients were further divided into two groups based on year to onset (YTO)4 (far:>15yr; near:<15yr).
MRI acquisition and processing
Subjects were scanned on a GE 7T scanner with a 32-channel receive coil. QSM utilized a 3D multi-echo GRE sequence with TEs=6.0/9.5/13/16.5ms, TR=50ms, FA=20°, FOV=240x240x148mm, ARC R=3, and 0.8x0.8x1.0mm resolution. The raw coil images were combined using MCPC-3D-S5, processed for QSM reconstruction6,7 (Fig.1), and normalized to the lateral ventricle. DTI data were acquired with 90 directions (30 at b=1000s/mm, 60 at b=2000s/mm), TE/TR=72/4000ms, 1.0x1.0x2.0mm resolution, and FOV=256x256x120mm. We performed top-up and eddy current correction, then generated fractional anisotropy (FA) and mean diffusivity (MD) maps using FSL8.
Image postprocessing
QSM and DTI images were aligned to the subject’s T1-weighted image8, which were then co-registered to an MNI template using ANTS transformations9. The resulting transformations were applied to warp each subject’s map to MNI space, and inversely warp the subcortical segmentation atlases10,11 to each subject’s space (Fig.1), generating eight subcortical segmentations: caudate nucleus (CN), putamen (PU), globus pallidus externus/interna (GPe/GPi), thalamus (TH), red nucleus (RN), substantia nigra (SN), and dentate nucleus (DN). All masks were inspected and manually edited if necessary.
Data Analysis
Volumes normalized by total intracranial volume, median values of susceptibility, FA, and MD were quantified for each subcortical ROI. Volume and susceptibility were further age-corrected using healthy volunteers. The imaging metrics were compared across HC, PM far, PM near, and manifest HD using Kruskal-Wallis analyses. Voxel-wise comparisons were performed while controlling for age and sex. We used paired t-tests to compare baseline and follow-up volumes and susceptibilities and performed Pearson correlations among imaging features. Benjamini-Hochberg procedure was used to correct multiple statistics.
Results
Cross-sectional comparisonsHigher susceptibility was observed in CN, PU, and GP across all HD groups (Fig.2(A)), which preceded atrophy. In SN and DN, higher susceptibility was detected in the PM but not in manifest HD, indicating transient iron deposition in these regions. Significant volume loss was found in HD patients in CN, PU, and GP (Fig.2(B)). DN volume was increased in PM and subsequently normalized in manifest HD. FA in CN and PU was elevated in manifest HD patients, albeit in different locations where increased susceptibility was observed in voxel-wise analysis (Fig.2(E,F)).
Longitudinal analysis
Longitudinal analysis showed increasing susceptibility with decreasing volume in the CN across different HD stages (Fig.3(A)), whereas decreasing susceptibility and volume were observed in the DN of PM patients near onset (Fig.3(B)).
Correlations between imaging biomarkers
Volume and susceptibility were negatively correlated in CN, PU, and GPe, and positively correlated in DN (Fig.4). A similar relationship was found between volume and FA. Positive correlations were observed between susceptibility and FA in CN, PU, GPe, and DN, while significantly negative correlations were found between FA and MD in most ROIs, except for CN and DN.
Discussion & Conclusion
Significant increasing iron accumulation followed by atrophy near the onset of symptoms in the CN, PU, and GP, and increased striatal FA, was consistent with previous literature findings3,4. Atrophy and increased iron accumulation were correlated in the striatum and GP. We also found a positive correlation between subject-wise susceptibility and FA and a weak negative correlation in voxel-wise analysis (data not shown). One possibility of this discrepancy is that different subregions may undergo different pathological changes. Voxel-wise comparison maps (Fig.2) illustrated subregional differences in susceptibility and FA changes, especially in the PU, warranting future subregional analyses in this population.We also reported a unique transient increase of volume and susceptibility in DN in premanifest HD, which was further confirmed in longitudinal and correlation analyses, indicating a novel potential imaging marker sensitive to the pre-symptomatic time window of HD. In light of these observations, this could be due to either: (1) the enlarged volume and elevated iron levels in the DN representing a compensatory role of the DN before symptom onset; or (2) inflammation/trans-synaptic degeneration induced DN swelling and iron accumulation marking the initiation of DN function failure, eventually contributing to symptom onset. Further functional and structural analyses of DN in HD are needed to explain the role of the DN in HD progression.
Acknowledgements
No acknowledgement found.References
- Rosenblatt A, Liang KY, Zhou H, Abbott MH, Gourley LM, Margolis RL, Brandt J, Ross CA. The association of CAG repeat length with clinical progression in Huntington disease. Neurology. 2006 Apr 11;66(7):1016-20. doi: 10.1212/01.wnl.0000204230.16619.d9. PMID: 16606912.
- Ravanfar P, Loi SM, Syeda WT, Van Rheenen TE, Bush AI, Desmond P, Cropley VL, Lane DJR, Opazo CM, Moffat BA, Velakoulis D, Pantelis C. Systematic Review: Quantitative Susceptibility Mapping (QSM) of Brain Iron Profile in Neurodegenerative Diseases. Front Neurosci. 2021 Feb 18;15:618435. doi: 10.3389/fnins.2021.618435. PMID: 33679303; PMCID: PMC7930077.
- Estevez-Fraga C, Scahill R, Rees G, Tabrizi SJ, Gregory S. Diffusion imaging in Huntington's disease: comprehensive review. J Neurol Neurosurg Psychiatry. 2020 Oct 8;92(1):62–9. doi: 10.1136/jnnp-2020-324377. Epub ahead of print. PMID: 33033167; PMCID: PMC7803908.
- Langbehn DR, Brinkman RR, Falush D, Paulsen JS, Hayden MR; International Huntington's Disease Collaborative Group. A new model for prediction of the age of onset and penetrance for Huntington's disease based on CAG length. Clin Genet. 2004 Apr;65(4):267-77. doi: 10.1111/j.1399-0004.2004.00241.x. Erratum in: Clin Genet. 2004 Jul;66(1):81. PMID: 15025718.
- Eckstein K, Dymerska B, Bachrata B, Bogner W, Poljanc K, Trattnig S, Robinson SD. Computationally Efficient Combination of Multi-channel Phase Data From Multi-echo Acquisitions (ASPIRE). Magn Reson Med. 2018 Jun;79(6):2996-3006. doi: 10.1002/mrm.26963. Epub 2017 Oct 16. PMID: 29034511.
- Li W, Wu B, Liu C. Quantitative susceptibility mapping of human brain reflects spatial variation in tissue composition. Neuroimage. 2011 Apr 15;55(4):1645-56. doi: 10.1016/j.neuroimage.2010.11.088. Epub 2011 Jan 9. PMID: 21224002; PMCID: PMC3062654.
- Li W, Wang N, Yu F, Han H, Cao W, Romero R, Tantiwongkosi B, Duong TQ, Liu C. A method for estimating and removing streaking artifacts in quantitative susceptibility mapping. Neuroimage. 2015 Mar;108:111-22. doi: 10.1016/j.neuroimage.2014.12.043. Epub 2014 Dec 20. PMID: 25536496; PMCID: PMC4406048.
- Jenkinson M, Beckmann CF, Behrens TE, Woolrich MW, Smith SM. FSL. Neuroimage. 2012 Aug 15;62(2):782-90. doi: 10.1016/j.neuroimage.2011.09.015. Epub 2011 Sep 16. PMID: 21979382.
- Avants BB, Tustison NJ, Song G, Cook PA, Klein A, Gee JC. A reproducible evaluation of ANTs similarity metric performance in brain image registration. Neuroimage. 2011 Feb 1;54(3):2033-44. doi: 10.1016/j.neuroimage.2010.09.025. Epub 2010 Sep 17. PMID: 20851191; PMCID: PMC3065962.
- Xiao Y, Fonov V, Chakravarty MM, Beriault S, Al Subaie F, Sadikot A, Pike GB, Bertrand G, Collins DL. A dataset of multi-contrast population-averaged brain MRI atlases of a Parkinson׳s disease cohort. Data Brief. 2017 Apr 15;12:370-379. doi: 10.1016/j.dib.2017.04.013. PMID: 28491942; PMCID: PMC5413210.
- Diedrichsen J, Maderwald S, Küper M, Thürling M, Rabe K, Gizewski ER, Ladd ME, Timmann D. Imaging the deep cerebellar nuclei: a probabilistic atlas and normalization procedure. Neuroimage. 2011 Feb 1;54(3):1786-94. doi: 10.1016/j.neuroimage.2010.10.035. Epub 2010 Oct 18. PMID: 20965257.
Figures
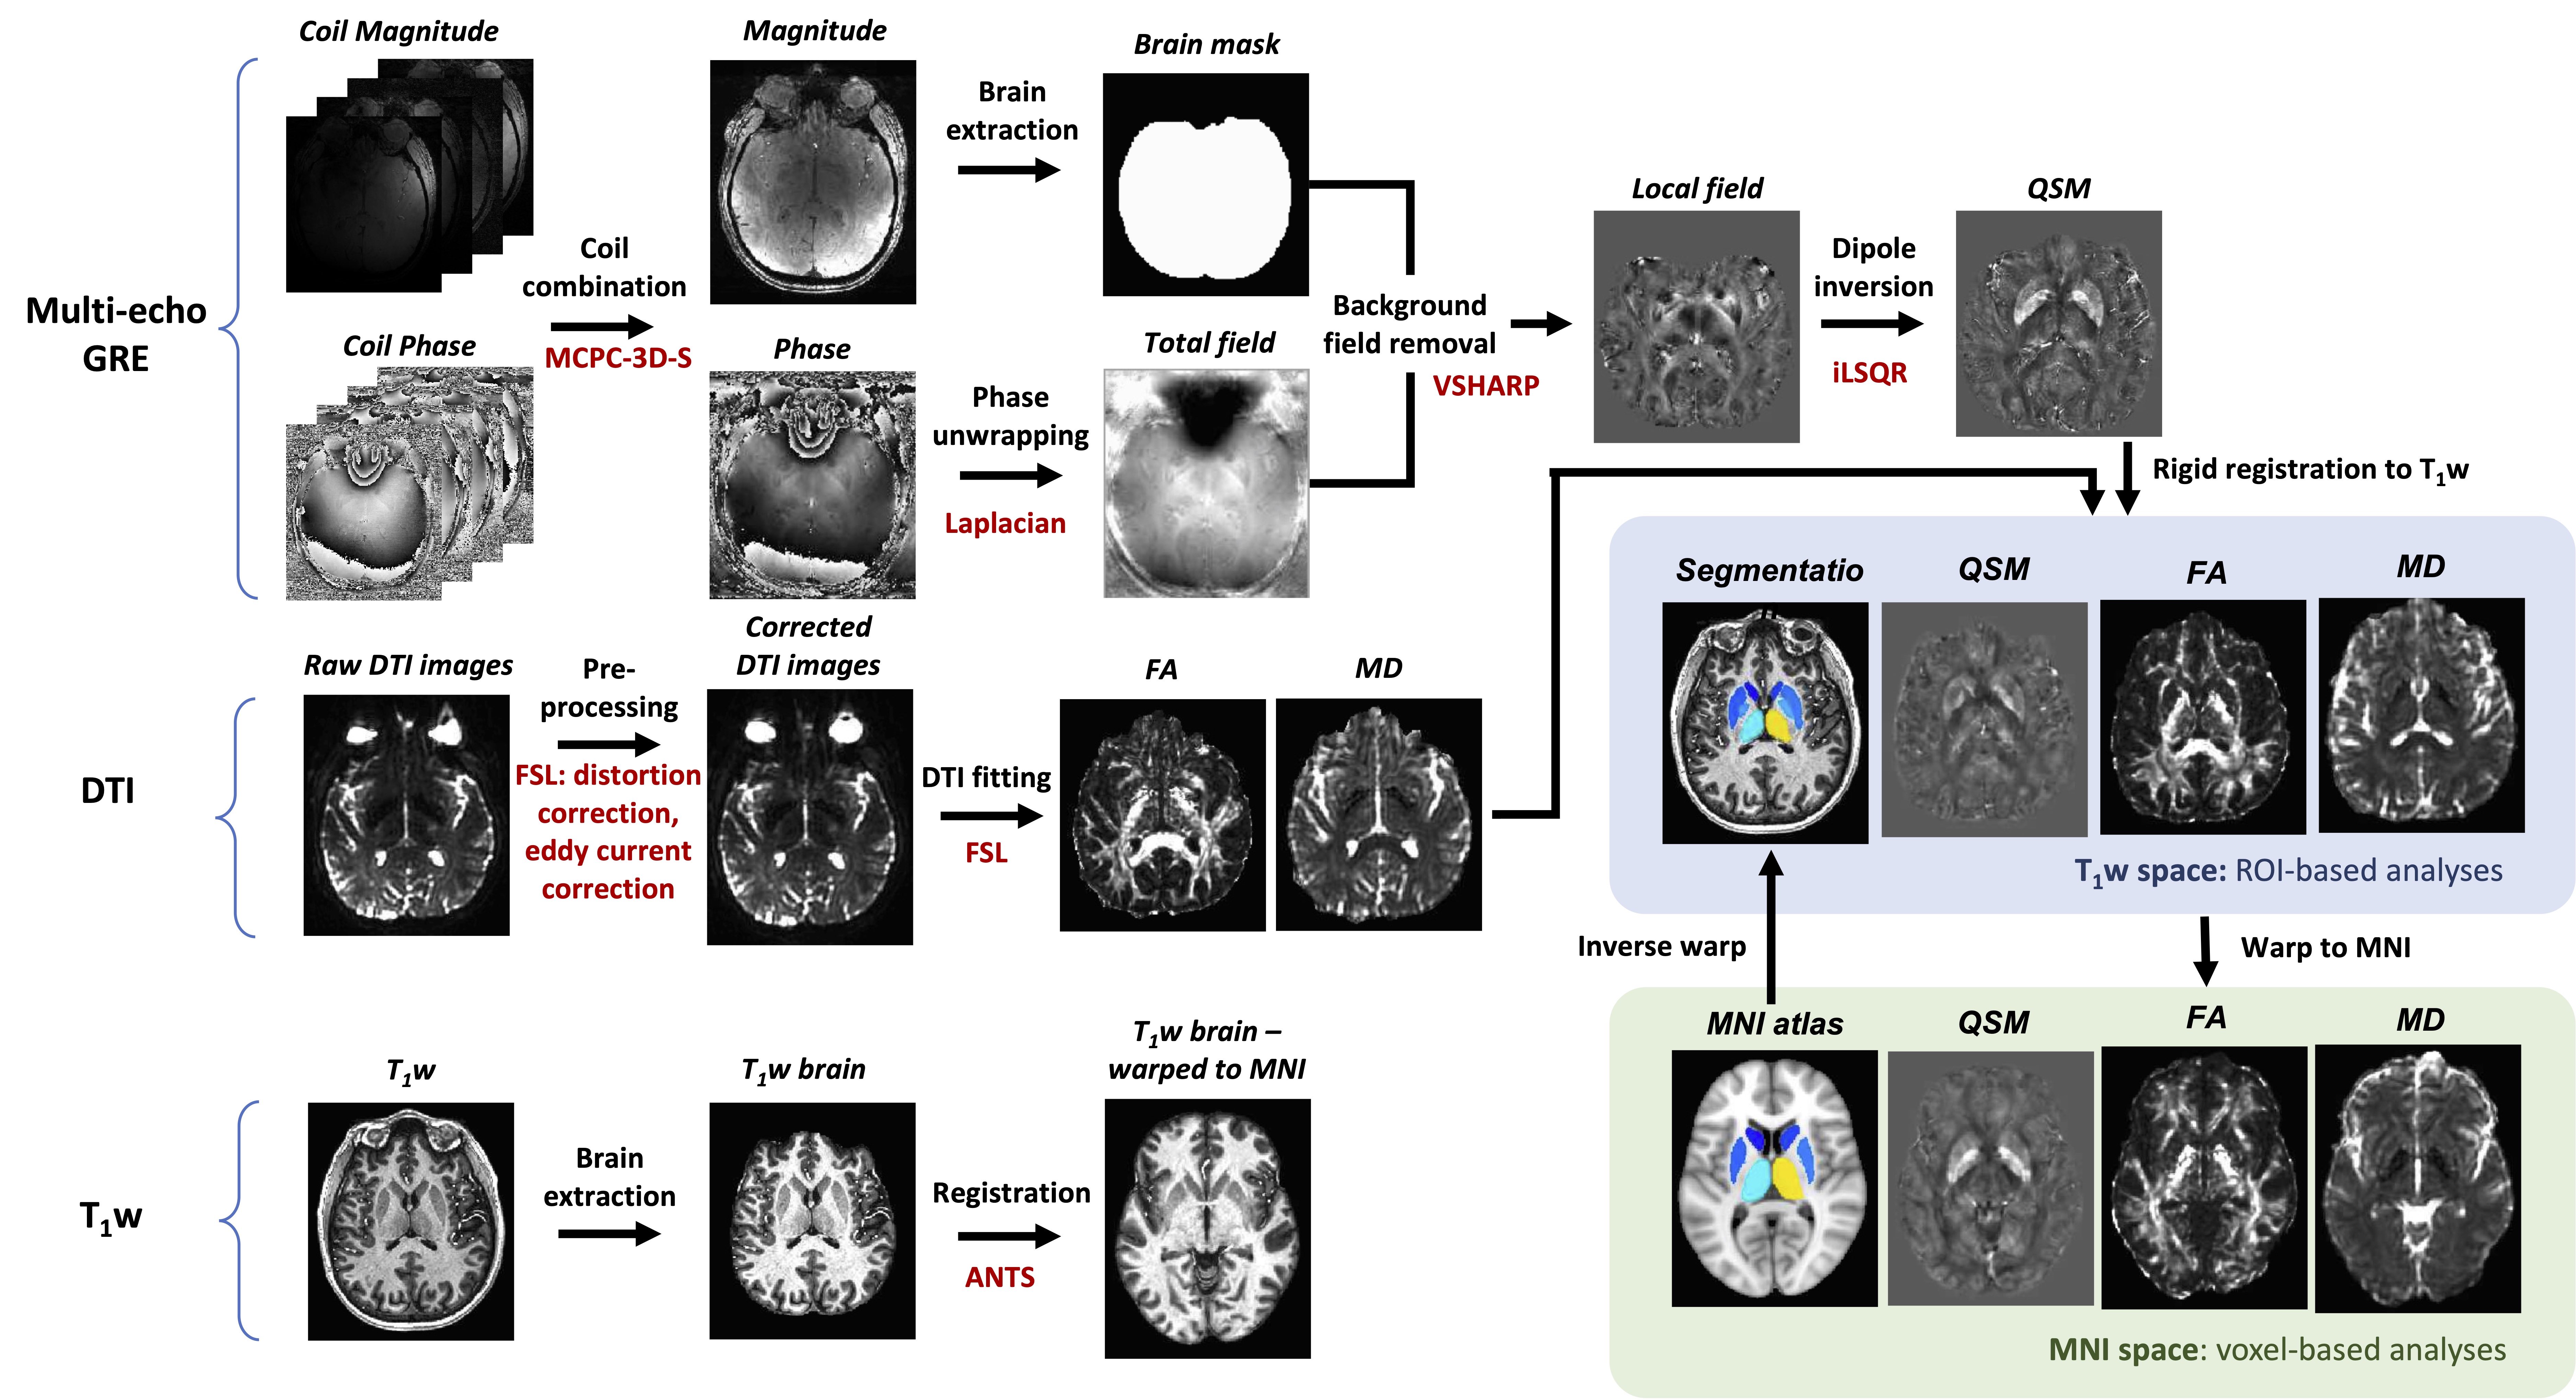
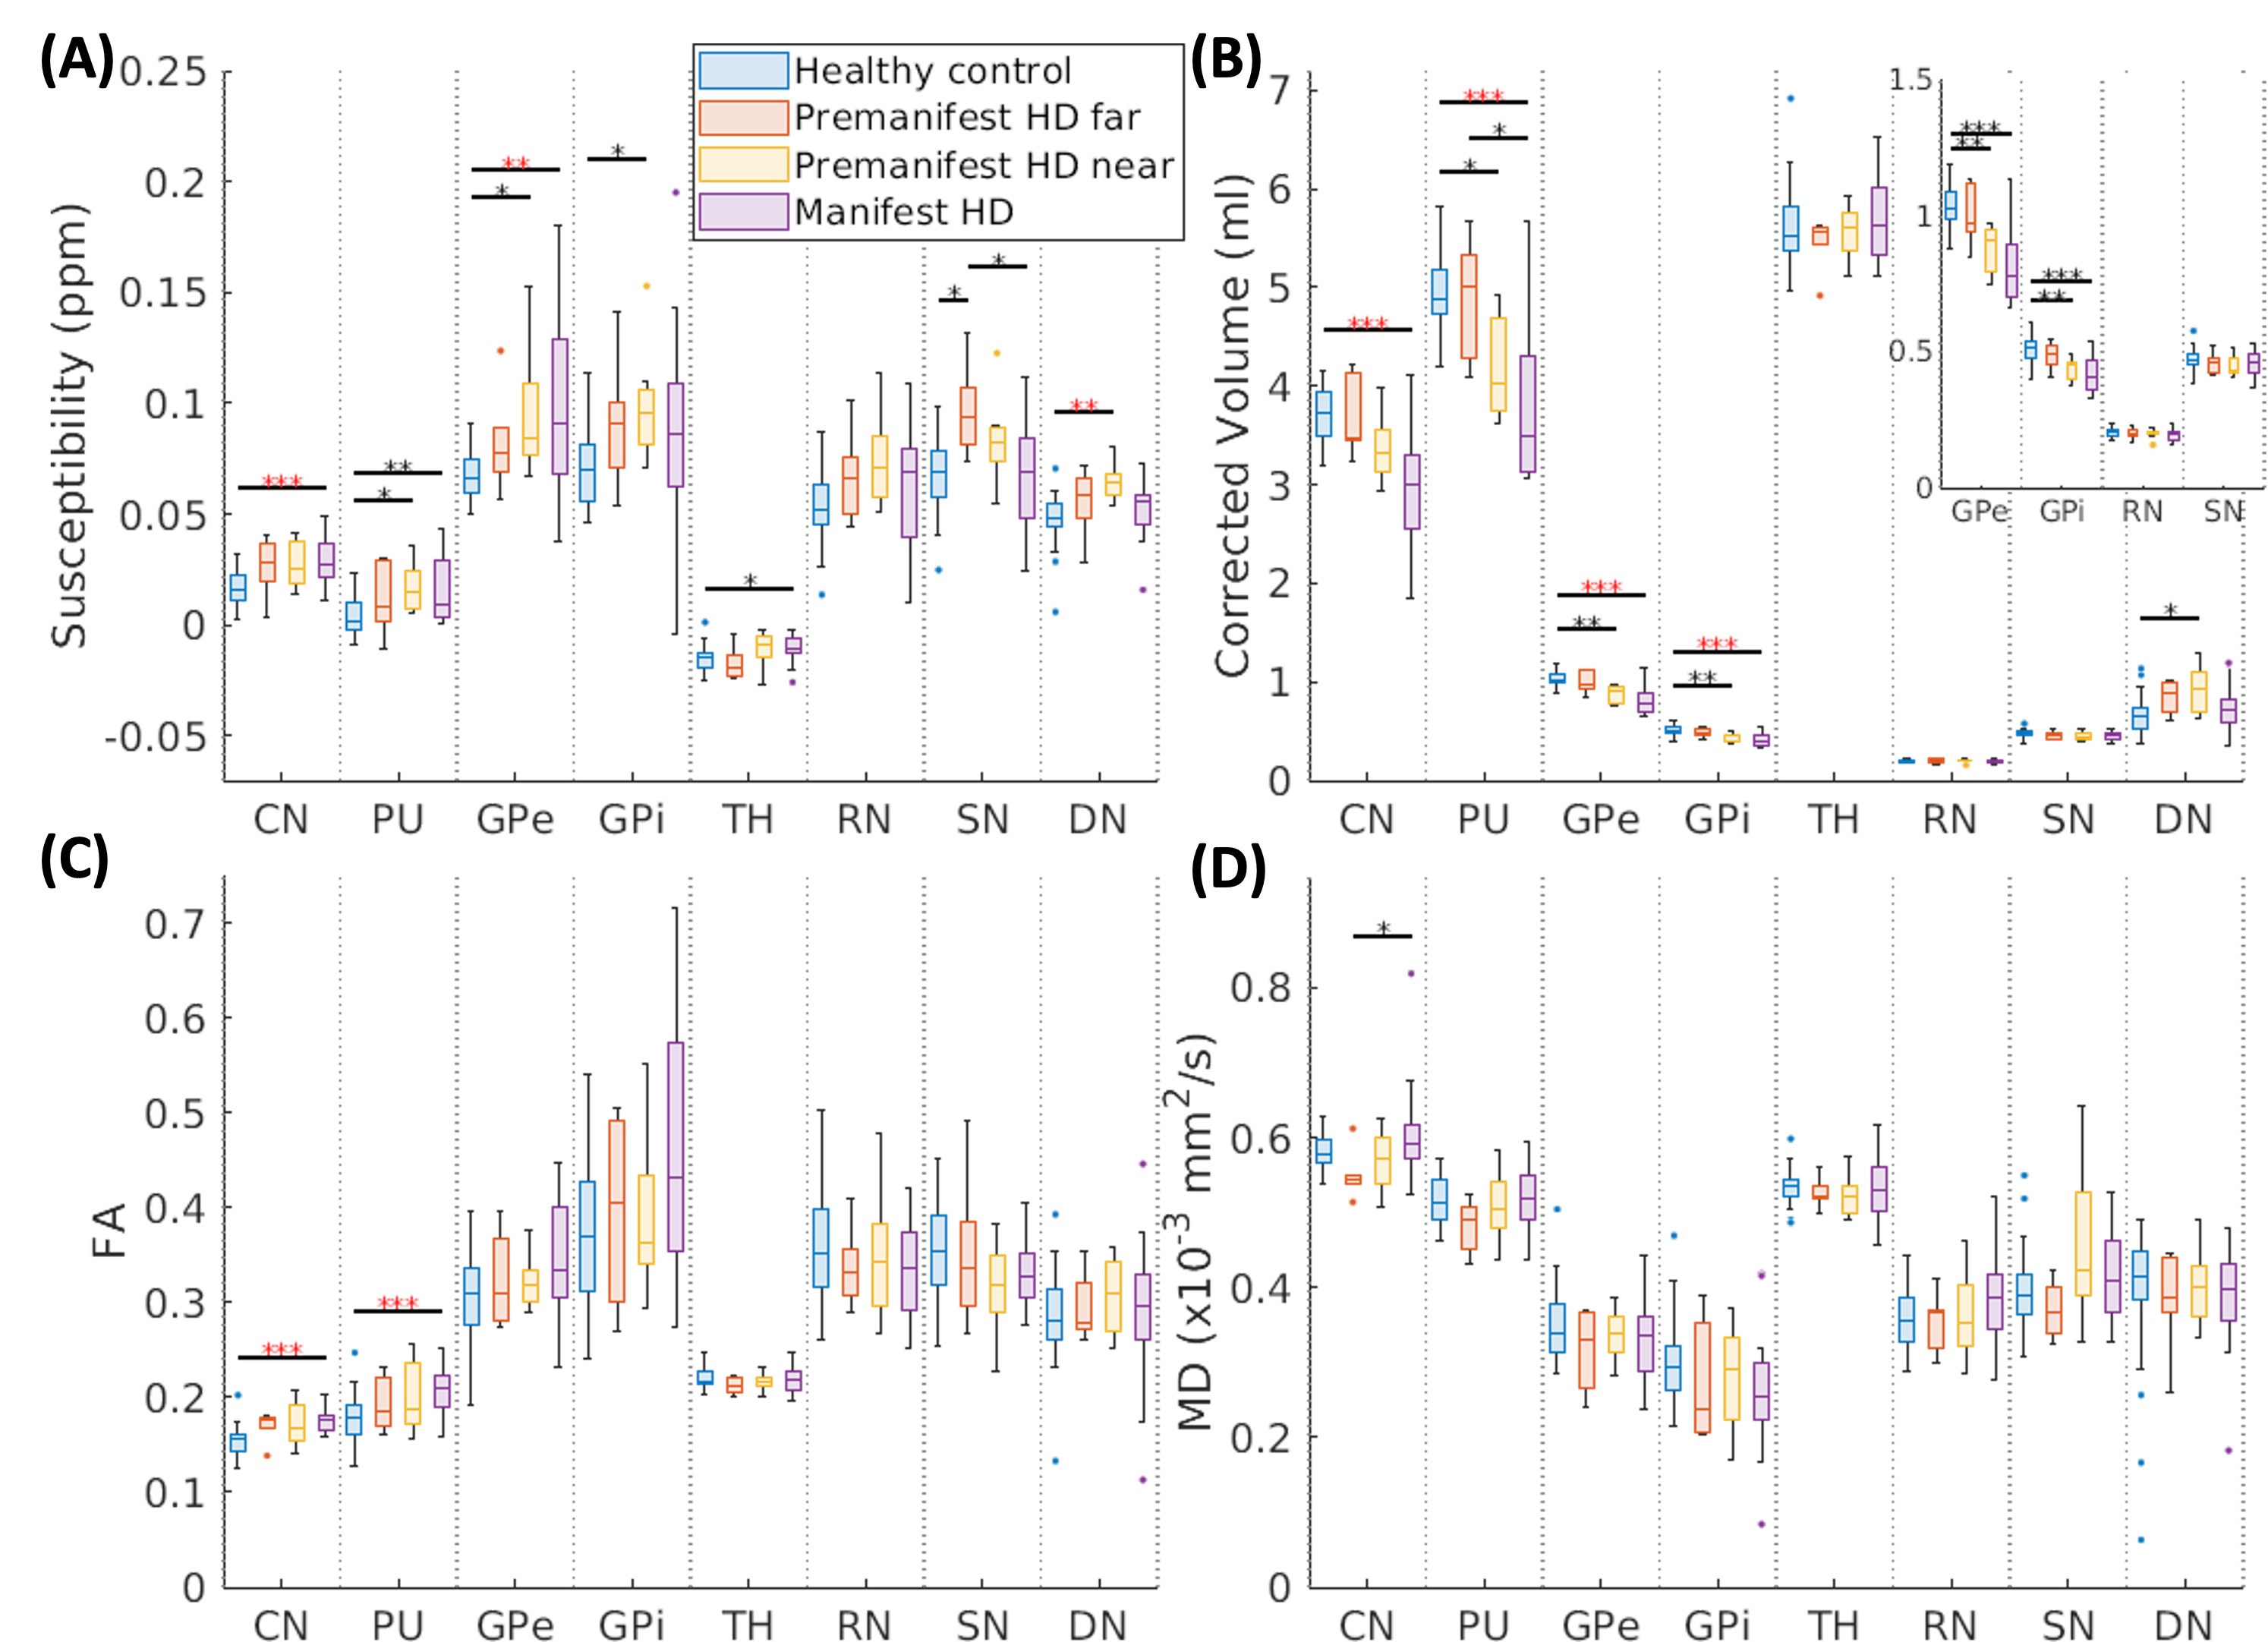
Figure 2. Comparisons of imaging features across healthy controls, premanifest HD far from/near onset, and manifest HD. (A-D) illustrated the Kruskal-Wallis comparison of volume, susceptibility, FA, and MD in each brain region. CN: caudate nucleus; PU: putamen; GPe/GPi: globus pallidus externa/interna; TH: thalamus; RN: red nucleus; SN: substantia nigra; DN: dentate nucleus; *: p<0.05; **: p<0.01; ***: p<0.001; ****: p< 0.0001; Red stars: statistical significancy after multiple-comparison correction.
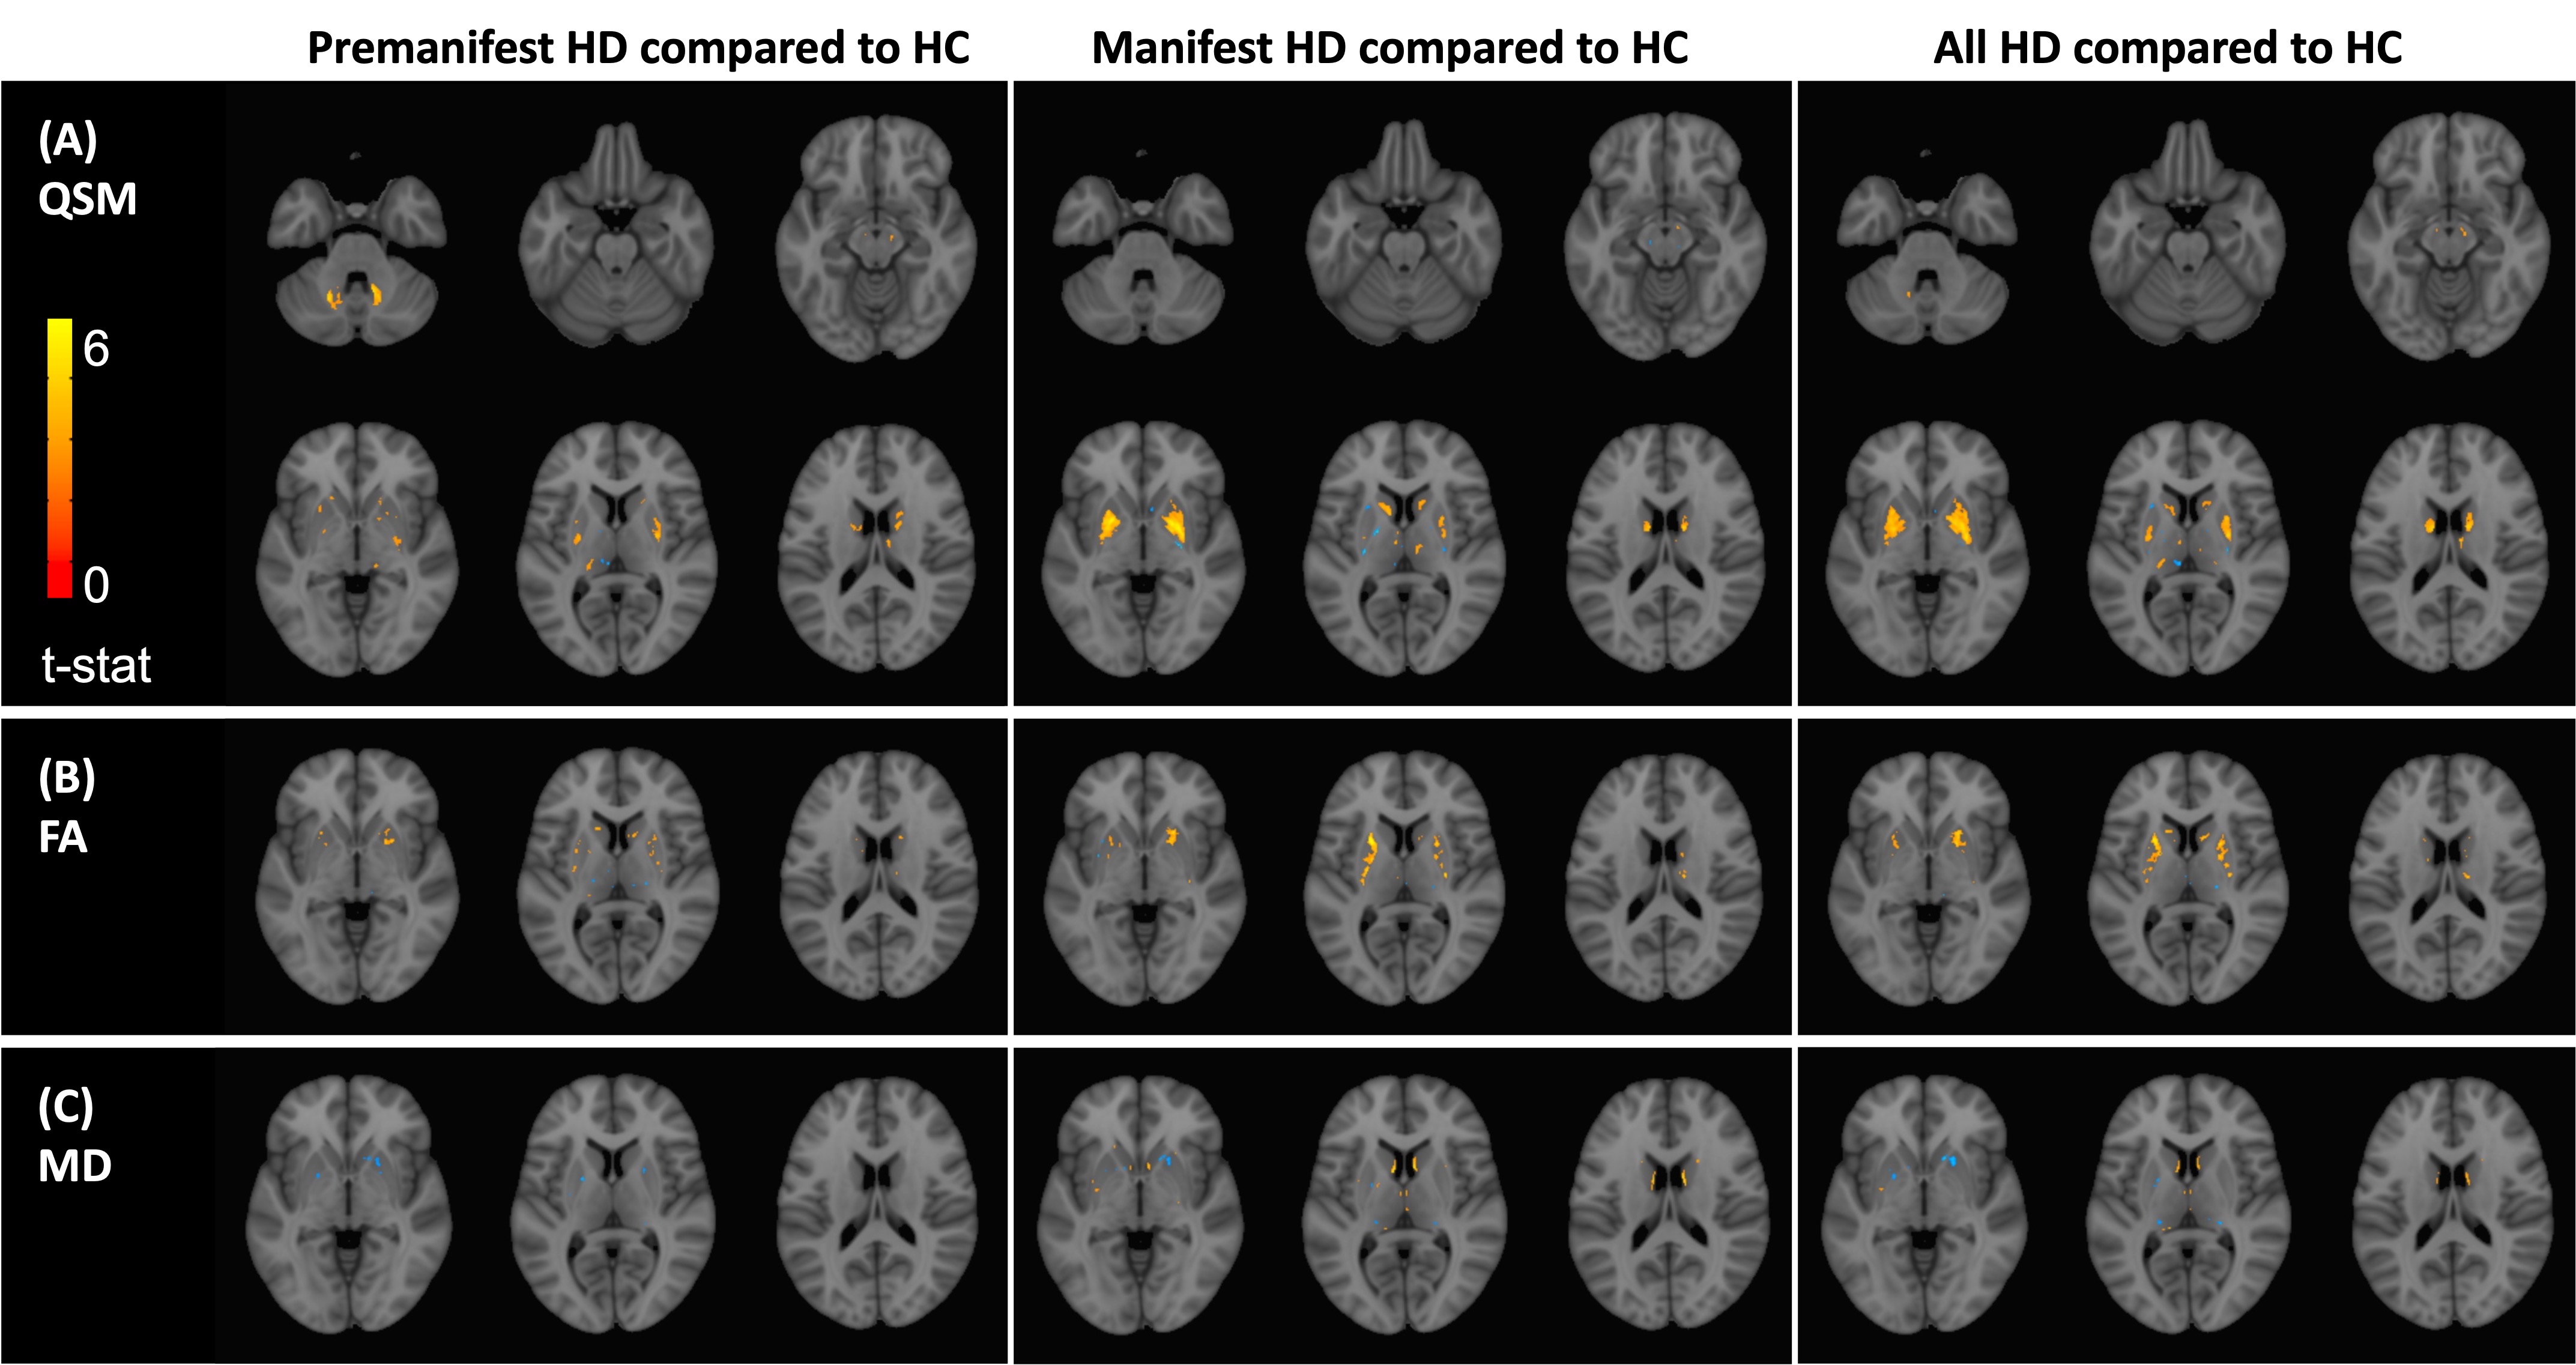
Figure 3. Voxel-wise comparisons of subcortical region susceptibility, FA, and MD across healthy controls, premanifest HD, and manifest HD. T-statistics were calculated for each voxel in the MNI space, while controlling for age and sex. The t-statistics maps were illustrated with an absolute value threshold of 3.
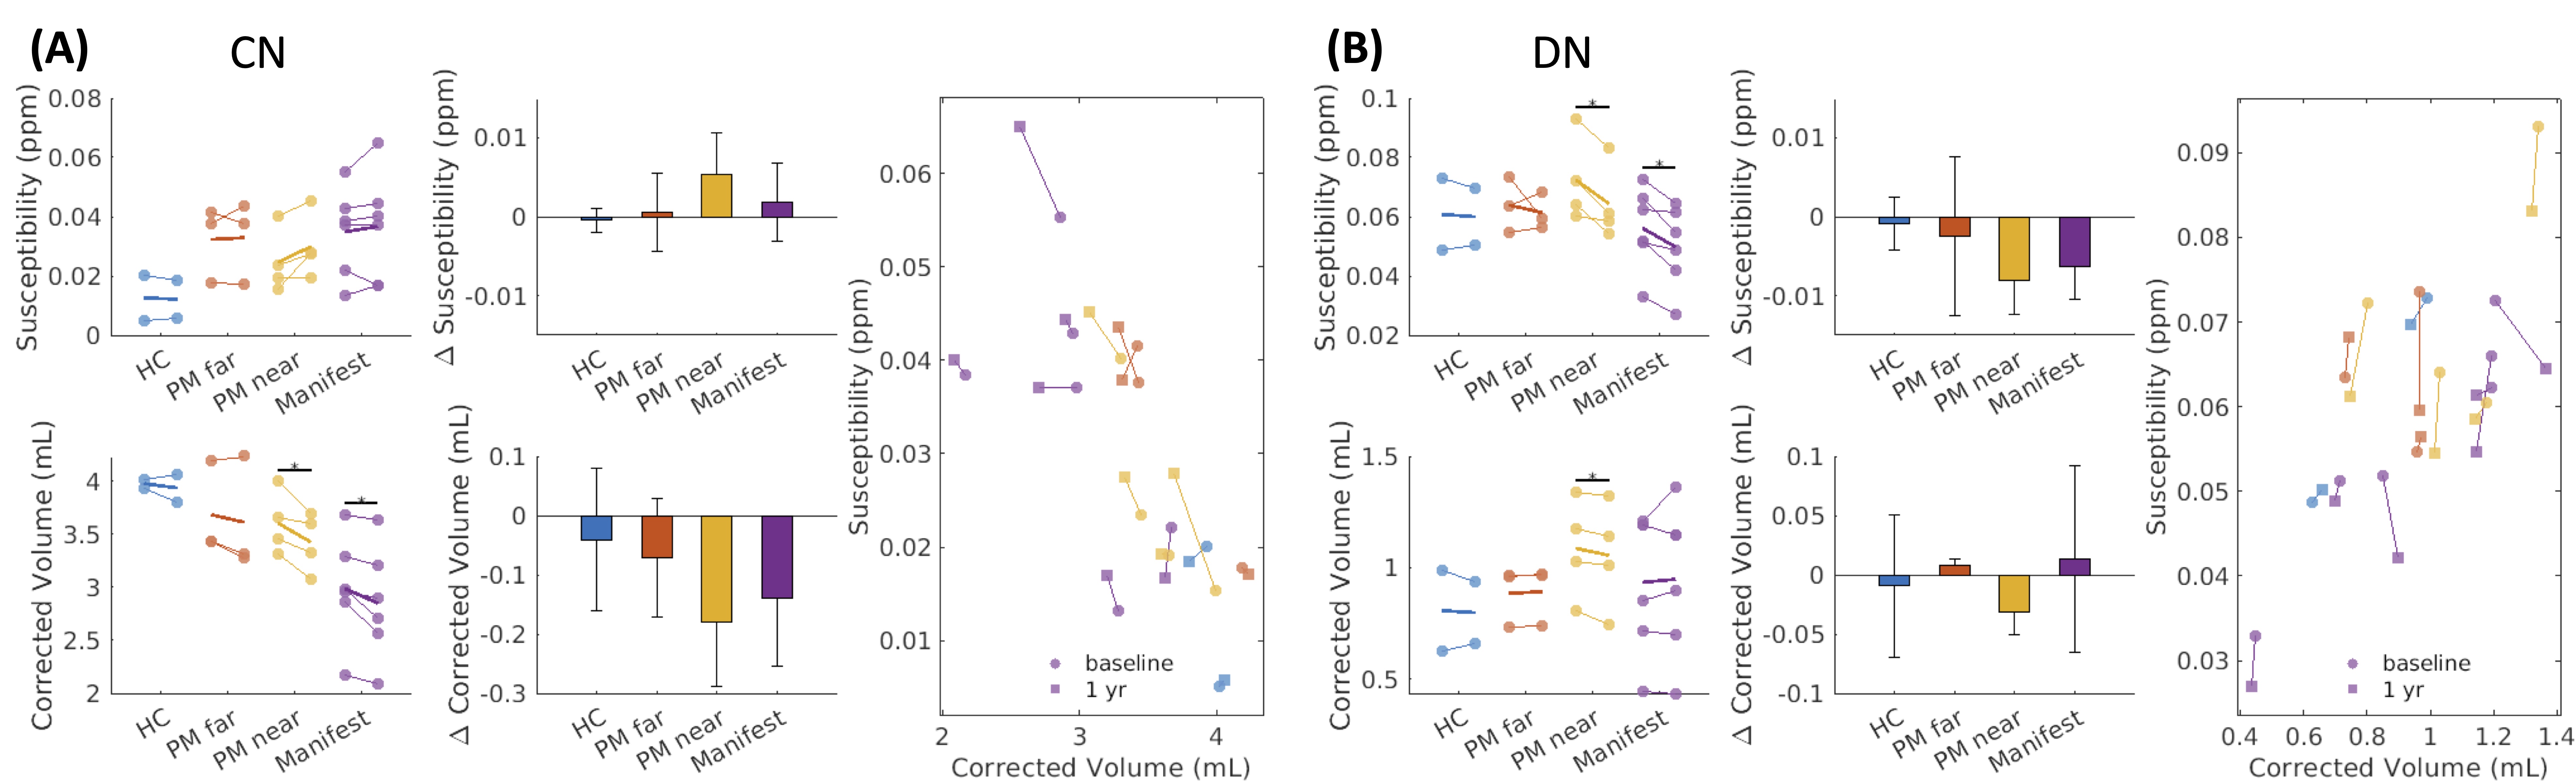
Figure 4. Longitudinal observations of volume and susceptibility changes in CN and DN. (A) and (B) plotted the paired comparisons of baseline and follow-up susceptibility values and volumes in CN and DN. The changes in susceptibility and volume were plotted with bars representing the mean differences and error bars representing the standard deviations. The two imaging biomarkers were also illustrated in 2D plots. HC: healthy control; PM premanifest; CN: caudate nucleus; DN: dentate nucleus; *: p<0.05.
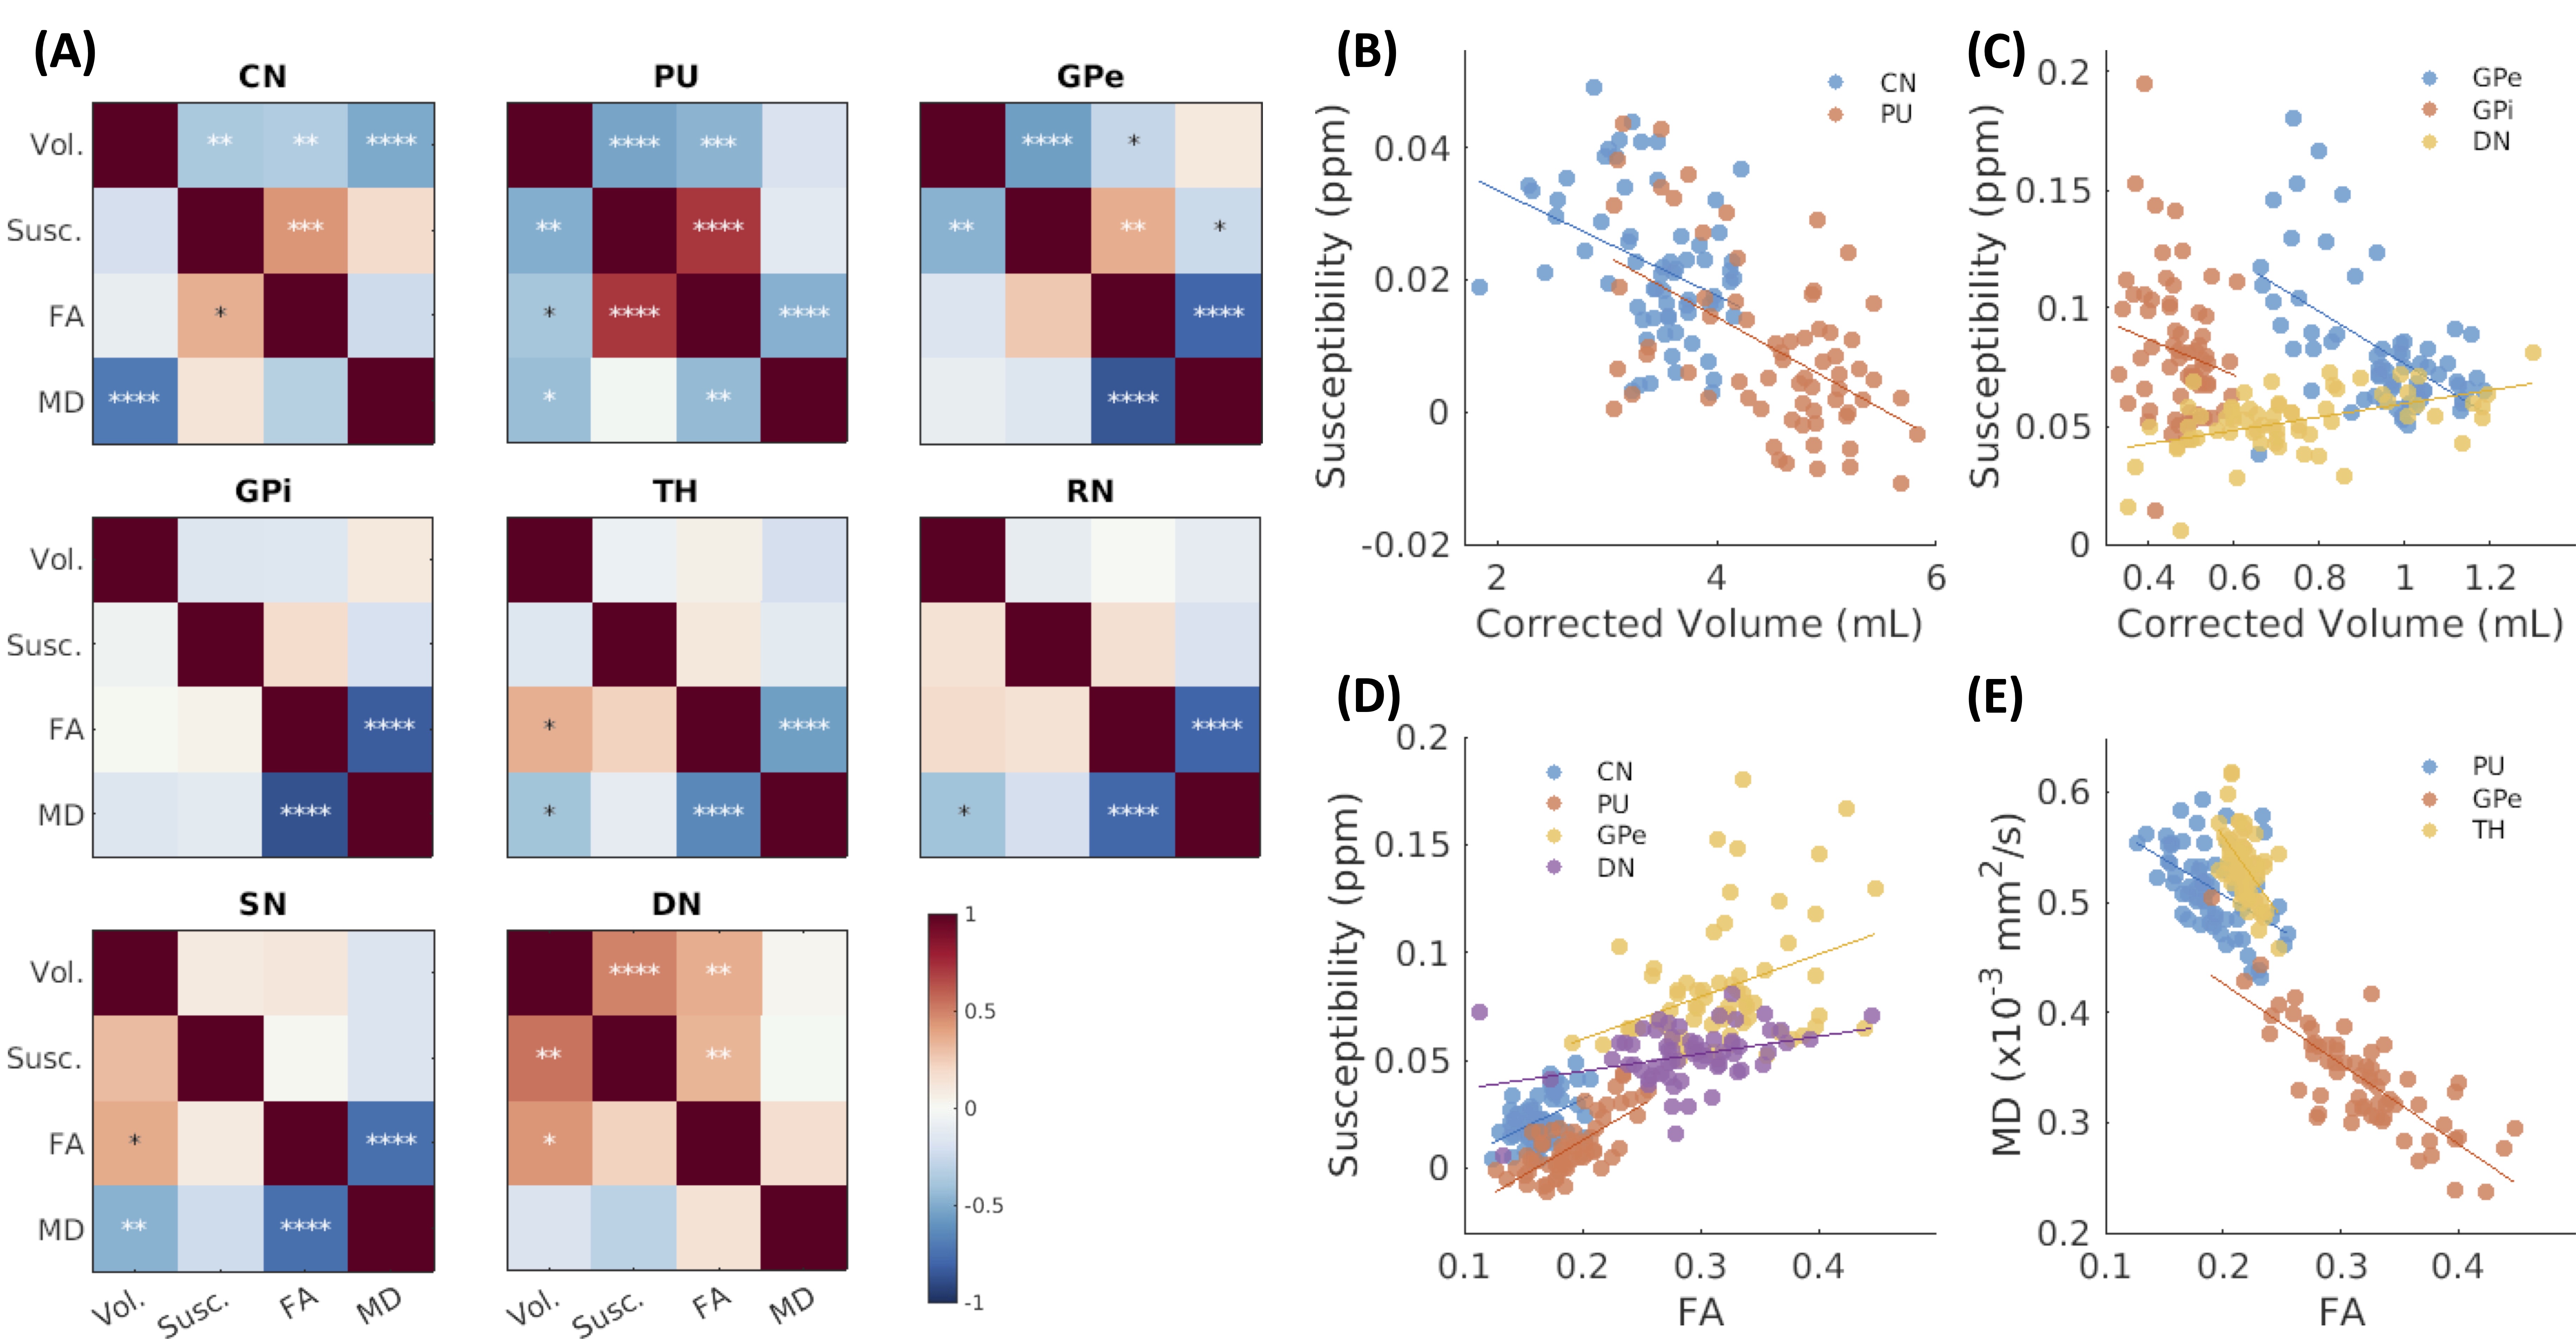
Figure 5. Correlations between MRI biomarkers in subcortical brain regions. (A) illustrated the correlation matrices between volume, susceptibility, FA, and MD in subcortical brain regions. The upper triangles represented the correlations across all subjects, and the lower triangles represented the results from HD subjects only. Example correlations were plotted in (B-E). *: p<0.05; **: p<0.01; ***: p<0.001; ****: p< 0.0001; White stars: significant correlations after multiple statistics correction.