0571
7T fMRI in the Cervical Spinal Cord Under Noxious Thermal Stimulation1Biomedical Engineering and Imaging Institute, Icahn School of Medicine at Mount Sinai, New York, NY, United States, 2Department of Radiology, Icahn School of Medicine at Mount Sinai, New York, NY, United States, 3Graduate School of Biomedical Sciences, Icahn School of Medicine at Mount Sinai, New York, NY, United States, 4Department of Physics, Norwegian University of Science and Technology (NTNU), Trondheim, Norway
Synopsis
Keywords: Spinal Cord, Spinal Cord
FMRI of the spinal cord is challenging due to its small size, necessitating high resolution. Increasing B0 to 7T enables higher spatial resolution, and also enhances BOLD signal. However, challenges related to B0 homogeneity complicate spinal cord fMRI at 7T. We present group-level stimulus task fMRI results in the spinal cord at 7T, and compare the performance of single-shot and multi-shot 2D EPI protocols. Single-shot at 0.75mm in-plane resolution was most sensitive to activation, while multi-shot at 0.60mm provided the best-localized clusters. The best choice of protocol depends on the importance of sensitivity versus spatial localization for a given experiment.Introduction
The spinal cord houses many important neurocircuits, including pattern generators related to locomotion1, sensorimotor reflex arcs, and circuits involved in modulation of nociception2. Although fMRI is well-established in the brain, fMRI of the spinal cord is more technically demanding. The spinal cord is small, with gray matter structures only 1-3mm wide, requiring high spatial resolution. It is also adjacent to the vertebral column, which is composed of alternating calcified and soft tissues with different magnetic susceptibilities. The spatially periodic B0 inhomogeneities created within the cord cannot be cancelled by standard shim coils, leaving strong residual inhomogeneities. The spinal cord is also near the lungs, which cause temporal fluctuations in B03 with respiration that can exceed 100Hz at C7 at 7T4.Increasing field strength to 7T has two main advantages: increased SNR, which enables higher spatial resolution, and increased BOLD signal. However, the challenges related to B0 homogeneity that complicate spinal cord fMRI even at 3T are further magnified at 7T. Only three published studies of spinal cord fMRI at 7T exist5–7, all of which are resting-state studies. A significant motivator for spinal cord fMRI is to study pain processing2, which often requires a task- or stimulus-type study design. In this work, we present group-level stimulus task fMRI results in the spinal cord at 7T, and compare the performance of single-shot and multi-shot 2D EPI protocols.
Methods
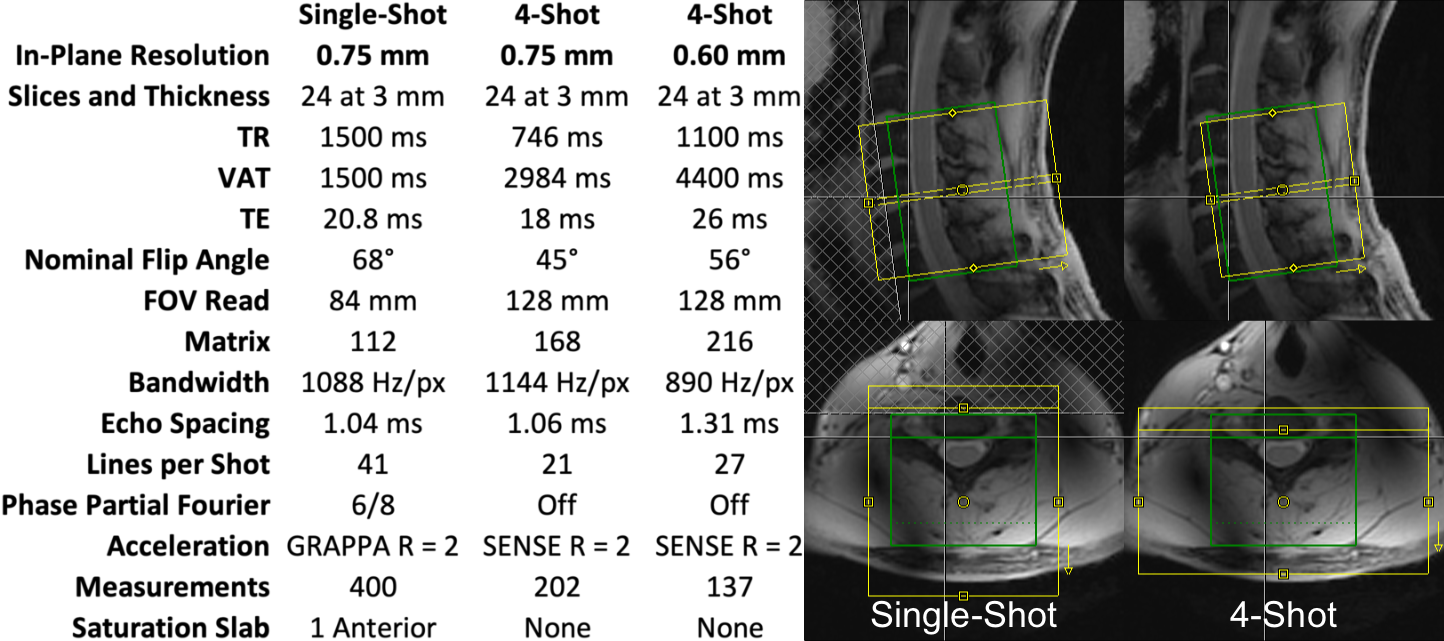
The cervical spinal cords of eleven healthy volunteers were scanned using a 7T whole-body MRI system (Magnetom, Siemens), a 22-channel RF coil8, and one single-shot and two multi-shot 2D EPI protocols (Figure 1). Isotropic 0.7-mm MP2RAGE9 images were acquired for registration to template space. Multi-shot reconstruction included navigator-based correction of respiratory B0 fluctuations. In each 10min experiment, noxious heat was applied to the right thumb at a calibrated intensity of 3/10 using an fMRI-compatible stimulator (TSA2, Medoc). This study was performed under an IRB-approved protocol and in compliance with all applicable regulations.Functional images were motion-corrected and smoothed using a 2mm*2mm*6mm Gaussian kernel, and all images were registered to PAM50 template10 space using Spinal Cord Toolbox11. First-level GLM analysis was performed in FSL FEAT12, using a 35-term physiologic noise model13,14 (PNM) containing 8 cardiac, 8 respiratory, 16 interaction14, CSF, and 2 motion terms. Group-level GLM analyses were then performed.
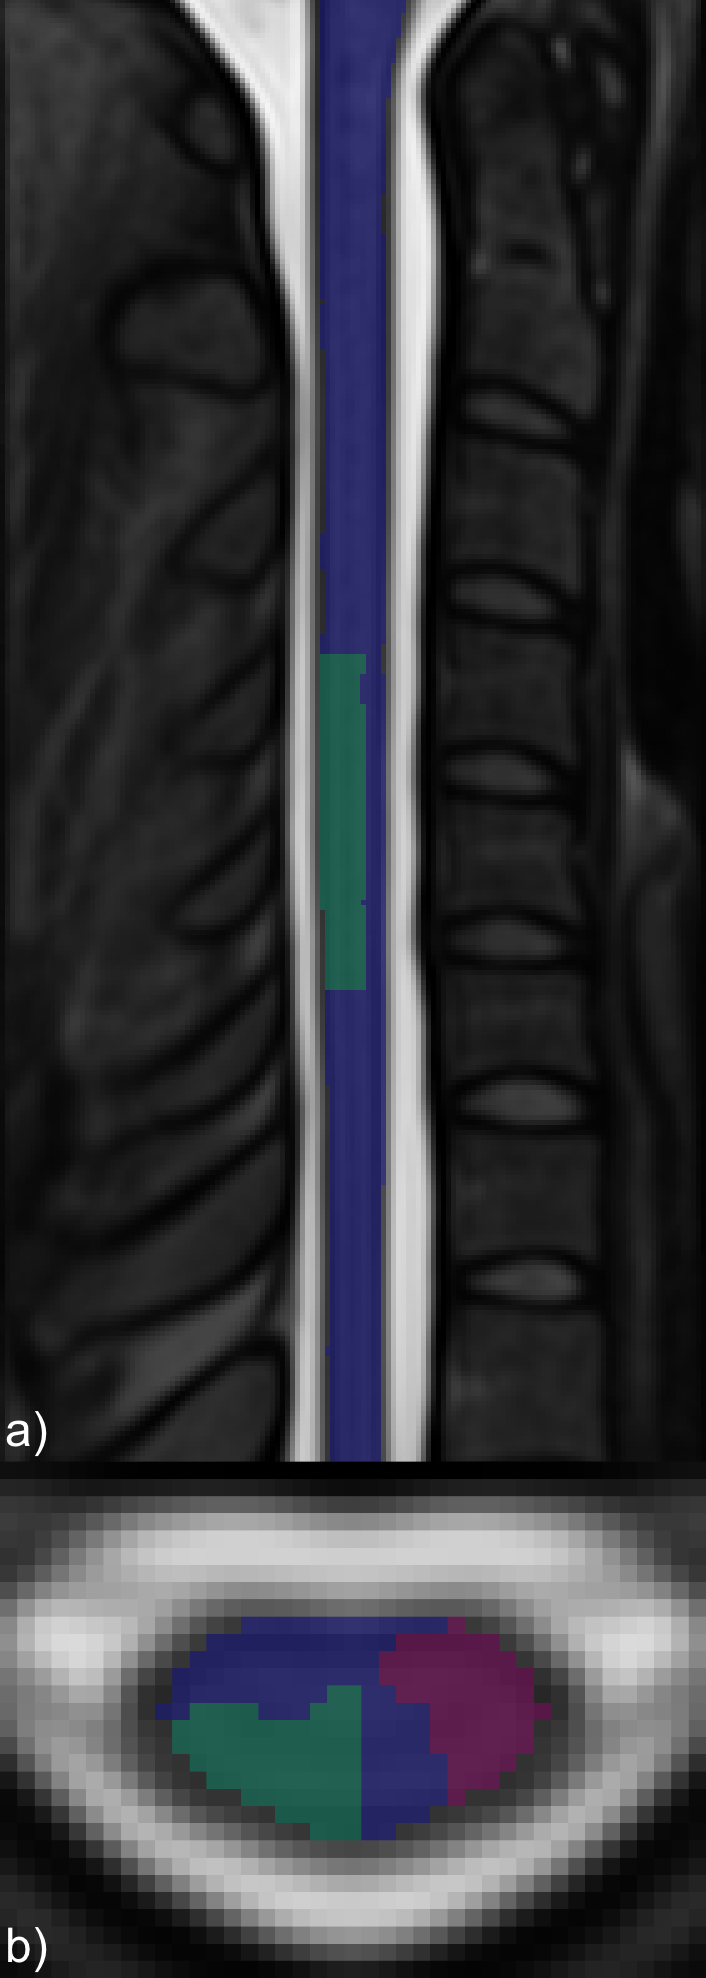
ROI masks were defined for analysis of true and false positive activation (Figure 2). Mean and maximum z-statistics across activated (z>1.64) voxels within the true-positive and false-positive ROIs were tabulated. The ratio of the maximum z-statistic in the true-positive to false-positive ROIs characterizes the specificity of each protocol. Mean BOLD percent signal change was calculated in activated voxels in the true-positive region, as well as the BOLD percent signal change in the voxel in the true-positive region having the highest z-statistic.
Results
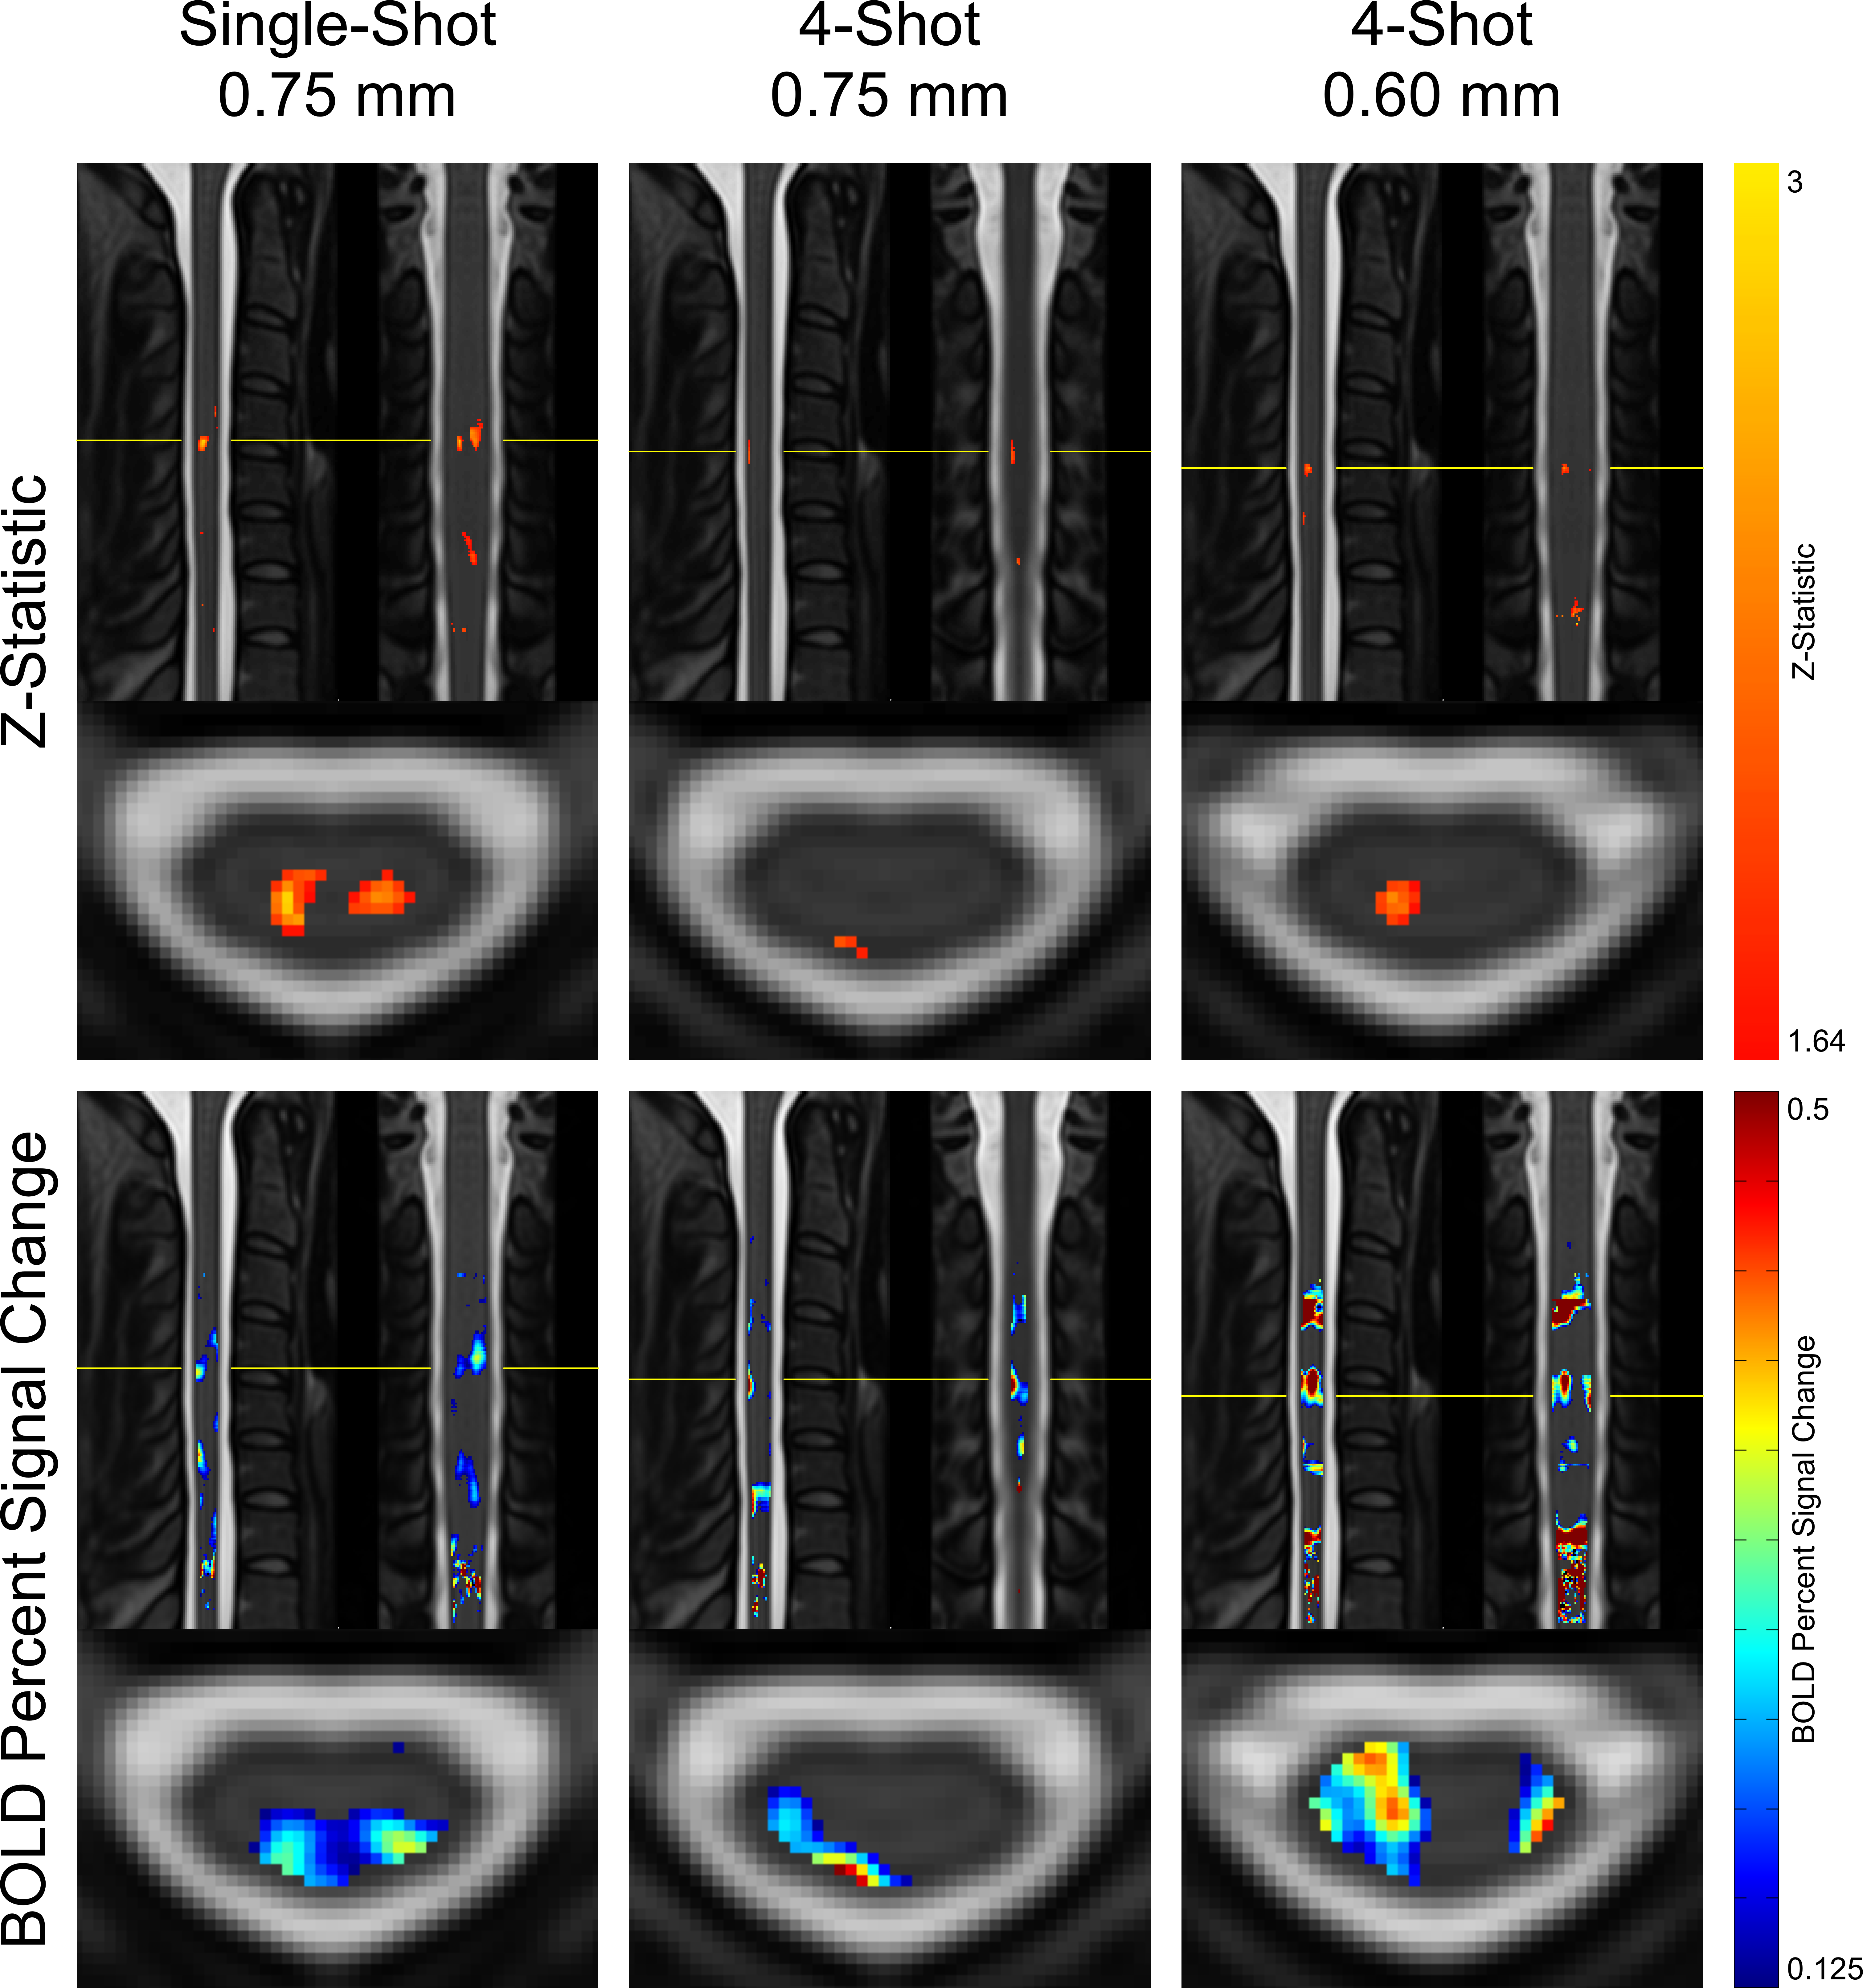
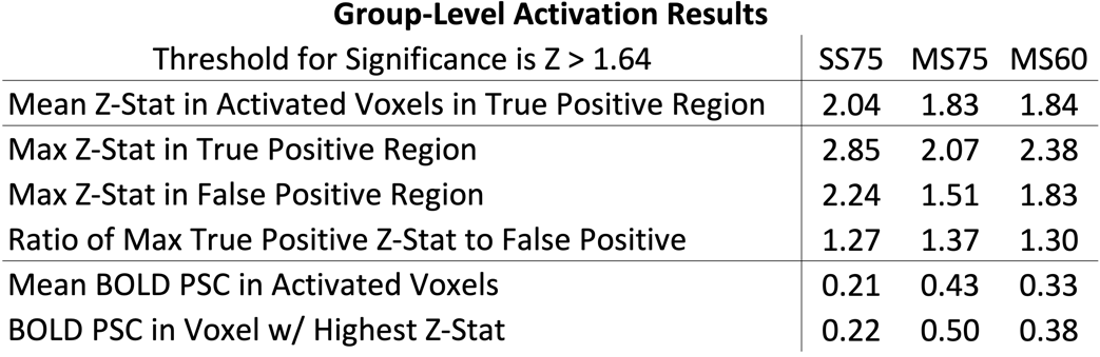
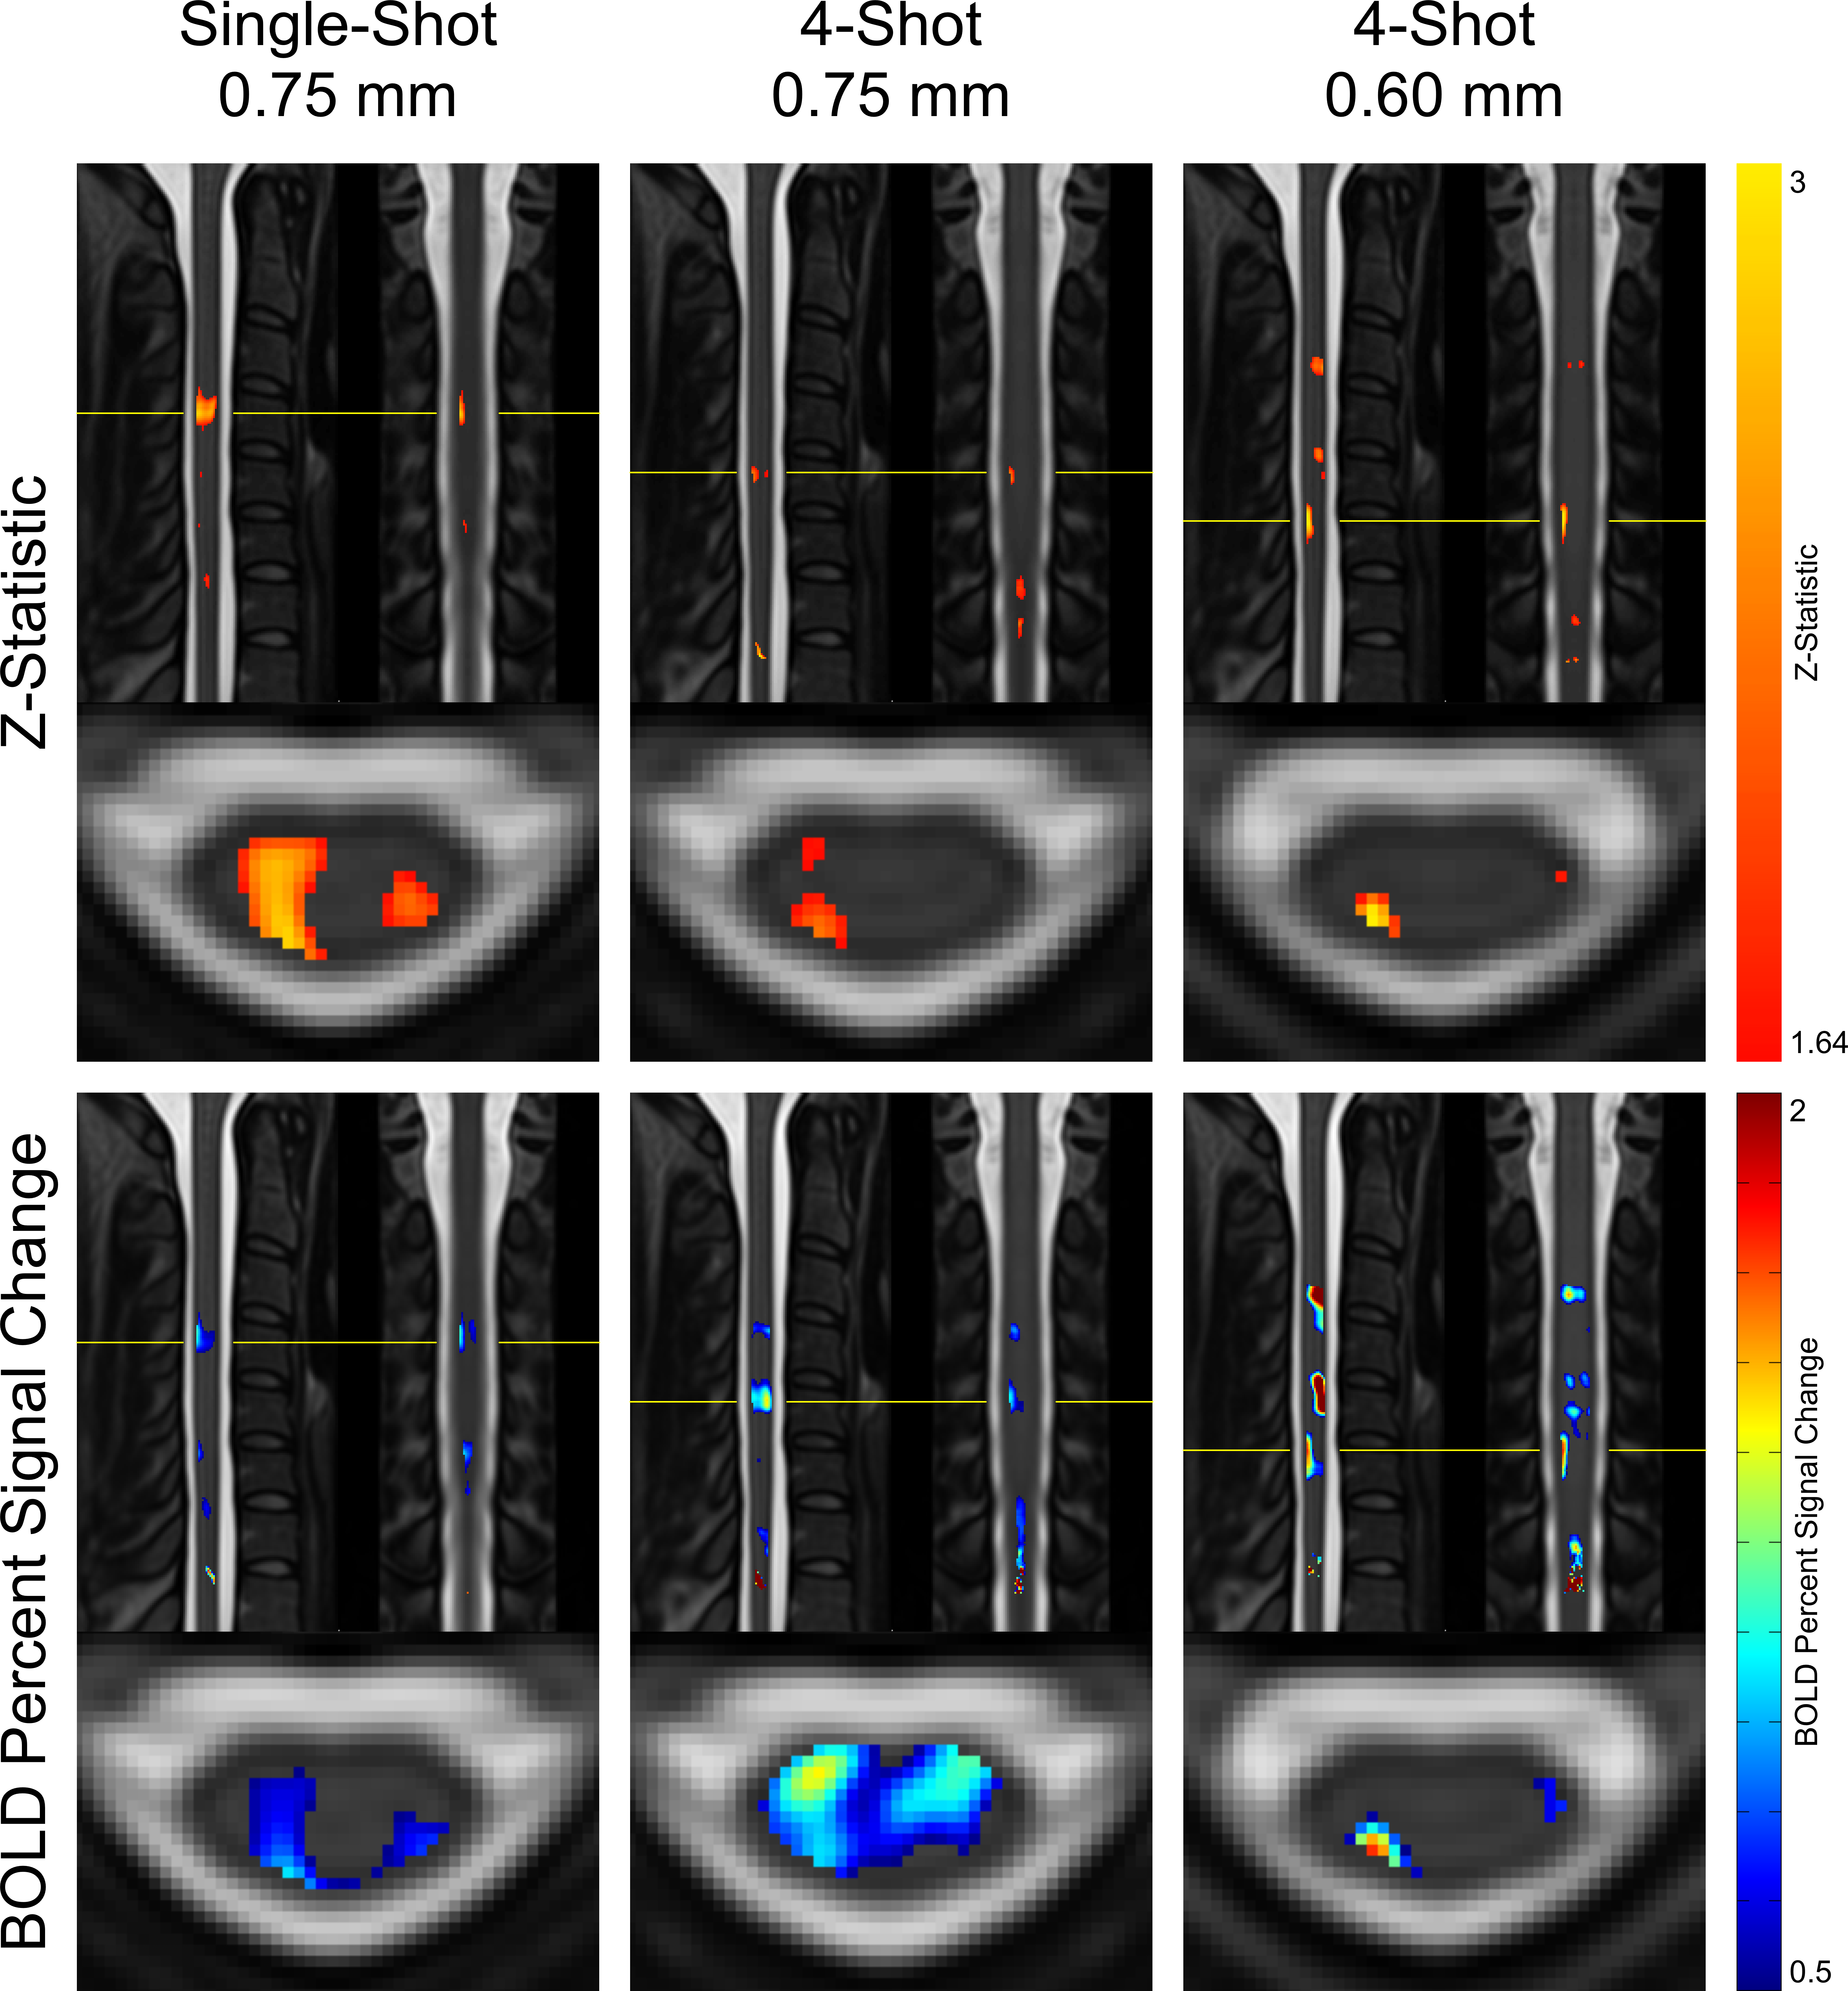
Maps of z-statistics and BOLD percent signal changes in group-level GLM analyses are shown in Figure 3. Clusters of activation appear in all protocols in the ipsilateral dorsal quadrant at the expected C6 neurological (C4-C5 vertebral) level. In single-shot 0.75 mm, a cluster also appears in the contralateral (left) dorsal horn.Descriptive statistics are given in Figure 4. Mean and maximum z-statistics in activated true-positive voxels are highest in single-shot 0.75 mm. All three protocols yielded a ratio of true-positive to false-positive max z-statistic between 1.27 and 1.37. The mean BOLD percent signal change in activated voxels was higher in multi-shot datasets than in single-shot.
Discussion
In group-level GLM analyses, single-shot 0.75mm and multi-shot 0.60mm appear to yield similarly-sized activation clusters, and the maximum z-statistic in single-shot 0.75mm is substantially greater than in multi-shot 0.60mm (see Figure 4). In individual-level results, however, multi-shot 0.60mm generally yields more sharply-defined activation clusters (see Figure 5), and the maximum z-statistic is closer to single-shot 0.75mm than in the group level analysis. A possible explanation that unifies these observations is that multi-shot 0.60mm is better able to spatially resolve activation in individual subjects, resulting in small clusters; however, when multiple subjects’ data is combined, inherent physiological variability in the location of activation among different subjects15 results in these small clusters spatially coinciding less fully in multi-shot 0.60mm than do the broader activation clusters in single-shot 0.75mm.In general, the single-shot 0.75mm protocol provides the greatest sensitivity to activation, but is most susceptible to the detrimental effects of static B0 inhomogeneity. Multi-shot 0.60mm produces the most well-localized activation clusters, and is less affected by geometric distortion and through-slice dephasing caused by static B0 inhomogeneity than single-shot 0.75mm. However, sensitivity to activation is reduced due to its longer volume acquisition time, which reduces the number of time points in an experiment of fixed duration and, therefore, statistical power. Multi-shot EPI in general is also more sensitive to temporal B0 fluctuations, which cause phase inconsistency between shots. Multi-shot 0.75mm generally performs poorly; it appears to share the drawbacks of each of the other protocols, without enjoying the benefits of either protocol to a similar degree.
Conclusion
Single-shot 0.75mm was most sensitive to activation, while multi-shot 0.60mm provided the best-localized clusters. The best choice of protocol depends on the importance of sensitivity versus spatial localization for a given experiment.Acknowledgements
This study was supported by National Institutes of Health (NINDS) award number K01NS105160 (ACS).References
1. Minassian, K., Hofstoetter, U. S., Dzeladini, F., Guertin, P. A. & Ijspeert, A. The Human Central Pattern Generator for Locomotion: Does It Exist and Contribute to Walking? Neuroscientist 23, 649–663 (2017).
2. Bingel, U. & Tracey, I. Imaging CNS modulation of pain in humans. Physiology (Bethesda) 23, 371–380 (2008).
3. Raj, D., Anderson, A. W. & Gore, J. C. Respiratory effects in human functional magnetic resonance imaging due to bulk susceptibility changes. Phys. Med. Biol. 46, 3331–3340 (2001).
4. Vannesjo, S. J., Miller, K. L., Clare, S. & Tracey, I. Spatiotemporal characterization of breathing-induced B0 field fluctuations in the cervical spinal cord at 7T. NeuroImage 167, 191–202 (2017).
5. Barry, R. L., Rogers, B. P., Conrad, B. N., Smith, S. A. & Gore, J. C. Reproducibility of resting state spinal cord networks in healthy volunteers at 7 Tesla. NeuroImage 133, 31–40 (2016).
6. Barry, R. L., Smith, S. A., Dula, A. N. & Gore, J. C. Resting state functional connectivity in the human spinal cord. Elife 3, e02812 (2014).
7. Conrad, B. N. et al. Multiple sclerosis lesions affect intrinsic functional connectivity of the spinal cord. Brain (2018) doi:10.1093/brain/awy083.
8. Zhang, B., Seifert, A. C., Kim, J.-W., Borrello, J. & Xu, J. 7 Tesla 22-channel wrap-around coil array for cervical spinal cord and brainstem imaging. Magn. Reson. Med. 78, 1623–1634 (2017).
9. Marques, J. P. et al. MP2RAGE, a self bias-field corrected sequence for improved segmentation and T1-mapping at high field. NeuroImage 49, 1271–1281 (2010).
10. De Leener, B. et al. PAM50: Unbiased multimodal template of the brainstem and spinal cord aligned with the ICBM152 space. NeuroImage 165, 170–179 (2017).
11. De Leener, B. et al. SCT: Spinal Cord Toolbox, an open-source software for processing spinal cord MRI data. NeuroImage 145, 24–43 (2017).
12. Woolrich, M. W., Ripley, B. D., Brady, M. & Smith, S. M. Temporal autocorrelation in univariate linear modeling of FMRI data. Neuroimage 14, 1370–1386 (2001).
13. Kong, Y., Jenkinson, M., Andersson, J., Tracey, I. & Brooks, J. C. W. Assessment of physiological noise modelling methods for functional imaging of the spinal cord. NeuroImage 60, 1538–1549 (2012).
14. Brooks, J. C. W. et al. Physiological noise modelling for spinal functional magnetic resonance imaging studies. NeuroImage 39, 680–692 (2008).
15. Cadotte, D. W. et al. Characterizing the location of spinal and vertebral levels in the human cervical spinal cord. AJNR Am J Neuroradiol 36, 803–810 (2015).
Figures