0570
Spinal cord MS lesion detection at 7T - Added value of MP2RAGE imaging and requirement for automatic lesion segmentation1Aix Marseille Univ, CNRS, CRMBM, Marseille, France, 2APHM, Hôpital Universitaire Timone, CEMEREM, Marseille, France, 3iLab-Spine, International Associated Laboratory, Montreal, Canada, Marseille, France, France, 4APHM, Hôpital Universitaire Timone, Department of Neuroradiology, Marseille, France, 5APHM, Hôpital Universitaire Timone, Department of Neurology, Marseille, France
Synopsis
Keywords: Spinal Cord, Multiple Sclerosis
In this exploratory study focusing on MP2RAGE and MS lesions, we demonstrated the added value of 7T imaging for lesion detection, with +20-to-30% of additional lesions seen compared to 3T. We also demonstrated that both currently available automatic segmentation model in SCT and an exploratory model build and trained based on MP2RAGE 3T images were not optimal for detecting lesions in 7T images (although a small contribution with slightly higher PPV was obtained with our model). As 7T opens great perspectives, further study should now focus on specific training and analysis tools to deal with 7T resolution and contrasts.INTRODUCTION
Multiple sclerosis (MS) is a chronic inflammatory disease of the central nervous system causing tissue damage due to demyelination [1], for which lesion identification is a key criteria for diagnosis [2] and prognosis [3-4]. As manual identification and delineation of lesions is a slow process subject to intra- and inter-observer variability, numerous studies are conducted worldwide to improve lesion detection and provide automatic lesion segmentation. Among recent works focusing on the spinal cord, a few studies demonstrated the added value of the MP2RAGE sequence at 3T [5] and the potential advantages of 7T imaging [6-7] to detect MS lesions. Meanwhile, complementary works investigated AI-based algorithms for improved lesion segmentation at 3T [8-9]. In line with these works, the purpose of this study was twofold: 1) assess the potential added value of 7T MP2RAGE imaging in MS lesion detection as compared to 3T and 2) investigate the possibility of segmenting automatically 7T lesions.MATERIALS AND METHODS
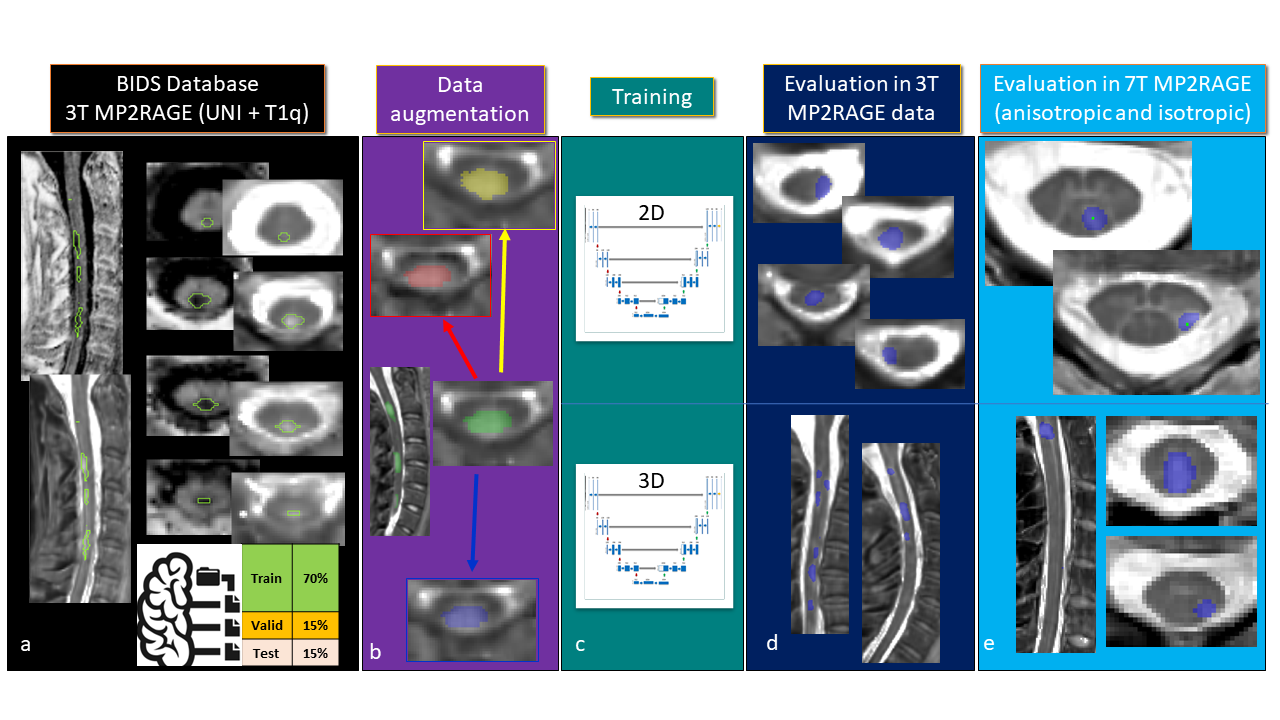
MR protocol: Nineteen patients diagnosed with MS were scanned using previously reported MP2RAGE protocols dedicated to 3T and 7T cervical cord investigations [10-12]. Isotropic spatial resolution (0.9mm3 at 3T and 0.7mm3 at 7T) as well as high in-plane resolution (0.3x0.3x4mm3) at 7T were acquired using dedicated neck coils. Conventional imaging (MAGNIMS+=T2+STIR+ (0.5mm)2-T2*w) was also acquired. Lesion detection: Lesions were identified by 4 raters, by randomly presenting the patients in separate sessions (every 3 weeks), first using MAGNIMS+, then 3T UNI/T1 MP2RAGE, to finish with 7T anisotropic and isotropic acquisitions. A consensus reading was then performed to harmonize the rating. Manual segmentation: Due to a too-time consuming process, volumetric lesion segmentation was manually performed at 3T only. Lesions on 7T data were tagged instead, in the axial plane, to indicate the presence of a lesion. Automatic segmentation: Currently only one automated method, implemented in the Spinal Cord Toolbox (SCT)[13], is available and documented for the segmentation of spinal cord lesion [8]. As this model was designed for conventional 3T sequences (T2 and T2*w) and do not necessarily perform well on MP2RAGE contrasts, a new deep learning model was developed based on available data at 3T (UNI, T1q, and manual masks). Fig.1 summarizes the main steps used to create the model (BIDS_database, data augmentation, training, evaluation). The augmented database was trained in a multi-contrast (T1q and UNI) and single-class (lesion masks only) manner on two different neural networks (2D-Unet [14] and 3D-Unet [15]), generating 2 automatic segmentation models of MS lesions in the spinal cord with the ivadomed toolbox [16]). The 3D-Unet network was trained to be applied on 3T and 7T 3D-isotropic images and the 2D-Unet for 7T 2D-anisotropic images associated with higher resolution in the axial plane. Statistics: The model performance was first evaluated in the 3T_DS1 dataset test (see fig.1), for which segmented lesion masks were available, using the Dice Coefficient. In 7T_DS2, for which lesion tagging only were available, sensitivity and positive predictive value (PPV) were used. Both cases were compared with the standard model for segmenting lesions (sct_deepseg_lesion [8] ).RESULTS
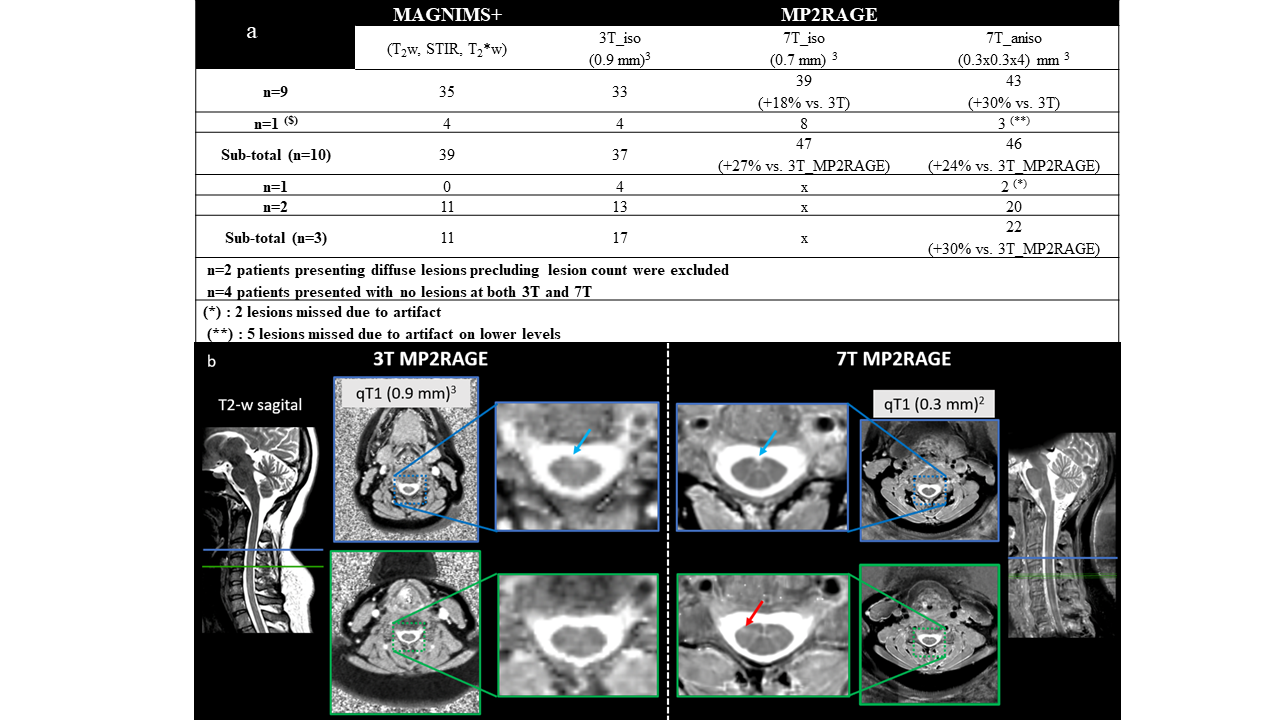
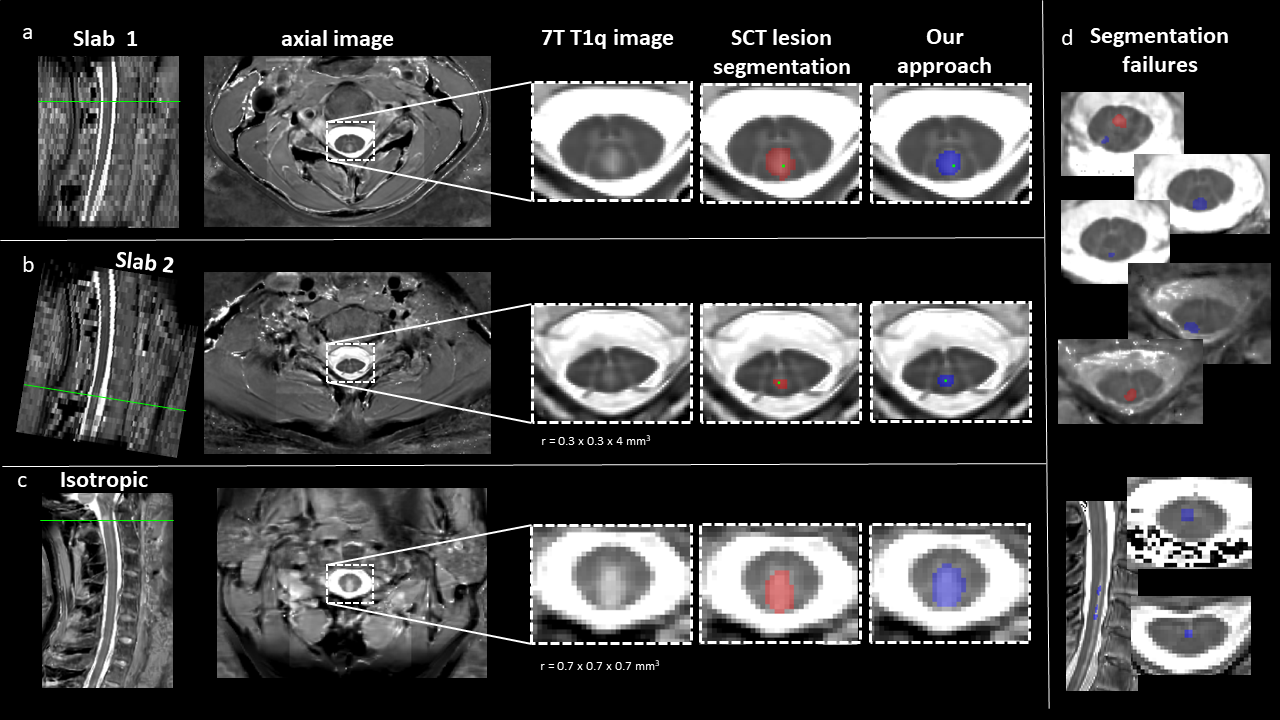
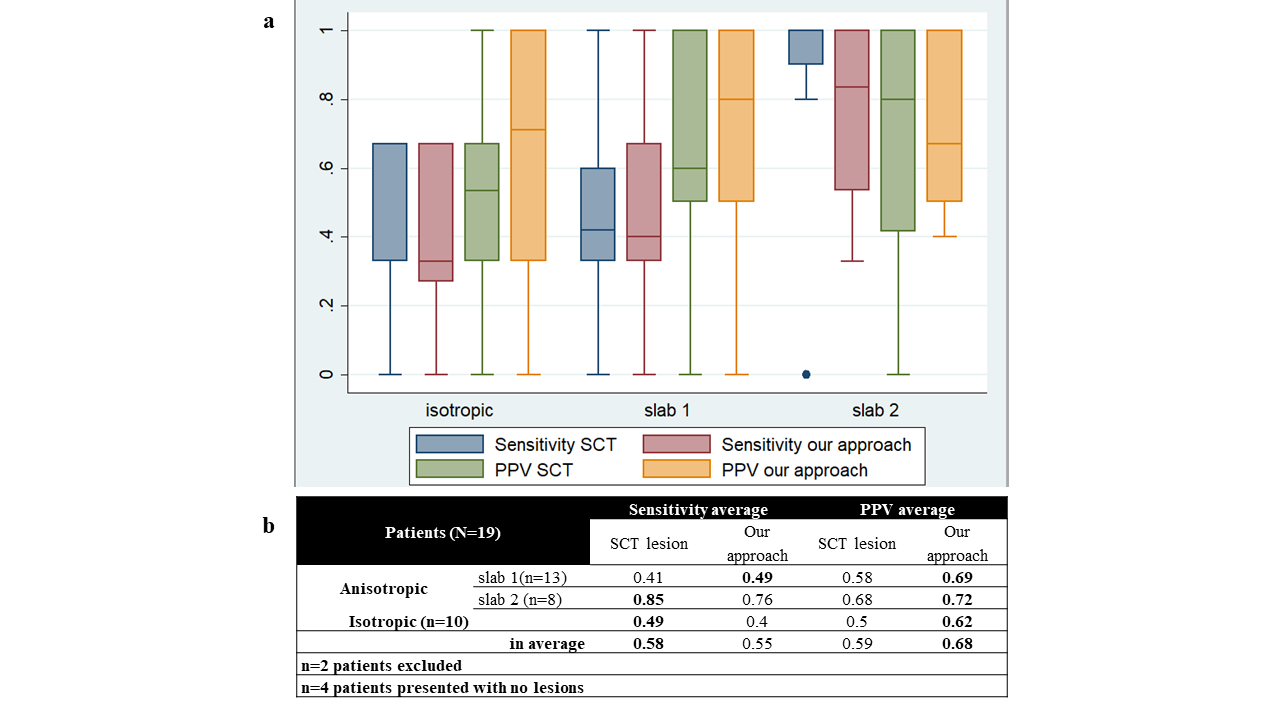
#1 - Added value of 7T MP2RAGE for lesion detection as compared to 3T Fig.2a summarizes the main results obtained for this exploratory cohort. In average, 3T_MP2RAGE detected more lesion than MAGNIMS+, in agreement with [5], and 7T_MP2RAGE sequences allowed to detect more lesions than 3T_MP2RAGE (e.g. Fig2b). Except for 1 patient, 7T high in-plane resolution performed slightly better than isotropic resolution (43 lesions detected versus 39 in n=9 patients). #2 – Automatic 7T MP2RAGE lesion segmentation In the test on DS1, a 0.48 average Dice was obtained for both methods (SCT lesion segmentation and our method). Sensitivity and positive predictive value (PPV) values obtained for DS2 test are illustrated in Fig.4a and summarized in Fig.4b. Examples of 2D and 3D lesion segmentations are presented in Fig. 3 in the DS2 database. For patients without lesion (Fig.3d), the algorithms detected false positive lesion preferentially located in the central canal (CSF with enhanced intensity), and artefacted areas.DISCUSSION / CONCLUSION
7T MRI systems bring new possibilities and advantages over 3T MRI systems for imaging the spinal cord, thanks to improved SNR, better spatial resolution and better detection of anatomical and pathological features [7], [17–19]. In this exploratory study, 7T_MP2RAGE imaging allowed detecting ~20-to-30% of additional lesion as compared to 3T_MP2RAGE, in agreement with previous observations performed using different contrasts (3T_T2w/7T_T2*w) [7]. We also demonstrated that both conventional and new models, trained at 3T are not optimal to detect lesions on images acquired at 7T. Our method (presenting higher PPV but slightly lower sensitivity (fig. 3)) is currently biased since it does not include inter-rater manual segmentation[9]. Moreover, and more importantly, as shown with patients without lesion (Fig.3d, resolution and contrasts matter, a method based on a 7T data is thus required. In that perspective, 7T data should be manually segmented, and the cohort should be increased.Acknowledgements
ARSEP, NeuroSchool, A*midexReferences
[1] H. Lassmann, ‘Multiple Sclerosis Pathology’, Cold Spring Harb. Perspect. Med., vol. 8, no. 3, Mar. 2018, doi: 10.1101/cshperspect.a028936.
[2] A. J. Thompson et al., ‘Diagnosis of multiple sclerosis: 2017 revisions of the McDonald criteria’, Lancet Neurol., vol. 17, no. 2, pp. 162–173, Feb. 2018, doi: 10.1016/S1474-4422(17)30470-2.
[3] U. Macar, E. N. Karthik, C. Gros, A. Lemay, and J. Cohen-Adad, ‘Team NeuroPoly: Description of the Pipelines for the MICCAI 2021 MS New Lesions Segmentation Challenge’, p. 7.
[4] W. J. Brownlee et al., ‘Early imaging predictors of long-term outcomes in relapse-onset multiple sclerosis’, Brain J. Neurol., vol. 142, no. 8, pp. 2276–2287, Aug. 2019, doi: 10.1093/brain/awz156.
[5] S. Demortière, P. Lehmann, J. Pelletier, B. Audoin, and V. Callot, ‘Improved Cervical Cord Lesion Detection with 3D-MP2RAGE Sequence in Patients with Multiple Sclerosis’, AJNR Am. J. Neuroradiol., vol. 41, no. 6, pp. 1131–1134, Jun. 2020, doi: 10.3174/ajnr.A6567.
[6] R. Ouellette et al., ‘7 T imaging reveals a gradient in spinal cord lesion distribution in multiple sclerosis’, p. 15.
[7] A. N. Dula et al., ‘Magnetic Resonance Imaging of the Cervical Spinal Cord in Multiple Sclerosis at 7T’, Mult. Scler. Houndmills Basingstoke Engl., vol. 22, no. 3, pp. 320–328, Mar. 2016, doi: 10.1177/1352458515591070.
[8] C. Gros et al., ‘Automatic segmentation of the spinal cord and intramedullary multiple sclerosis lesions with convolutional neural networks’, NeuroImage, vol. 184, pp. 901–915, Jan. 2019, doi: 10.1016/j.neuroimage.2018.09.081.
[9] O. Vincent, C. Gros, J. P. Cohen, and J. Cohen-Adad, ‘Automatic segmentation of spinal multiple sclerosis lesions: How to generalize across MRI contrasts?’, ArXiv200304377 Cs Eess, Jun. 2020, Accessed: May 25, 2022. [Online]. Available: http://arxiv.org/abs/2003.04377
[10] A. Massire, H. Rasoanandrianina, M. Guye, and V. Callot, ‘Anterior fissure, central canal, posterior septum and more: New insights into the cervical spinal cord gray and white matter regional organization using T1 mapping at 7T’, NeuroImage, vol. 205, p. 116275, Jan. 2020, doi: 10.1016/j.neuroimage.2019.116275.
[11] H. Rasoanandrianina et al., ‘Regional T1 mapping of the whole cervical spinal cord using an optimized MP2RAGE sequence’, NMR Biomed., vol. 32, no. 11, p. e4142, Nov. 2019, doi: 10.1002/nbm.4142.
[12] A. Massire, M. Taso, P. Besson, M. Guye, J.-P. Ranjeva, and V. Callot, ‘High-resolution multi-parametric quantitative magnetic resonance imaging of the human cervical spinal cord at 7T’, NeuroImage, vol. 143, pp. 58–69, Dec. 2016, doi: 10.1016/j.neuroimage.2016.08.055.
[13] B. De Leener et al., ‘SCT: Spinal Cord Toolbox, an open-source software for processing spinal cord MRI data’, NeuroImage, vol. 145, pp. 24–43, Jan. 2017, doi: 10.1016/j.neuroimage.2016.10.009.
[14] O. Ronneberger, P. Fischer, and T. Brox, ‘U-Net: Convolutional Networks for Biomedical Image Segmentation’. arXiv, May 18, 2015. doi: 10.48550/arXiv.1505.04597.
[15] Ö. Çiçek, A. Abdulkadir, S. S. Lienkamp, T. Brox, and O. Ronneberger, ‘3D U-Net: Learning Dense Volumetric Segmentation from Sparse Annotation’. arXiv, Jun. 21, 2016. Accessed: Jun. 30, 2022. [Online]. Available: http://arxiv.org/abs/1606.06650
[16] C. Gros et al., ‘ivadomed: A Medical Imaging Deep Learning Toolbox’, ArXiv201009984 Cs Eess, Oct. 2020, Accessed: May 25, 2022. [Online]. Available: http://arxiv.org/abs/2010.09984
[17] R. L. Barry, S. J. Vannesjo, S. By, J. C. Gore, and S. A. Smith, ‘Spinal cord MRI at 7T’, NeuroImage, vol. 168, pp. 437–451, Mar. 2018, doi: 10.1016/j.neuroimage.2017.07.003.
[18] V. Callot, A. Massire, M. Guye, S. Attarian, and A. Verschueren, ‘Visualization of Gray Matter Atrophy and Anterior Corticospinal Tract Signal Hyperintensity in Amyotrophic Lateral Sclerosis Using 7T MRI’, Neurology, vol. 96, no. 23, pp. 1094–1095, Jun. 2021, doi: 10.1212/WNL.0000000000012072.
[19] J. Cohen-Adad, W. Zhao, L. L. Wald, and A. L. Oaklander, ‘7T MRI of spinal cord injury’, Neurology, vol. 79, no. 22, p. 2217, Nov. 2012, doi: 10.1212/WNL.0b013e31827597ae.
[20] F. Pérez-García, R. Sparks, and S. Ourselin, ‘TorchIO: a Python library for efficient loading, preprocessing, augmentation and patch-based sampling of medical images in deep learning’, Comput Methods Programs Biomed, 2021, doi: 10.1016/j.cmpb.2021.106236.
Figures