0568
Effects of MT-weighting, respiratory navigation, and biological variables on multi-echo gradient echo signal and contrast in the lumbar cord1Vanderbilt University Institute of Imaging Science, Vanderbilt University Medical Center, Nashville, TN, United States, 2Department of Radiology and Radiological Sciences, Vanderbilt University Medical Center, Nashville, TN, United States, 3Department of Biomedical Engineering, Vanderbilt University, Nashville, TN, United States, 4Department of Biostatistics, Vanderbilt University Medical Center, Nashville, TN, United States, 5Philips, Nashville, TN, United States, 6Department of Neurology, Vanderbilt University Medical Center, Nashville, TN, United States
Synopsis
Keywords: Spinal Cord, Multiple Sclerosis, lumbar spinal cord
Improvements are needed in advanced anatomical imaging of the lumbar spinal cord. We implemented a T2*-weighted multi-echo gradient echo (mFFE) sequence that enables visualization of CSF, gray and white matter with an in-plane resolution of 0.65x0.65mm2. Use of an MT-weighted pre-pulse and a respiratory navigator decreased SNR, but did not affect CNR, and qualitatively improved image quality and possibly multiple sclerosis lesion conspicuity. CNR/SNR were robust to biological factors known to affect signal quality (e.g. age, weight). The proposed sequence holds potential for improved visualization of anatomy, pathology, and morphometric measurements in the lumbar cord.Introduction
The spinal cord (SC) is critically involved in the progression of neurological disabilities in multiple sclerosis (MS), and many cervical SC MRI studies have shown extensive disease burden.1-5 The thoracolumbar spinal cord (TLSC) remains understudied despite knowledge that ~40% of SC lesions are found in the TLSC.6 We aim to address this gap by optimizing a multi-echo gradient echo (mFFE) sequence for the TLSC targeting the challenges of respiration artifacts and poor GM:WM contrast.7 Multi-echo gradient echo sequences are widely used in the cervical SC, but few studies translate them to the TLSC.8, 9 Here, we optimized an mFFE sequence for the lumbar enlargement and modified it with magnetization transfer (MT) weighting and respiratory navigation to evaluate the effects of these strategies on signal-to-noise ratio (SNR) and GM:WM contrast-to-noise ratio (CNR). Due to known age and sex differences in SC morphometry10, 11 and observed image quality variability, biological factors were included in analyses.Methods
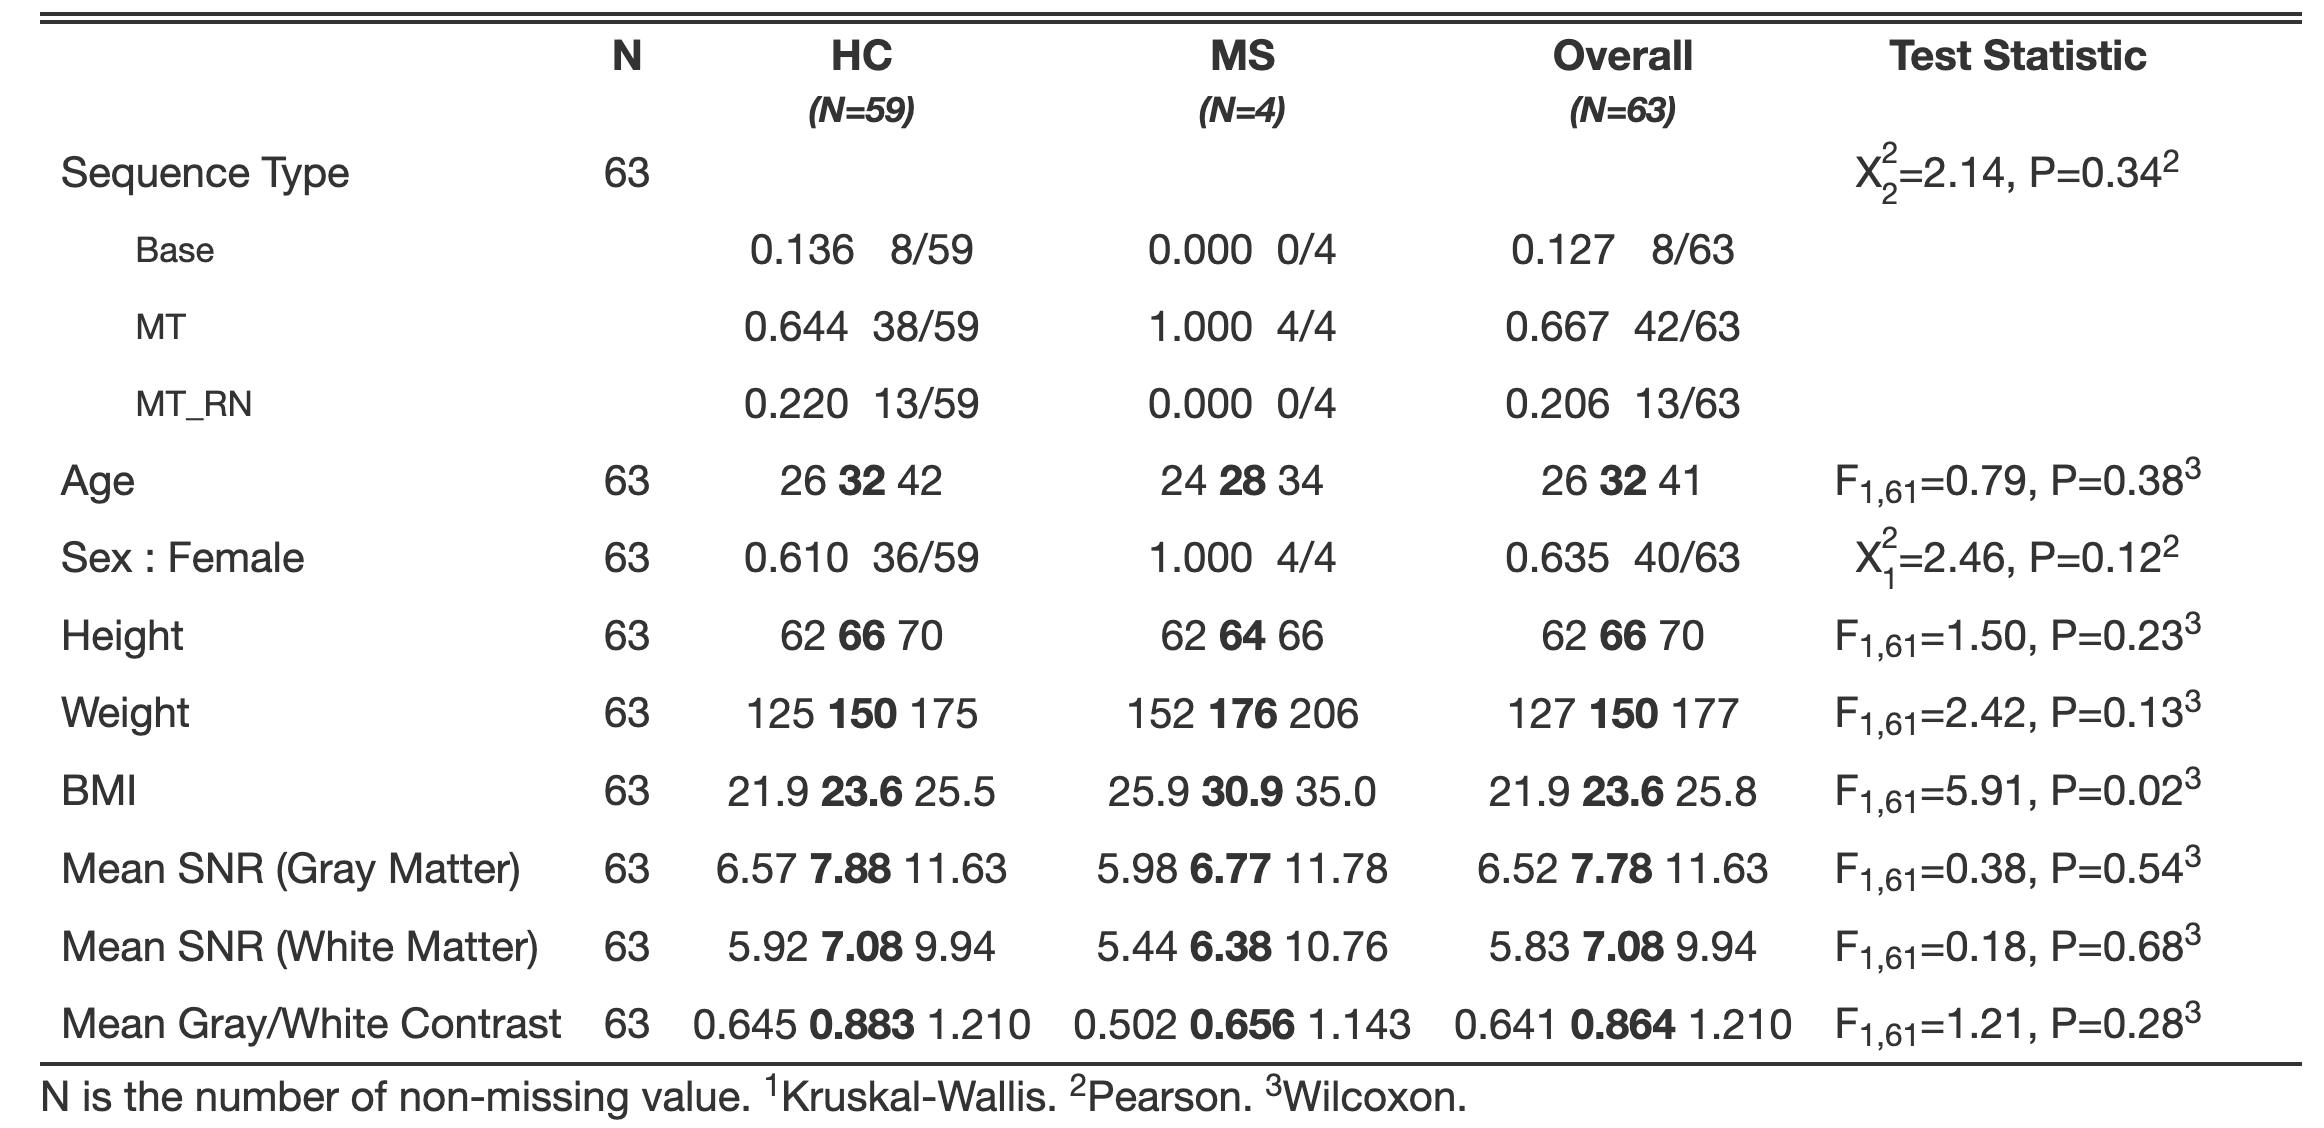
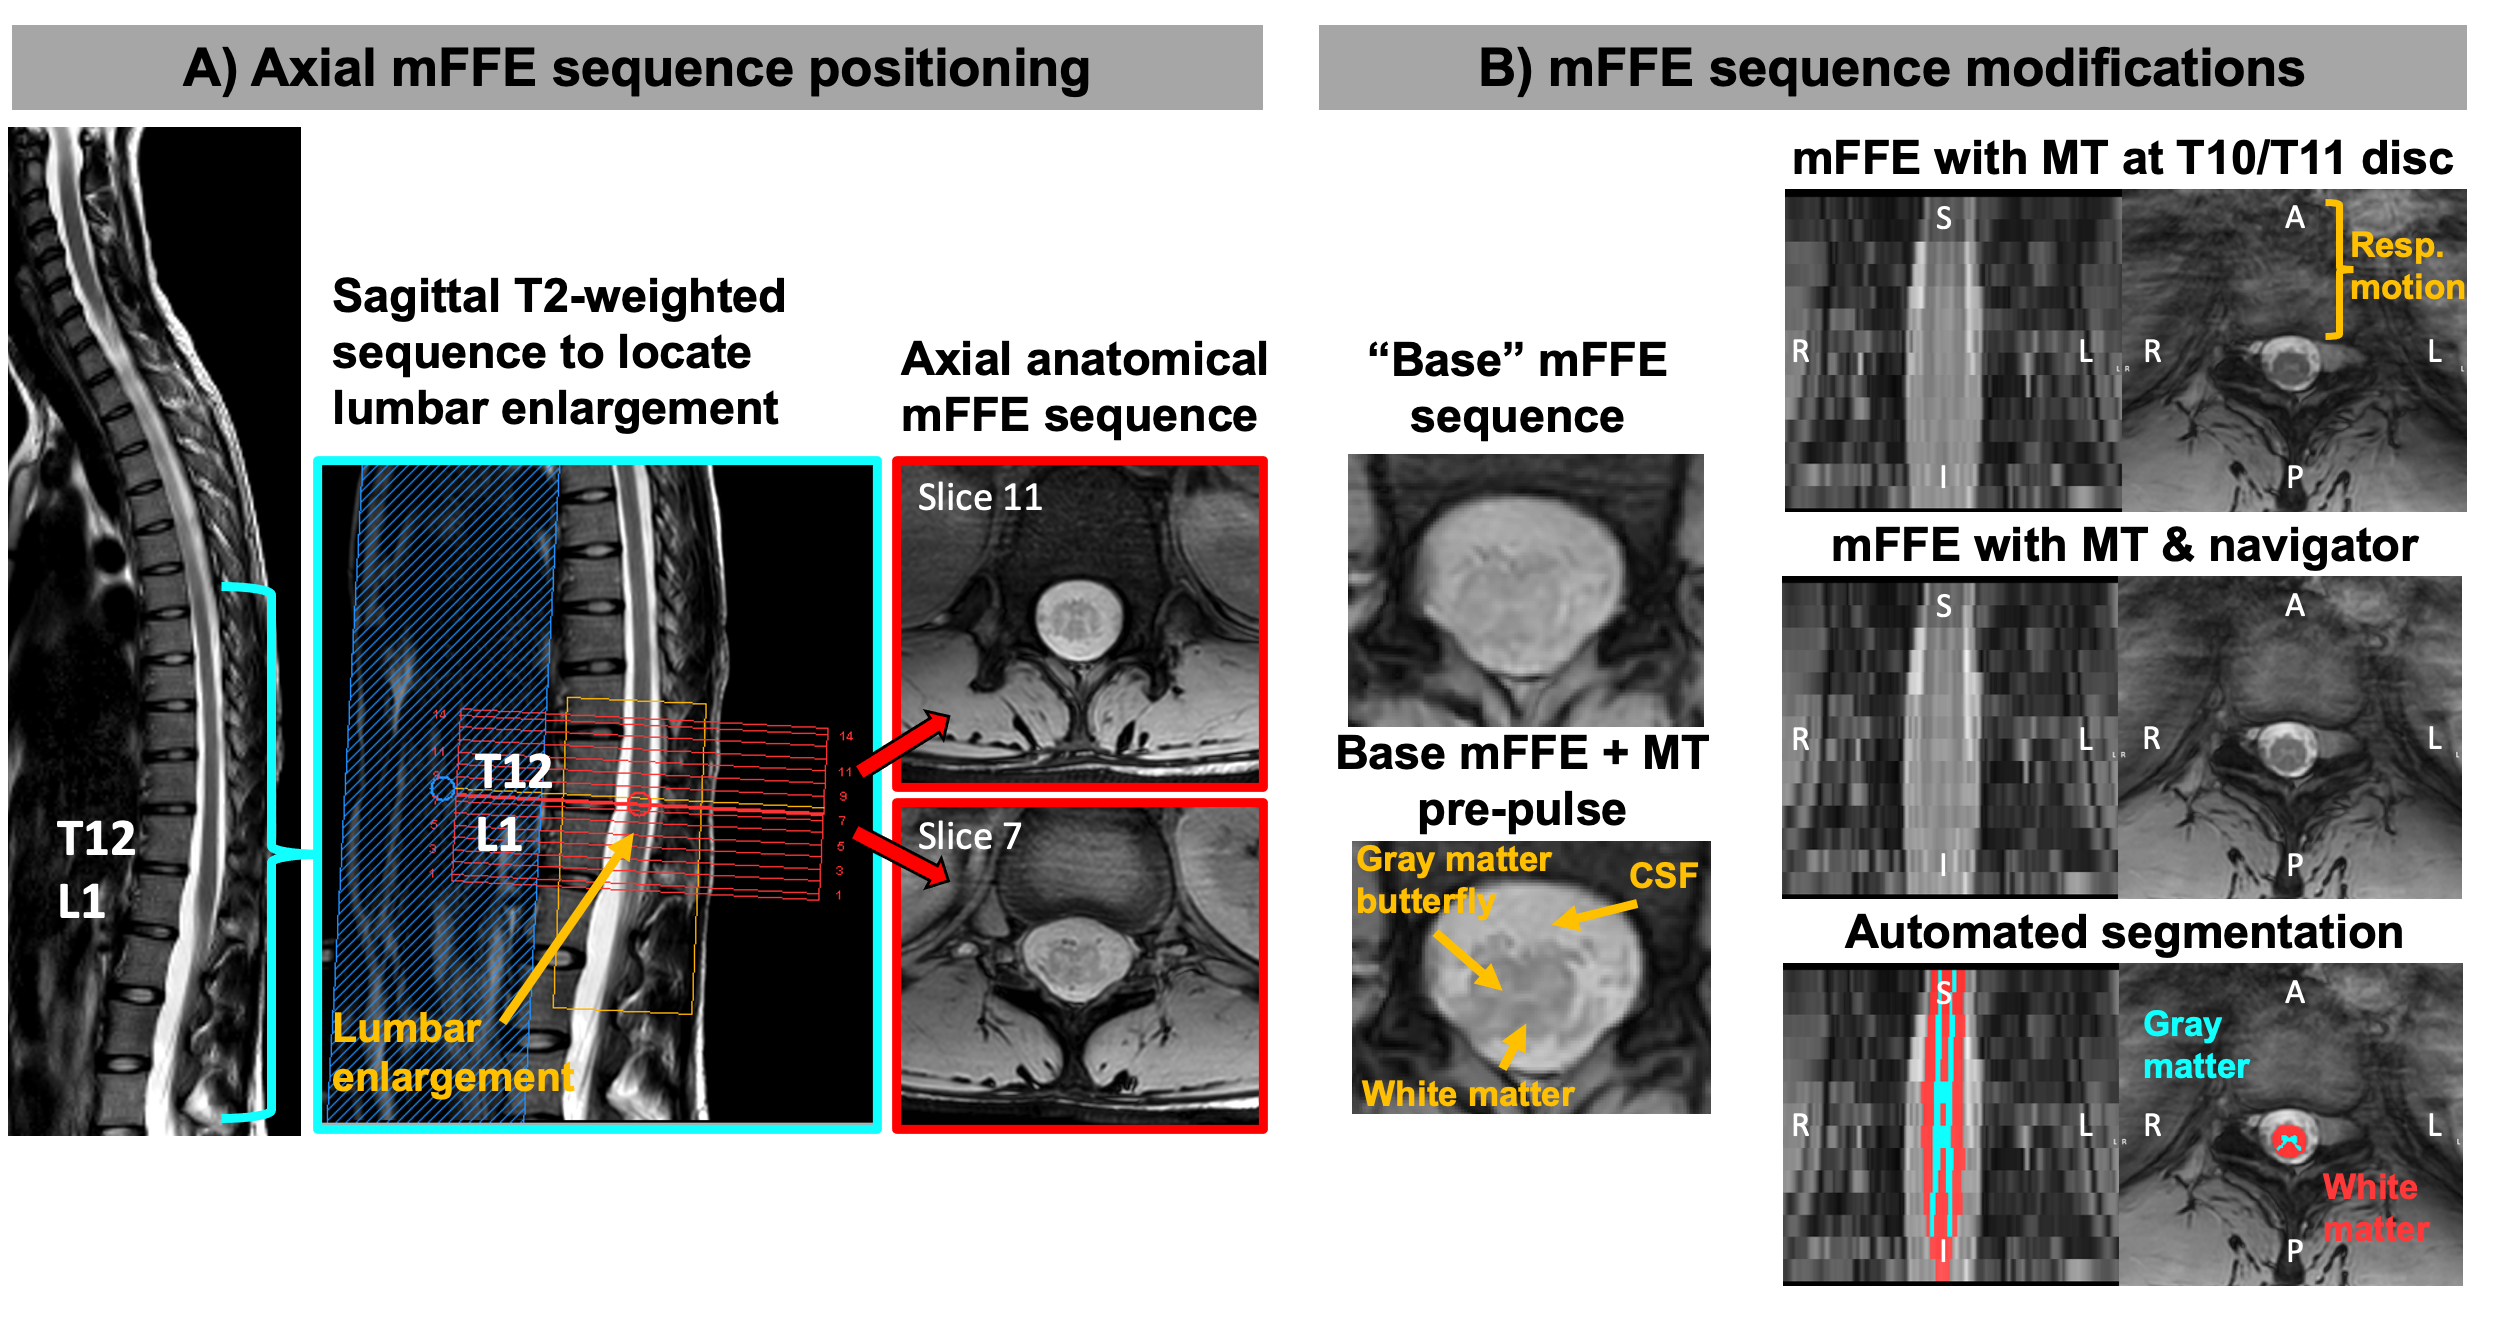
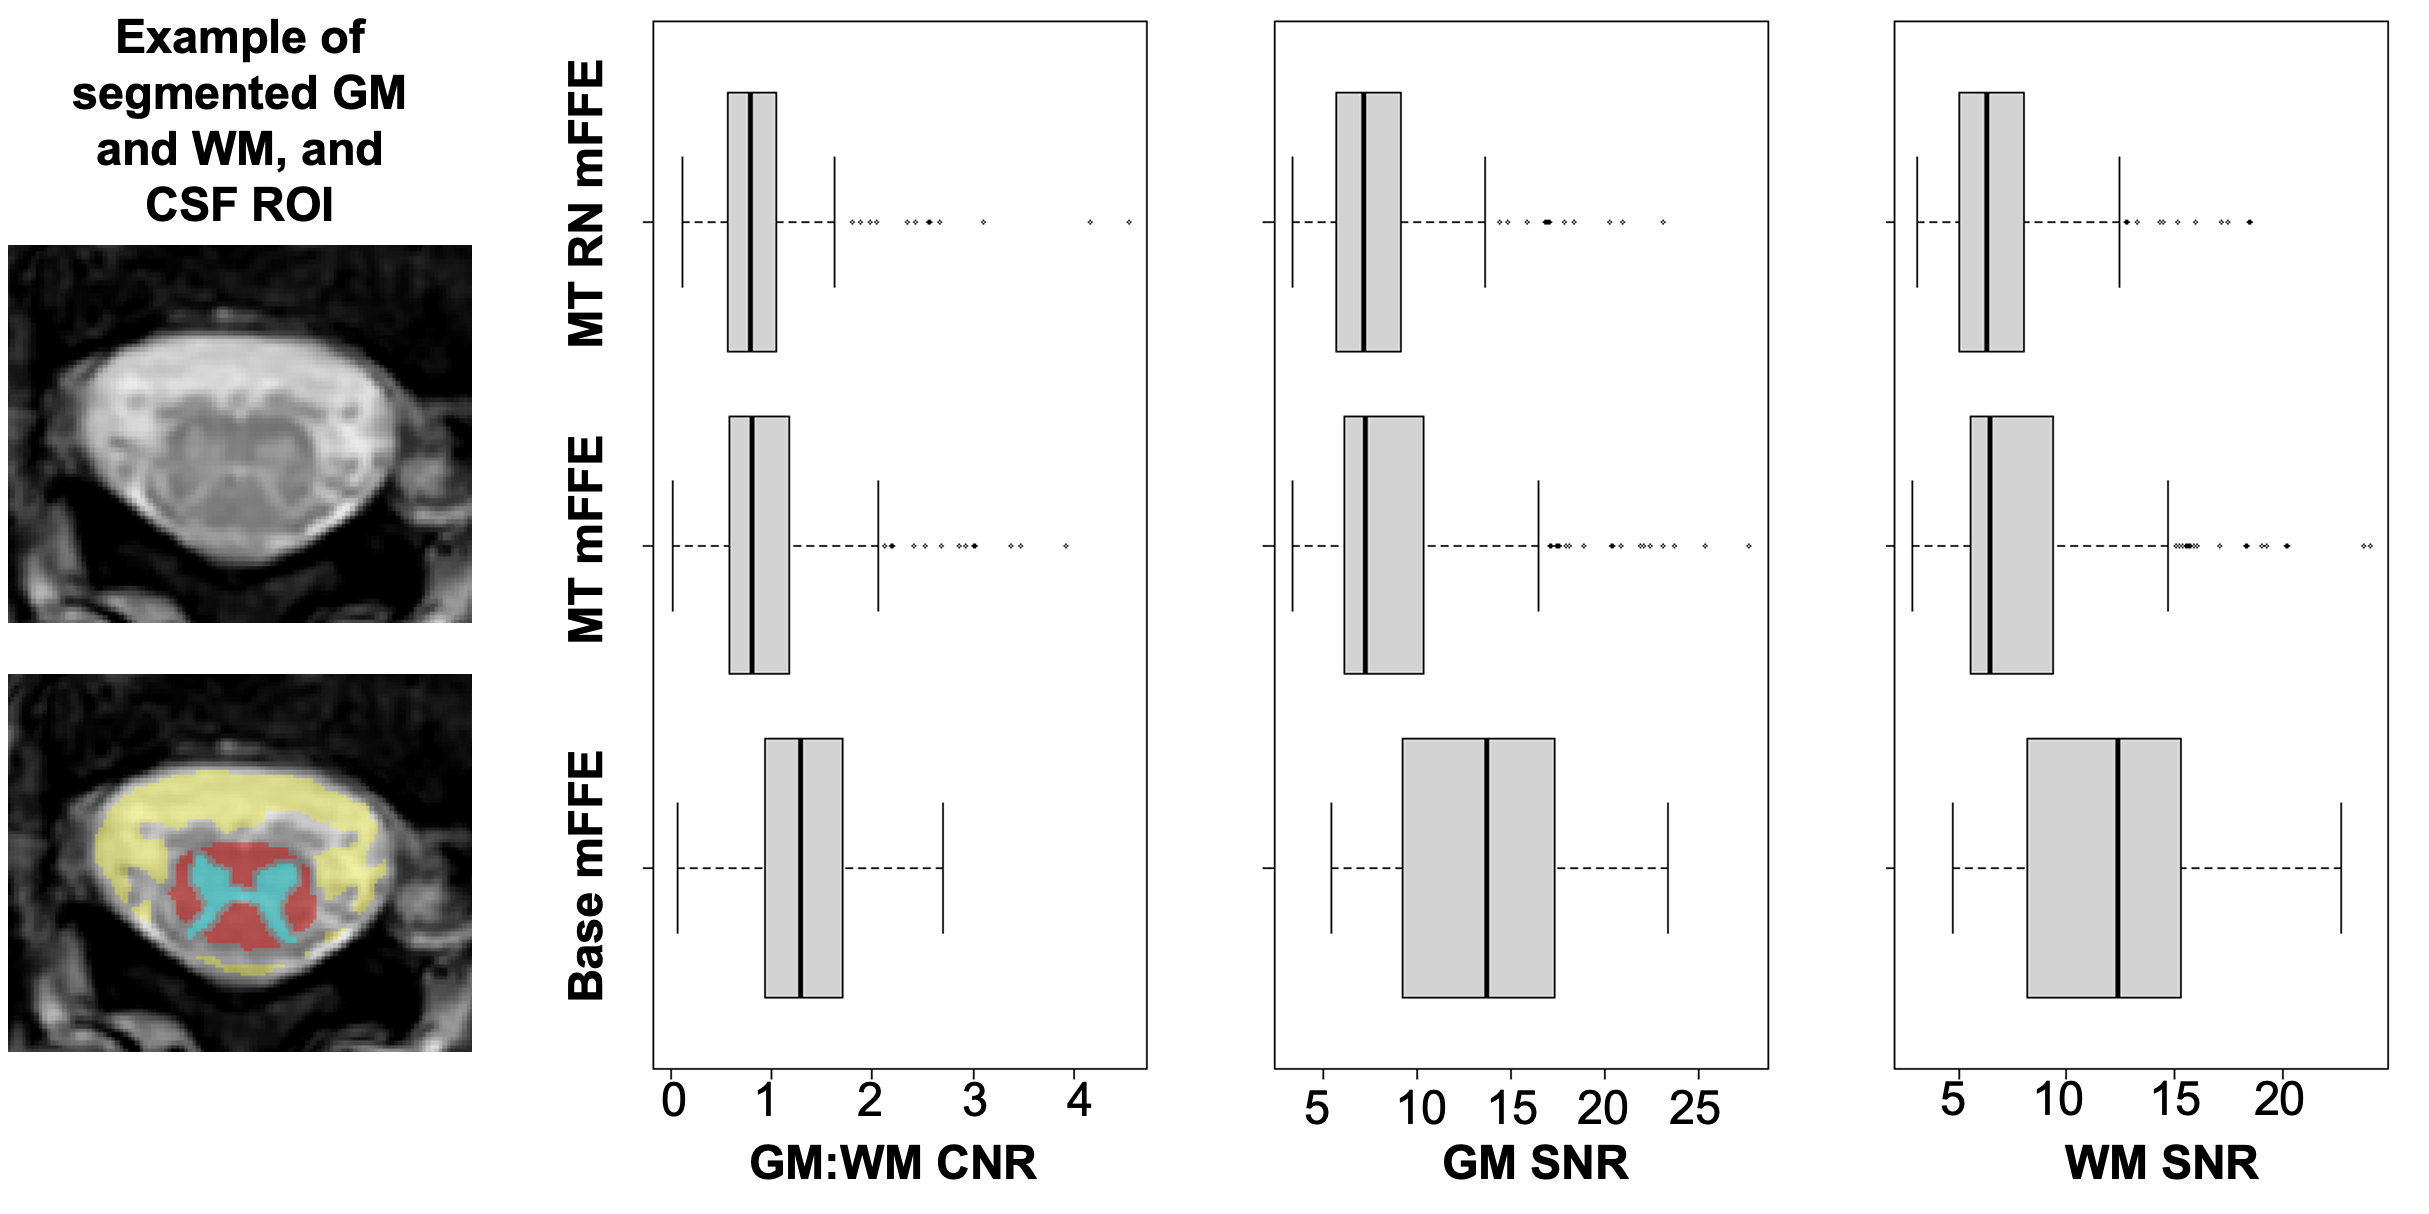
Participants provided informed consent in accordance with the IRB. MRI data were acquired on a 3T Philips dStream Ingenia scanner with a dual channel body coil (transmission) and a 12-channel in-couch SC array (receive). Axial mFFE acquisitions were centered at the lumbar enlargement (Figure 1A) in 53 healthy volunteers (32F/21M) and 4 patients with relapsing-remitting MS (4F). Each participant was scanned with one or more mFFE sequences: 1) “base” mFFE: TR/TE1/∆TE/𝛼 = 700ms/6.4ms/7.0ms/43°, FOV=150x150mm2, 14 slices, 0.65x0.65x5mm3 acquired resolution (reconstructed to 0.29x0.29x5mm3), NSA=3, scan time 6:07min; 2) “MT” mFFE: base plus MT-weighted pre-pulse (16ms duration, 600° flip angle, 5kHz offset), TR=938ms, scan time 8min; 3) “MT RN” mFFE: same as MT mFFE plus respiratory navigator, resulting in scan time of ~8-15min depending on respiration rate and navigator efficiency. Ten healthy volunteers were scanned twice to assess scan-rescan reliability. Summary statistics for mFFE type, biological variables, and SNR and CNR metrics are in Table 1.The SC and GM were segmented using Spinal Cord Toolbox, and masks manually corrected if necessary.12 CSF ROIs were derived with an automated intensity thresholding-based procedure. WM masks were computed by subtracting GM from cord masks. SNR was calculated slicewise as mean signal in GM (or WM) divided by the standard deviation of signal in CSF (noise). STD(CSF) was defined as noise rather than STD(GM) or STD(WM) to avoid including signal variability due to true features such as MS lesions. GM:WM CNR was defined as |SNR_GM – SNR_WM|.
We fit separate linear mixed effects models on the outcomes of interest: GM:WM CNR, GM SNR, and WM SNR. All biological covariates were included as nuisance variables, with mFFE sequence type as the variable of interest. A nonlinear slice effect was included to account for slice differences. Random intercepts for participant and scan ID were included to account for the correlation structure of the data. To test scan-rescan reliability, we averaged CNR and SNR over slices 4-11 in each scan for all healthy volunteers. Again, three separate models were fit (foregoing the random intercept for scan ID). We calculated the intra-class correlation (ICC) and constructed 95% bootstrapped confidence intervals for each model.
Results
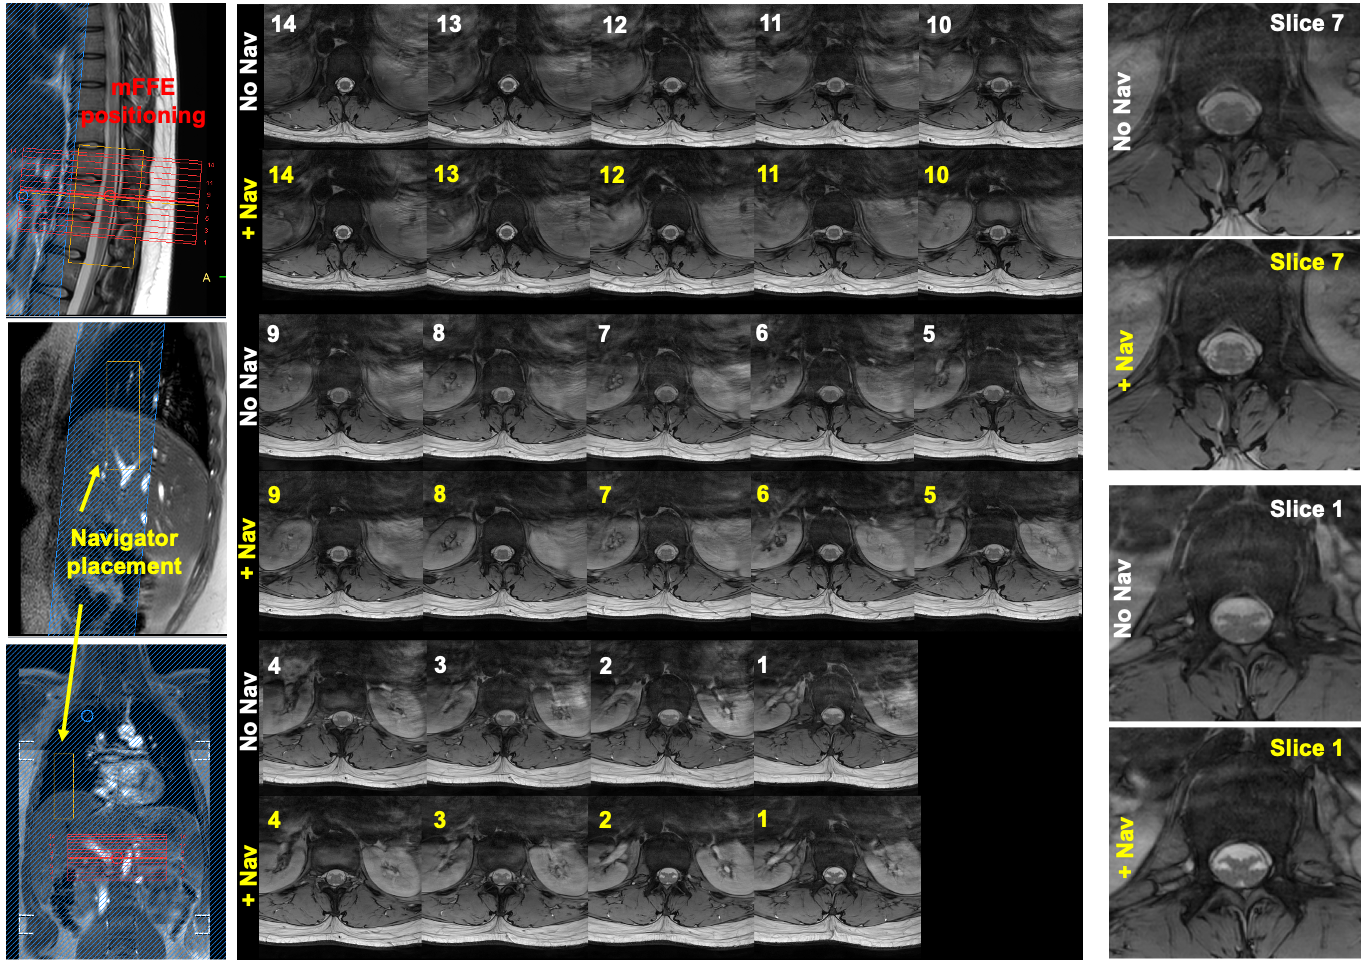
Figure 1 shows positioning of the mFFE and examples of the modifications made to the “base” mFFE.Figure 2 shows respiratory navigator positioning and mFFEs acquired without/with the navigator in a healthy volunteer. Two example slices highlight improved intra-cord contrast achieved with the navigator.
Figure 3 shows boxplots of CNR and SNR across all slices and scans. There were no significant effects of mFFE sequence or biological variables on CNR. Slice effects were significant for both CNR and SNR (p<0.0001), likely due to variations in artifact severity related to distance of a given slice from the lungs. Biological variables did not have a significant effect on GM or WM SNR. The MT pre-pulse significantly decreased GM and WM SNR relative to the base mFFE (p<0.001). Scan-rescan analyses resulted in ICC estimates of 0.410, 0.520, and 0.522 for GM:WM CNR, GM SNR, and WM SNR, respectively, suggesting moderate correlations for the 10 repeat participants.
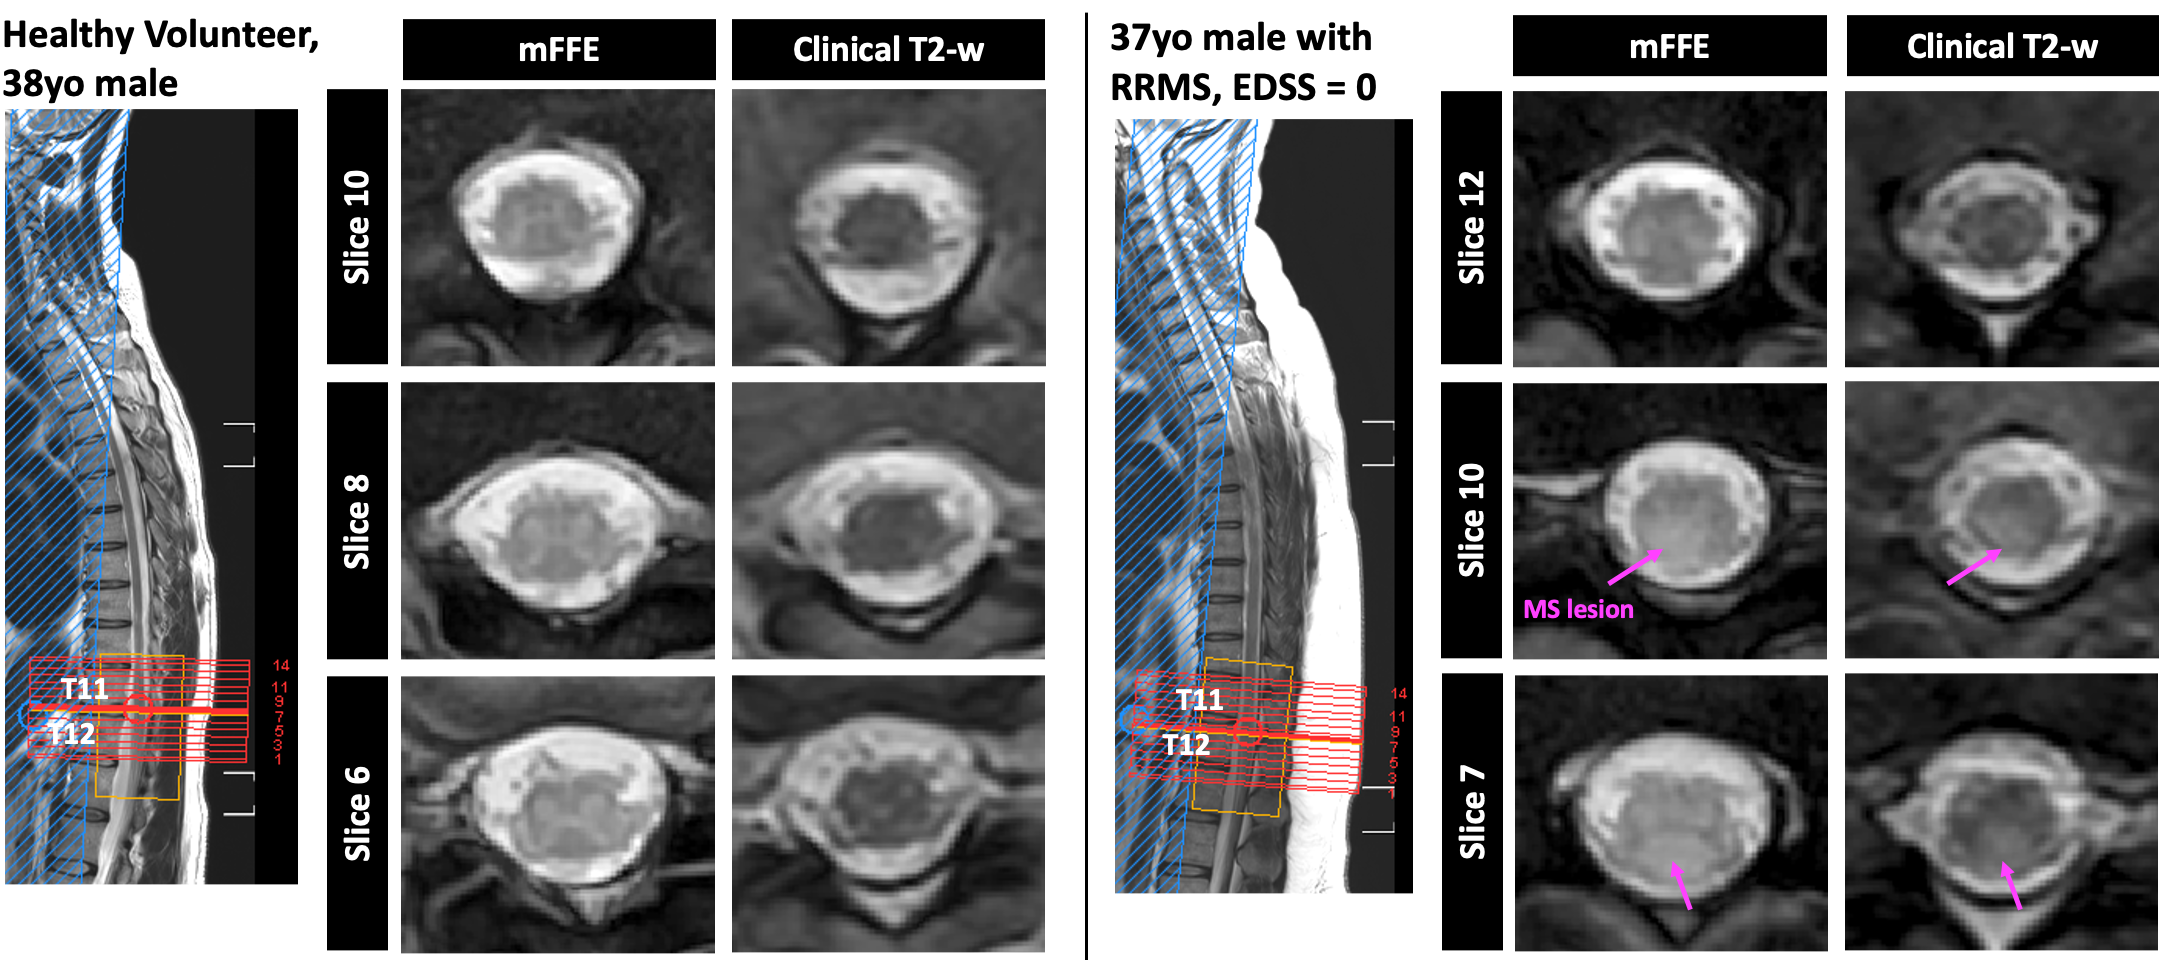
Even with decreased SNR, the MT mFFE shows good GM:WM contrast in the lumbar enlargement, especially in comparison to a clinical T2-weighted sequence as shown for a healthy volunteer and a patient with MS (Figure 4). Additionally, an MS lesion is more conspicuous in the MT-weighted mFFE.
Discussion
While we observed qualitative improvements in GM:WM contrast and artifact reduction on an individual-scan basis with the MT pre-pulse and respiratory navigator, these modifications did not influence CNR across the whole cohort. The decreases in SNR with the MT pre-pulse are expected given that an MT pulse saturates macromolecular protons, thus lowering mean signal in GM and WM, while STD(CSF) is not affected. Because WM has greater myelin content than GM, we expect it to be more sensitive to the MT pulse; however, CNR did not significantly change. Despite this observation in a primarily healthy cohort, the potential for the MT pre-pulse to enhance contrast of pathology such as MS lesions is an area of ongoing investigation. In future work, we will also consider WM:CSF CNR, variability in coil-to-SC distance, and additional mFFE-derived metrics such as cord and GM cross-sectional areas.Acknowledgements
The authors thank all study participants, the Vanderbilt University Institute of Imaging Science (VUIIS) Center for Human Imaging, and the VUIIS MRI technologists. This work was supported in part by funding from the National Institutes of Health under award numbers K01EB030039 (K.P.O.), 5R01NS109114 (S.A.S.), and 5R01NS117816 (S.A.S.).References
1. Gass A, Rocca MA, Agosta F, et al. MRI monitoring of pathological changes in the spinal cord in patients with multiple sclerosis. The Lancet Neurology 2015; 14: 443-454. DOI: 10.1016/S1474-4422(14)70294-7.
2. By S, Barry RL, Smith AK, et al. Amide proton transfer CEST of the cervical spinal cord in multiple sclerosis patients at 3T. Magnetic resonance in medicine 2017. DOI: 10.1002/mrm.26736.
3. By S, Xu J, Box BA, et al. Application and evaluation of NODDI in the cervical spinal cord of multiple sclerosis patients. NeuroImage Clinical 2017; 15: 333-342. DOI: 10.1016/j.nicl.2017.05.010.
4. Conrad BN, Barry RL, Rogers BP, et al. Multiple sclerosis lesions affect intrinsic functional connectivity of the spinal cord. Brain : a journal of neurology 2018; 141: 1650-1664. DOI: 10.1093/brain/awy083.
5. Dula AN, Pawate S, Dortch RD, et al. Magnetic resonance imaging of the cervical spinal cord in multiple sclerosis at 7T. Multiple sclerosis 2016; 22: 320-328. DOI: 10.1177/1352458515591070.
6. Filippi M, Rocca MA, Ciccarelli O, et al. MRI criteria for the diagnosis of multiple sclerosis: MAGNIMS consensus guidelines. The Lancet Neurology 2016; 15: 292-303. DOI: 10.1016/S1474-4422(15)00393-2.
7. Smith SA, Edden RA, Farrell JA, et al. Measurement of T1 and T2 in the cervical spinal cord at 3 tesla. Magnetic resonance in medicine 2008; 60: 213-219. DOI: 10.1002/mrm.21596.
8. Bueler S, Yiannakas MC, Damjanovski Z, et al. Optimized multi-echo gradient-echo magnetic resonance imaging for gray and white matter segmentation in the lumbosacral cord at 3 T. Sci Rep 2022; 12: 16498. 2022/10/04. DOI: 10.1038/s41598-022-20395-1.
9. Vallotton K, David G, Hupp M, et al. Tracking White and Gray Matter Degeneration along the Spinal Cord Axis in Degenerative Cervical Myelopathy. J Neurotrauma 2021; 38: 2978-2987. 2021/07/10. DOI: 10.1089/neu.2021.0148.
10. Papinutto N, Schlaeger R, Panara V, et al. Age, gender and normalization covariates for spinal cord gray matter and total cross-sectional areas at cervical and thoracic levels: A 2D phase sensitive inversion recovery imaging study. PloS one 2015; 10: e0118576. DOI: 10.1371/journal.pone.0118576.
11. Yanase M, Matsuyama Y, Hirose K, et al. Measurement of the cervical spinal cord volume on MRI. Journal of spinal disorders & techniques 2006; 19: 125-129. DOI: 10.1097/01.bsd.0000181294.67212.79.
12. De Leener B, Levy S, Dupont SM, et al. SCT: Spinal Cord Toolbox, an open-source software for processing spinal cord MRI data. NeuroImage 2017; 145: 24-43. DOI: 10.1016/j.neuroimage.2016.10.009.
Figures