0567
Application of multi-shot EPI to mitigate image distortion in diffusion tensor imaging of the human lumbar spinal cord1Vanderbilt University Institute of Imaging Science, Vanderbilt University Medical Center, Nashville, TN, United States, 2Department of Radiology and Radiological Sciences, Vanderbilt University Medical Center, Nashville, TN, United States, 3Department of Biomedical Engineering, Vanderbilt University, Nashville, TN, United States, 4Philips, Nashville, TN, United States
Synopsis
Keywords: Spinal Cord, Diffusion Tensor Imaging
The lumbar spinal cord is significantly understudied with quantitative MRI methods such as diffusion tensor imaging (DTI), in part due to challenges of spatial and temporally-varying field inhomogeneities that cause distortion in commonly used single-shot EPI sequences. In this pilot study, we implemented IRIS Zoom, a multi-shot, reduced field-of-view method that corrects for shot-to-shot variations, phase errors (2D navigation), and T2* dephasing. Multi-shot EPI was successfully acquired in healthy volunteers at 3T, led to reduced geometric distortions, and provided quantitative DTI values comparable to those derived from single-shot EPI. Multi-shot EPI is feasible for high-resolution DTI of the lumbar cord.Introduction
Diffusion-weighted MRI, including diffusion tensor imaging (DTI) and advanced diffusion models, have been implemented in the cervical spinal cord (SC) for over 10 years1, 2 and applied to study several pathologies including multiple sclerosis (MS),3, 4 acute traumatic injury,5 and SC infarct6. DTI provides 4 microstructurally-sensitive indices. Fractional Anisotropy (FA) is sensitive to sub-voxel tissue microstructure, and, in the cervical SC, distinguishes high and low disability in MS.3 Mean diffusivity (MD) reflects cytotoxic and vasogenic edema, and radial diffusivity (RD) and axial diffusivity (AD) relate to axonal and myelin integrity, also shown to relate to MS damage.3, 7 In contrast to the many diffusion studies performed in the cervical SC, very few have been applied to the lower SC despite the potential clinical and research impact.8 The most commonly used readout for diffusion MRI is single-shot EPI because it is fast and has high SNR efficiency; however, in the SC geometric distortions due to susceptibility differences of air, bone, and tissue confound EPI readouts.9 This challenge is greater in the thoracolumbar SC and distortion may vary between diffusion encodings due to respiration. We hypothesized that multi-shot methods that correct for shot-to-shot variations, phase errors (2D navigation), and T2* dephasing will reduce geometric distortions and improve high resolution DTI in the lower SC. To test this, we have applied single-shot EPI and multi-shot IRIS Zoom diffusion sequences in the lumbar SC of healthy volunteers.Methods
All participants provided informed consent in accordance with the local IRB. MRI data were acquired on a 3T Philips dStream Ingenia scanner with a dual channel body coil (transmission) and a 12-channel in-couch SC array (receive). DTI data were acquired in the axial plane centered at the SC lumbar enlargement (corresponding to vertebral levels ~T11-L1) in 5 healthy volunteers (4F/1M, mean age 32.4±9.2y). The single-shot EPI acquisition consisted of a cardiac-triggered, multi-slice spin echo sequence at 1.1x1.1x5mm3 resolution (14 slices), with b-value = 0, 750s/mm2, 15 gradient directions, TR/TE = 5 beats/57ms, NSA=3, and a heart rate-dependent scan time of ~6-10min. A series of b=0s/mm2 images with reverse phase encoding was acquired for post-processing eddy current correction. IRIS is a multi-shot EPI sequence with a 2D navigator acquired with each shot for motion and phase correction and reduced echo train length.10 IRIS Zoom combines a reduced field-of-view (FOV)9 with 2D navigator-based motion/phase correction for high-resolution diffusion MRI. The IRIS Zoom acquisition used the same resolution, b-value, and gradient directions as the single-shot sequence; parameters that differed were NSA (1 or 2) and TE=48ms. IRIS Zoom scan time was ~8-16min, depending on heart rate and NSA. A high resolution (0.65x0.65x5mm3) multi-echo, gradient echo (mFFE) image was acquired (TR/TE1/ΔTE=938/6.4/7.0ms) for registration and segmentation.Single-shot EPI diffusion-weighted images were corrected for B0 susceptibility distortions, motion, and eddy currents using the TOPUP and EDDY algorithms from the FSL toolbox.11 For IRIS Zoom data, slicewise motion correction was performed in Spinal Cord Toolbox (SCT).12 Segmentation, registration, DTI fitting, and metric extraction were performed in SCT.
Results
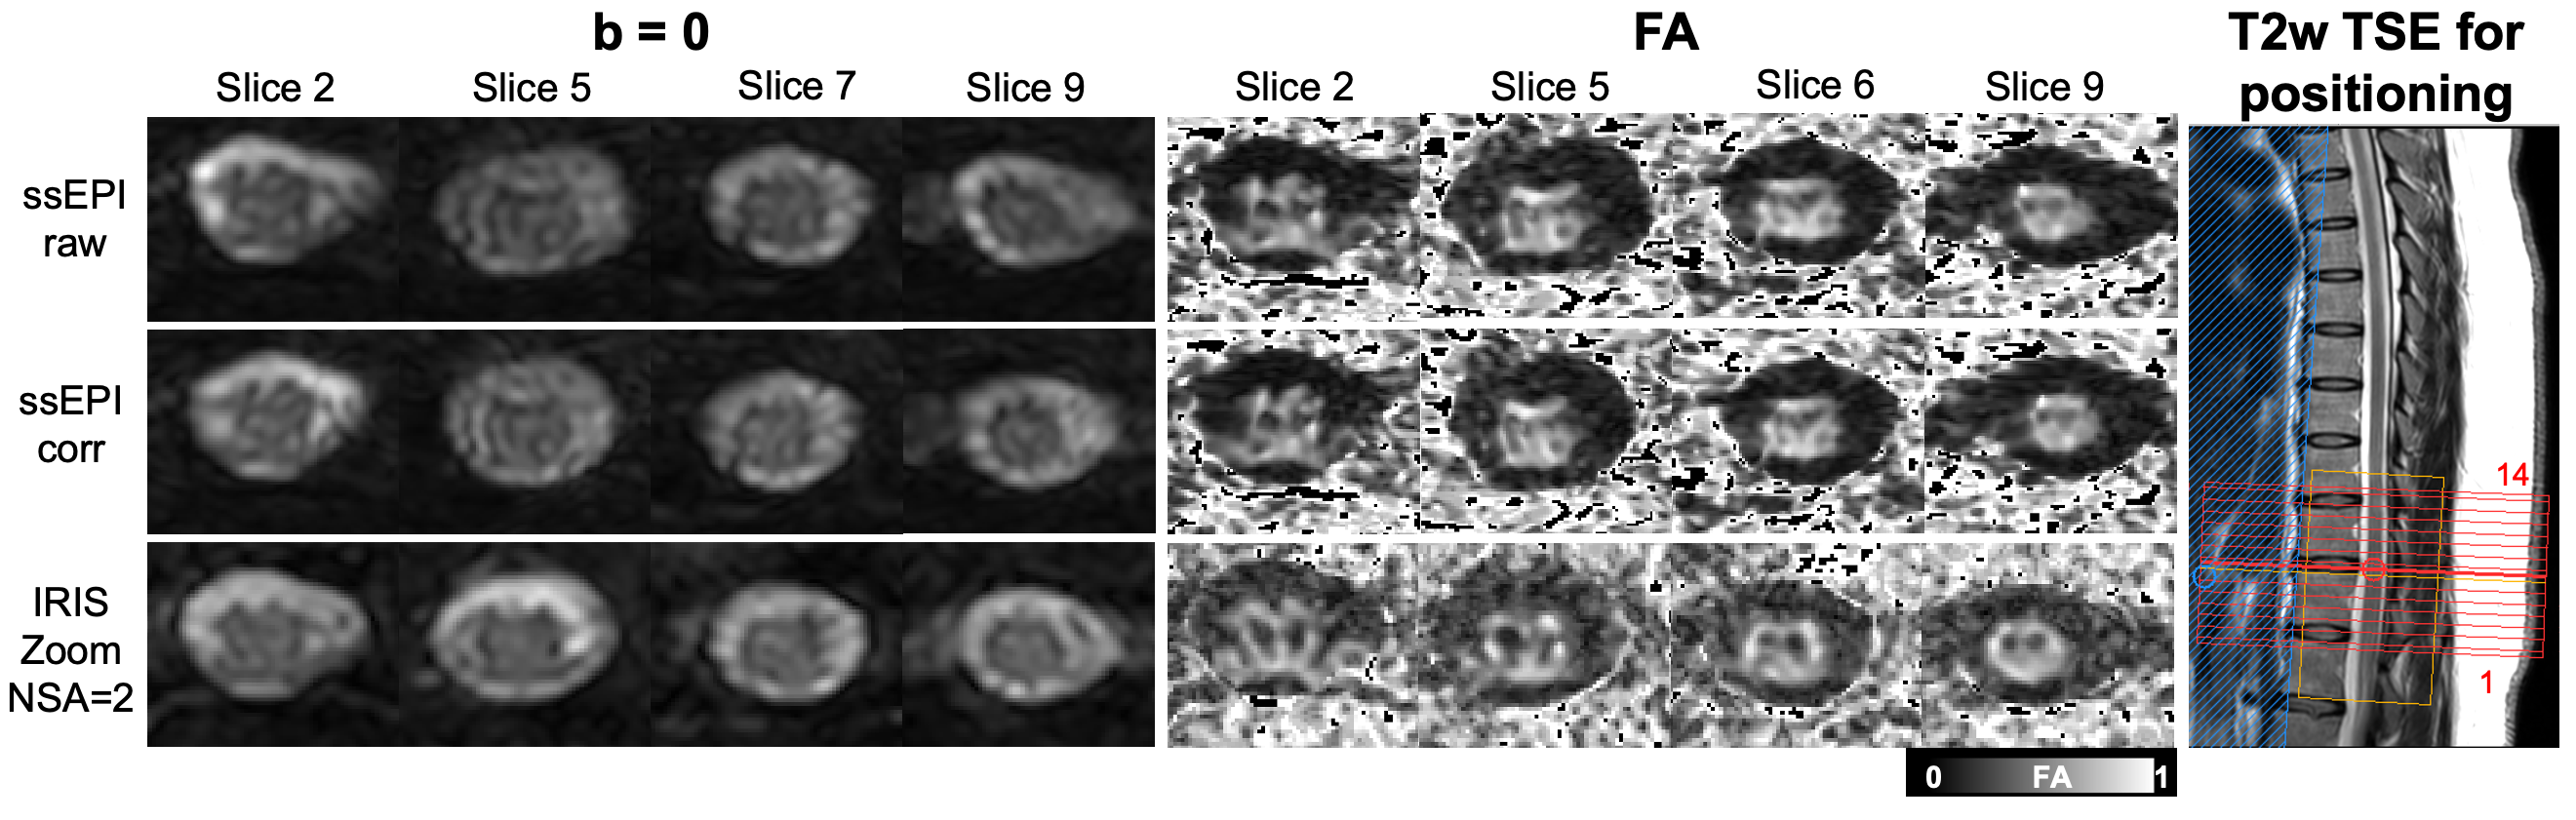
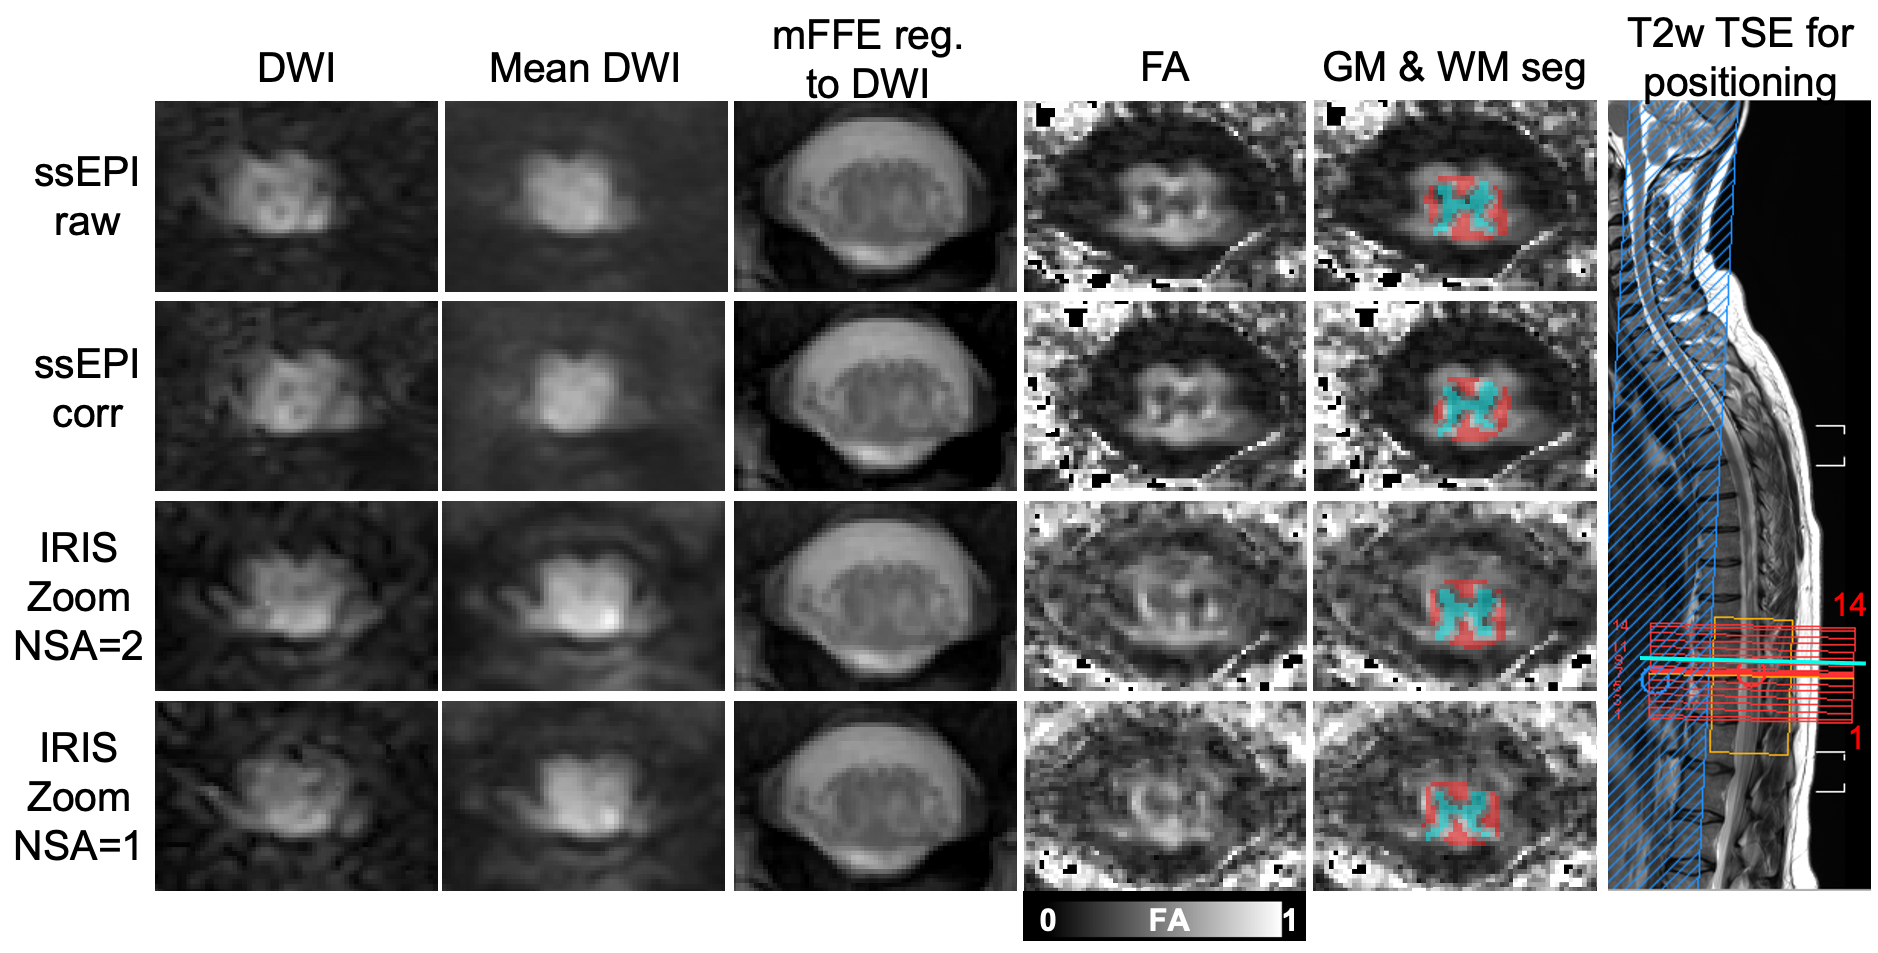
Figure 1 shows geometric distortion that is most prevalent in an uncorrected single-shot EPI acquisition. TOPUP and EDDY correction appears to reduce these distortions, but the gray matter butterfly is least distorted in the IRIS Zoom acquisition by qualitative observation.Figure 2 compares diffusion-weighted images and FA maps for the single-shot EPI and IRIS Zoom sequences (NSA=2 and NSA=1 for IRIS Zoom) in another subject. mFFE anatomical images and segmented tissue masks were registered to the mean diffusion-weighted images for each sequence. The gray matter butterfly structure can be visualized in all sequences in this example.
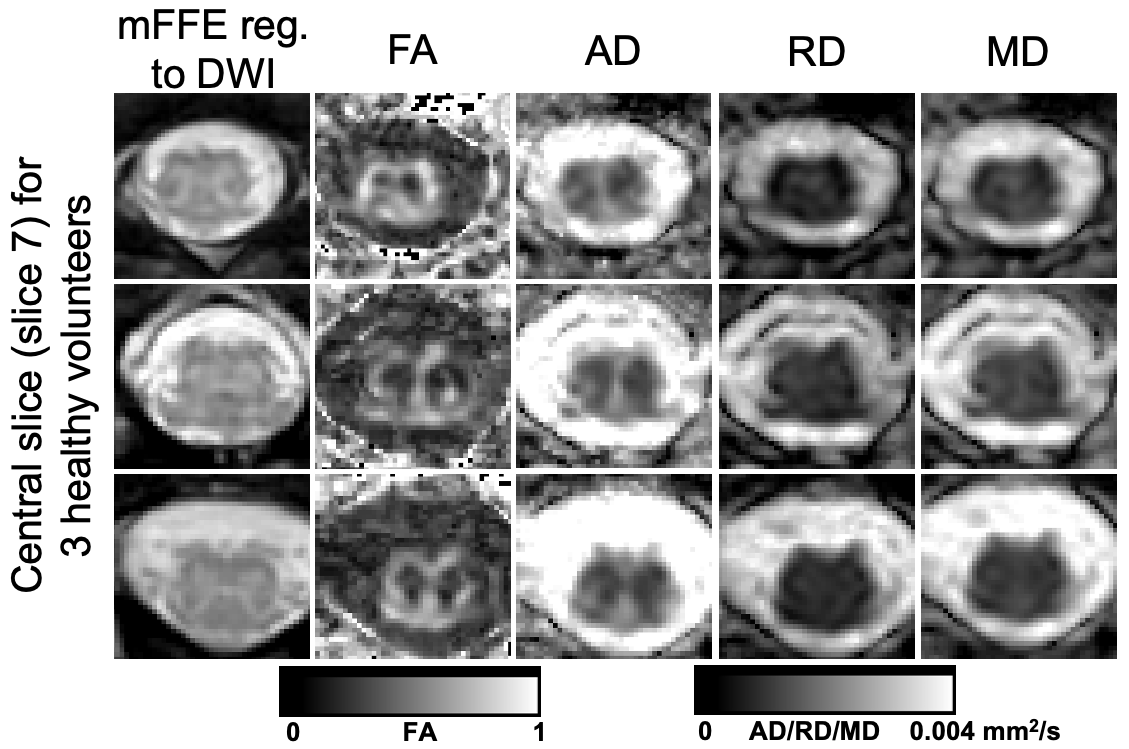
Representative DTI parameter maps for the IRIS Zoom sequence (NSA=2) are shown for 3 subjects in Figure 3. In this central slice for each individual, the gray matter structure has minimal distortion and parameter maps have expected gray/white matter contrast.
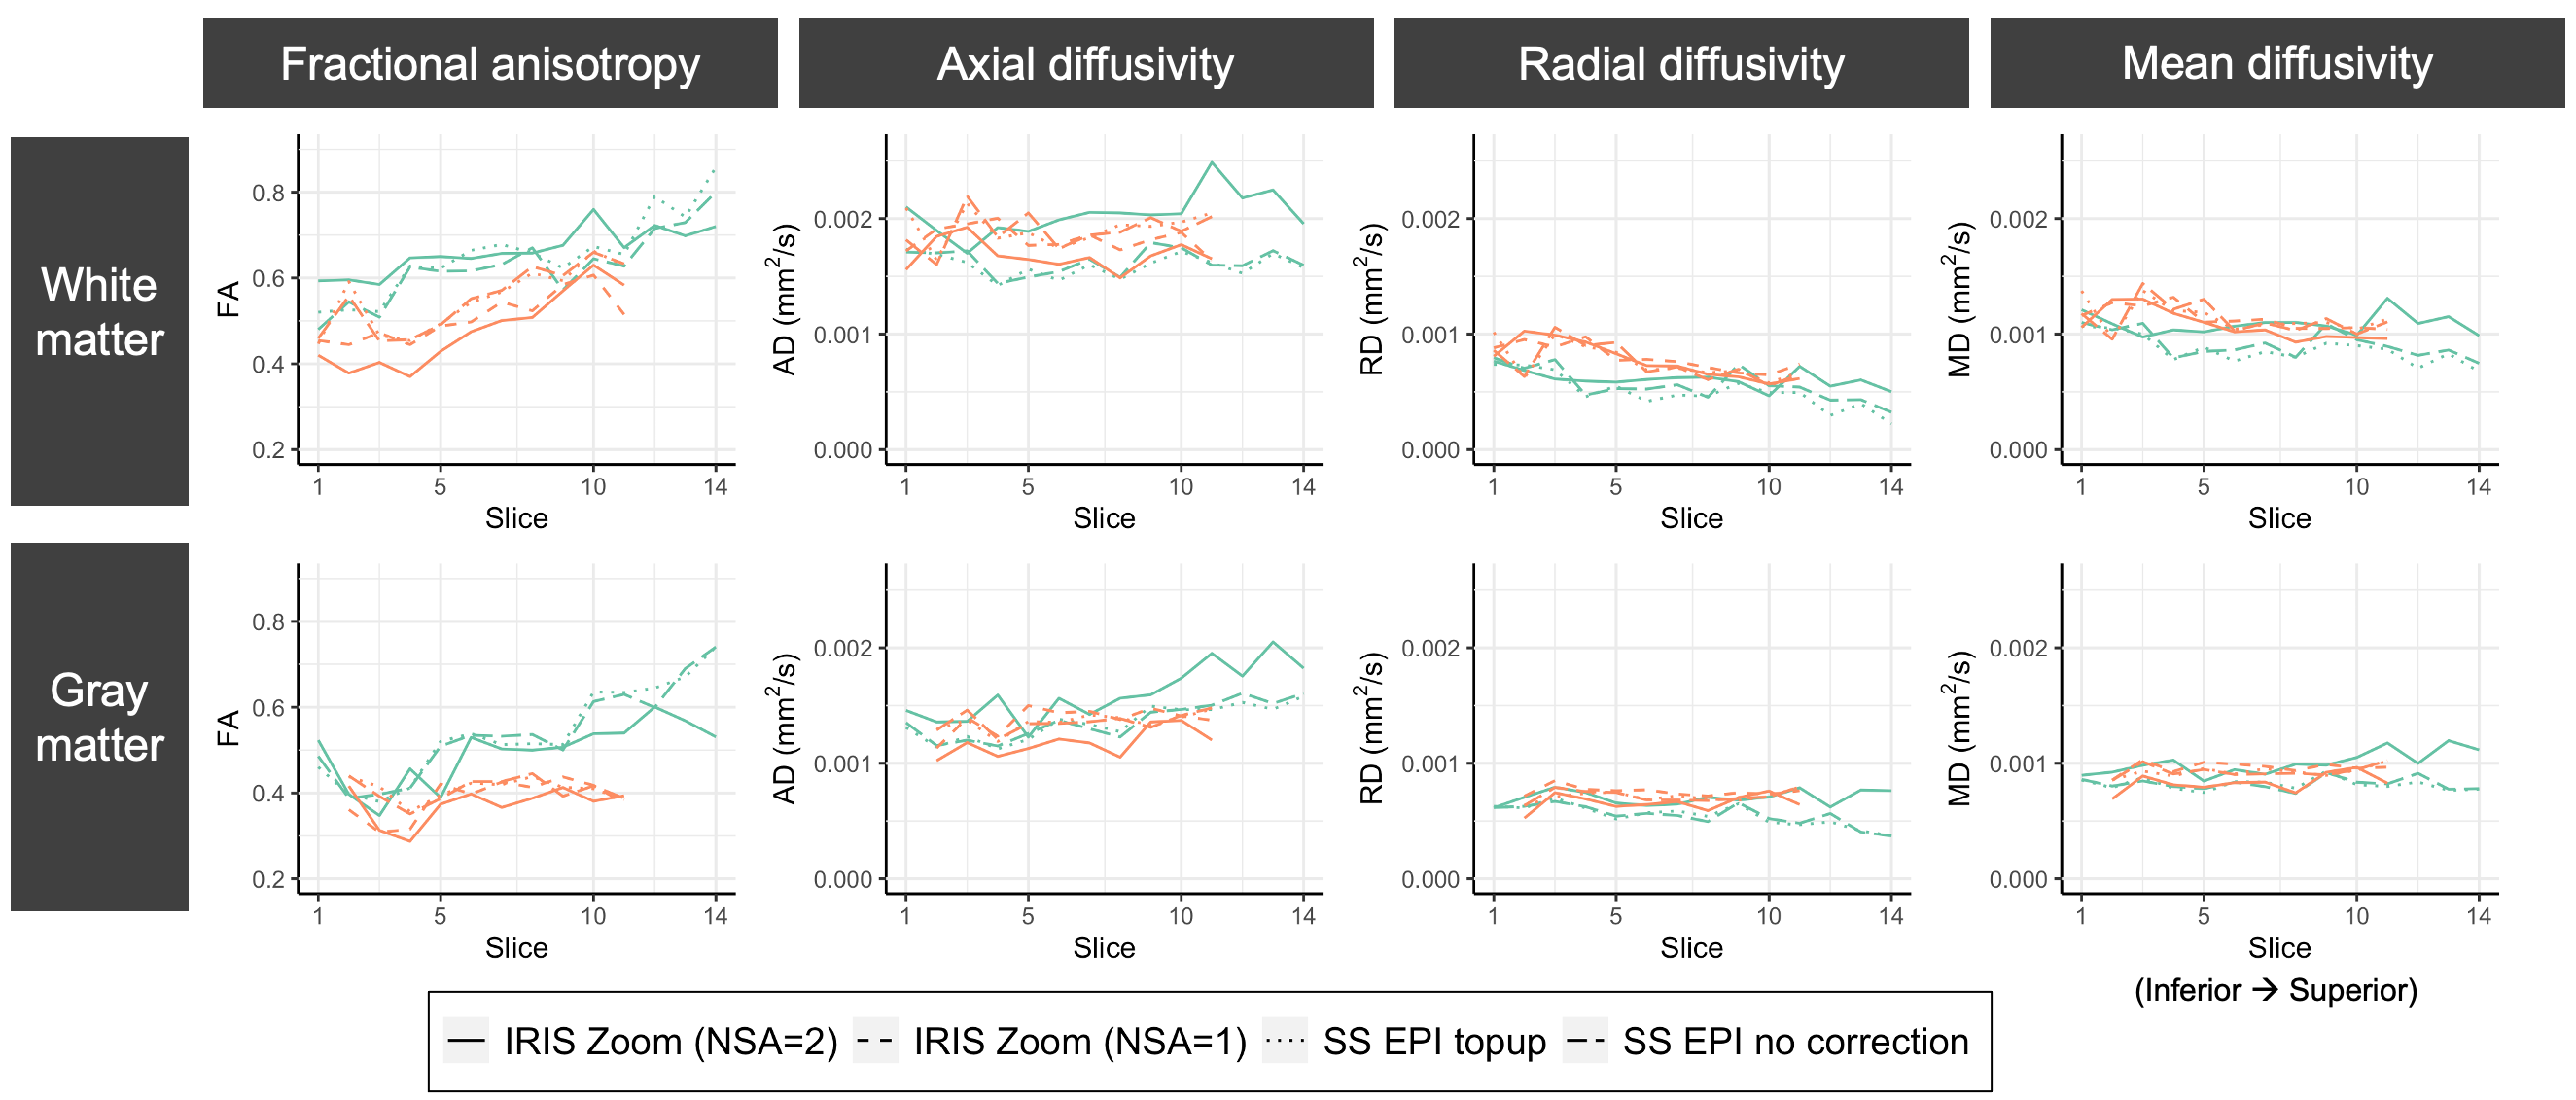
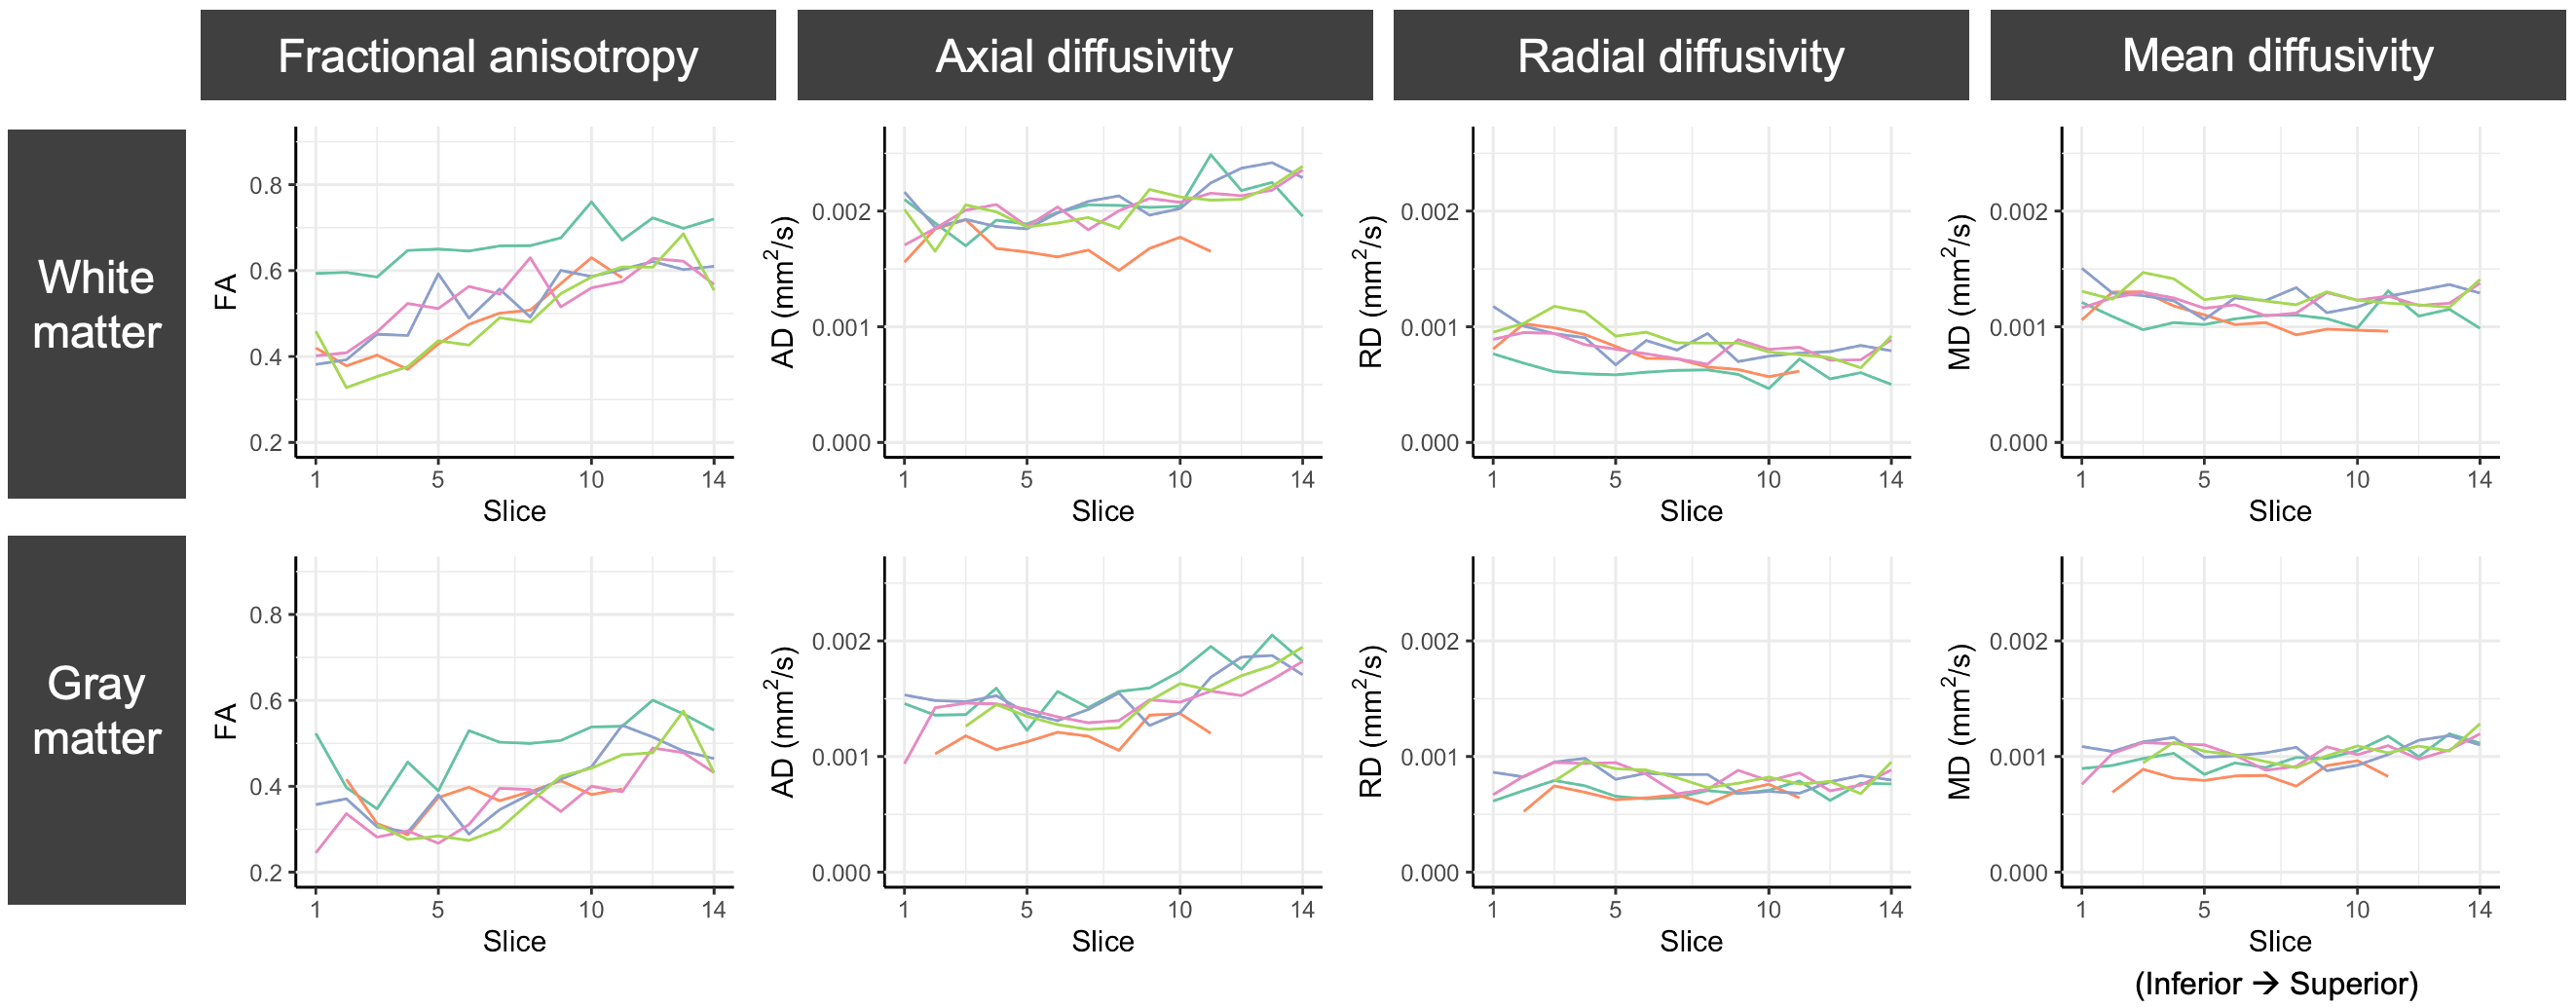
DTI parameter values for gray and white matter (slicewise means) are plotted for 2 subjects with multiple sequences and pre-processing strategies (Figure 4) and 5 subjects with the IRIS Zoom NSA=2 sequence (Figure 5). Subject differentiation is overall preserved across sequences, though there are differences in parameter estimates between sequences. In this pilot cohort of 5 subjects, the DTI values have expected gray/white matter contrast and are consistent across individuals.
Discussion
Despite advances in the cervical SC, little attention has been directed to DTI in the lumbar SC. In this pilot study, we explored the potential for a multi-shot, reduced FOV EPI method to improve high-resolution DTI of the lumbar SC by mitigating distortion. Though multi-shot EPI has a longer scanning time and may be more sensitive to bulk motion-induced phase errors than single-shot EPI, our data indicate we can achieve comparable image quality and intra-cord anatomy is less distorted with the IRIS Zoom sequence. Additionally, the DTI values we observed agree with those previously reported using single-shot EPI in the lumbar enlargement.13, 14 In ongoing work, we will evaluate scan-rescan reproducibility of multi-shot DTI, apply these sequences in MS patients with lumbar SC pathology, and investigate the potential for image denoising to compensate for acquiring fewer signal averages, which would make the multi-shot scan time more comparable to single-shot EPI.Acknowledgements
The authors thank all study participants, the Vanderbilt University Institute of Imaging Science (VUIIS) Center for Human Imaging, the VUIIS MRI technologists, and Dr. Guillaume Gilbert. This work was supported in part by funding from the National Institutes of Health under award numbers K01EB030039 (K.P.O.), 1K01EB032898 (K.G.S), 5R01NS109114 (S.A.S.), and 5R01NS117816 (S.A.S.).References
1. Wheeler-Kingshott CA, Hickman SJ, Parker GJ, et al. Investigating cervical spinal cord structure using axial diffusion tensor imaging. NeuroImage 2002; 16: 93-102. 2002/04/24. DOI: 10.1006/nimg.2001.1022.
2. Smith SA, Jones CK, Gifford A, et al. Reproducibility of tract-specific magnetization transfer and diffusion tensor imaging in the cervical spinal cord at 3 tesla. NMR in biomedicine 2010; 23: 207-217. DOI: 10.1002/nbm.1447.
3. Oh J, Zackowski K, Chen M, et al. Multiparametric MRI correlates of sensorimotor function in the spinal cord in multiple sclerosis. Multiple sclerosis 2013; 19: 427-435. DOI: 10.1177/1352458512456614.
4. By S, Xu J, Box BA, et al. Application and evaluation of NODDI in the cervical spinal cord of multiple sclerosis patients. NeuroImage Clinical 2017; 15: 333-342. DOI: 10.1016/j.nicl.2017.05.010.
5. Mossa-Basha M, Peterson DJ, Hippe DS, et al. Segmented quantitative diffusion tensor imaging evaluation of acute traumatic cervical spinal cord injury. Br J Radiol 2021; 94: 20201000. 2020/11/13. DOI: 10.1259/bjr.20201000.
6. Rutman AM, Peterson DJ, Cohen WA, et al. Diffusion Tensor Imaging of the Spinal Cord: Clinical Value, Investigational Applications, and Technical Limitations. Curr Probl Diagn Radiol 2018; 47: 257-269. 2017/09/05. DOI: 10.1067/j.cpradiol.2017.07.005.
7. Song SK, Sun SW, Ramsbottom MJ, et al. Dysmyelination revealed through MRI as increased radial (but unchanged axial) diffusion of water. NeuroImage 2002; 17: 1429-1436.
8. Wilm BJ, Gamper U, Henning A, et al. Diffusion-weighted imaging of the entire spinal cord. NMR in biomedicine 2009; 22: 174-181. 2008/08/30. DOI: 10.1002/nbm.1298.
9. Samson RS, Levy S, Schneider T, et al. ZOOM or Non-ZOOM? Assessing Spinal Cord Diffusion Tensor Imaging Protocols for Multi-Centre Studies. PloS one 2016; 11: e0155557. 2016/05/14. DOI: 10.1371/journal.pone.0155557.
10. Jeong HK, Gore JC and Anderson AW. High-resolution human diffusion tensor imaging using 2-D navigated multishot SENSE EPI at 7 T. Magnetic resonance in medicine 2013; 69: 793-802. DOI: 10.1002/mrm.24320.
11. Smith SM, Jenkinson M, Woolrich MW, et al. Advances in functional and structural MR image analysis and implementation as FSL. NeuroImage 2004; 23 Suppl 1: S208-219. 2004/10/27. DOI: 10.1016/j.neuroimage.2004.07.051.
12. De Leener B, Levy S, Dupont SM, et al. SCT: Spinal Cord Toolbox, an open-source software for processing spinal cord MRI data. NeuroImage 2017; 145: 24-43. DOI: 10.1016/j.neuroimage.2016.10.009.
13. Yiannakas MC, Grussu F, Louka P, et al. Reduced Field-of-View Diffusion-Weighted Imaging of the Lumbosacral Enlargement: A Pilot In Vivo Study of the Healthy Spinal Cord at 3T. PloS one 2016; 11: e0164890. DOI: 10.1371/journal.pone.0164890.
14. Vallotton K, David G, Hupp M, et al. Tracking White and Gray Matter Degeneration along the Spinal Cord Axis in Degenerative Cervical Myelopathy. J Neurotrauma 2021; 38: 2978-2987. 2021/07/10. DOI: 10.1089/neu.2021.0148.
Figures