0566
Automated cervical spinal cord atrophy detection from conventional 3D T1w brain MRI
Jonathan A. Disselhorst1,2,3, Michaela Andělová4, Veronica Ravano1,2,3, Gian Franco Piredda1,5,6, Tobias Kober1,2,3, Manuela Vaněčková7, and Bénédicte Maréchal1,2,3
1Advanced Clinical Imaging Technology, Siemens Healthineers International AG, Lausanne, Switzerland, 2Department of Radiology, Lausanne University Hospital and University of Lausanne, Lausanne, Switzerland, 3LTS5, École Polytechnique Fédérale de Lausanne (EPFL), Lausanne, Switzerland, 4Department of Neurology and Center of Clinical Neuroscience, First Faculty of Medicine, Charles University and General University Hospital, Prague, Czech Republic, 5Human Neuroscience Platform, Fondation Campus Biotech Geneva, Geneva, Switzerland, 6CIBM-AIT, École Polytechnique Fédérale de Lausanne (EPFL), Lausanne, Switzerland, 7Department of Radiology, First Faculty of Medicine, Charles University and General University Hospital, Prague, Czech Republic
1Advanced Clinical Imaging Technology, Siemens Healthineers International AG, Lausanne, Switzerland, 2Department of Radiology, Lausanne University Hospital and University of Lausanne, Lausanne, Switzerland, 3LTS5, École Polytechnique Fédérale de Lausanne (EPFL), Lausanne, Switzerland, 4Department of Neurology and Center of Clinical Neuroscience, First Faculty of Medicine, Charles University and General University Hospital, Prague, Czech Republic, 5Human Neuroscience Platform, Fondation Campus Biotech Geneva, Geneva, Switzerland, 6CIBM-AIT, École Polytechnique Fédérale de Lausanne (EPFL), Lausanne, Switzerland, 7Department of Radiology, First Faculty of Medicine, Charles University and General University Hospital, Prague, Czech Republic
Synopsis
Keywords: Spinal Cord, Segmentation, atrophy
Detecting atrophy in the spinal cord (SC) is highly relevant in multiple sclerosis (MS) and other neuroinflammatory and neurodegenerative diseases. The most used method is measuring mean upper cervical cord area (MUCCA) from SC images. MRI of SC is time consuming and not always available. We recently developed a method to measure MUCCA directly from conventional T1w brain images. This work compares MUCCA estimates derived from MPRAGE and MP2RAGE sequences, determine reference ranges from 98 healthy subjects and show their value to detect atrophy in patients with progressive MS and neuromyelitis optica. We observe very high agreement between methods.Introduction
Measures of spinal cord (SC) damage including atrophy are increasingly important biomarkers in the assessment of multiple sclerosis (MS) and other neuroinflammatory and neurodegenerative diseases and are therefore of clinical significance [1]. MRI can be used to measure the mean upper cervical cord cross-sectional area (MUCCA) as a marker of atrophy. For this, dedicated SC imaging may be used. However, it can also be measured on the cervical SC on conventional brain imaging, where the typical field of view includes the cervical spine down to the 4th vertebra (C4). We have developed a fully automated method to determine the MUCCA as well as anteroposterior and left-right diameters from MPRAGE brain scans [2]. For complex assessment of SC pathology, the volumetric analysis should be combined with quantitative techniques to assess microstructural damage of SC tissue. To this end, we also investigated processing MP2RAGE [3] images which provide both anatomical contrast and a T1 map for quantitative assessment. We also established reference ranges for MUCCA from 98 healthy controls and compared two patient groups with a total size of 91 individuals.Objectives
To compare cervical spinal cord segmentation in MPRAGE and MP2RAGE brain scans. To obtain reference ranges of spinal cord area from healthy controls. To compare the SC area in patients to reference ranges.Methods
Ninety-eight healthy subjects (63F/35M, age 38±10 y at first scan) were scanned in a 3T MRI (MAGNETOM Skyra, Siemens Healthcare, Erlangen, Germany). Each subject was scanned up to 4 times (2.4±0.9) for a total of 233 acquisitions with an average total follow-up period of 3.4±0.9 years (2.0±0.9 years between consecutive scans). Each scan session included an MPRAGE and MP2RAGE sequence (See Table 1 for Acquisition parameters).In addition, 57 patients with progressive MS (38F/19M, age 49±7 y) and 34 patients with neuromyelitis optica (NMOSD, 23F/11M, age 44.4±14 y) were scanned with the same sequences.
Automated SC segmentation and MUCCA evaluation was performed as described previously [2] for MPRAGE images. The same processing pipeline was applied to both the MP2RAGE GRE2 image and the multiplication of GRE2 with UNI image which naturally lowers background noise intensities of the UNI image [4]. MUCCA was determined for each complete vertebral level present in the FOV.
To detect outliers before building reference ranges, the ratio between MPRAGE and MP2RAGE SC areas was calculated for each vertebral segment in the healthy control subjects; outliers were defined as those being more than 4 standard deviations from the population mean. For each of the three image contrasts, reference ranges of SC area were determined as a function of age at each vertebral level for both sexes separately. Slope and intercept were obtained through linear least squares, variance was assumed to be age-independent. All fits were performed 100 times, randomly selecting a single time point for each subject to estimate stability of the reference ranges. For subsequent patient group comparison, mean slope, intercept, and standard deviation were considered for each reference range.
The MUCCAs for each patient in the MS and NMOSD groups were estimated for each of the three image contrasts and compared to the corresponding reference ranges by means of Z-Scores (number of standard deviations away from the healthy population mean).
Results
An example healthy subject for the three different contrasts is shown in Figure 1. Measurements of the MUCCA in healthy subjects are shown in Figure 2. In total 5 outlying segments were removed from healthy subjects, all in the lower cervical vertebral levels and caused by motion or shoulder aliasing artifacts. A larger variation was observed in male subjects, possibly because fewer subjects were available. Shapiro-Wilk tests of the residuals showed no significant departure from normality, except in C1 for women. Significant differences between the three image types were found in the reference range parameters, especially in the intercept (Figure 3). Despite these differences, Z-Scores could be calculated for the two groups of patients; a representative example for vertebral level C2 is shown in Figure 4. No significant differences could be found between the three image contrasts. Z-Scores significantly lower than zero could be found in the NMOSD group for C2-C4 and the Progressive MS group for C1-C4 for all three contrasts (p<0.0002).Conclusion
Our results show that automated cervical spinal cord segmentation and analysis from conventional brain images can be used to detect atrophy in progressive MS and NMOSD patients, similar to previous studies [5]. Reference ranges can be created and applied based on both MPRAGE and MP2RAGE images. We note, however, that a simple difference of contrast-to-noise ratio, i.e., main difference between the three input image scenarios under study, systematically biases results of MUCCA estimates and suggests that strict MR parameters selection should be required for atrophy detection (Figure 1). Alternatively, compensatory algorithms could be included into the reference model to avoid sequence-related bias. As MP2RAGE simultaneously provides quantitative T1 values, it is a natural candidate sequence for multiparametric imaging that will combine volumetric and quantitative information of microstructural pathology. Future work will also investigate extension of the reference range to lower vertebral levels, and its application to detect atrophy in other pathologies.Acknowledgements
This project was supported by Roche (healthy controls), Czech Ministry of Health project grants NV22-04-00193, RVO 64165 and Czech Ministry of Education - Cooperatio, 1.LF, NeuroscienceReferences
- Andelova et al. “Additive effect of spinal cord volume, diffuse and focal cord pathology on disability in multiple sclerosis”. Front. Neurol. 10, (2019). doi: 10.3389/fneur.2019.00820
- Disselhorst et al. “Validation of an automated cervical spinal cord segmentation in brain MRI” ECTRIMS 2021
- Marques et al. “MP2RAGE, a self bias-field corrected sequence for improved segmentation and T1-mapping at high field”. NeuroImage. 2010; 49:1271-1281. doi:10.1016/j.neuroimage.2009.10.002
- Fujimoto et al. “Quantitative comparison of cortical surface reconstructions from MP2RAGE and multi-echo MPRAGE data at 3 and 7T”. NeuroImage. 2014; 90:60-73. doi:10.1016/j.neuroimage.2013.12.012
- Liu et al. “Differential patterns of spinal cord and brain atrophy in NMO and MS”. Neurology 2015; 84, 1465–1472. doi: 10.1212/WNL.0000000000001441
Figures
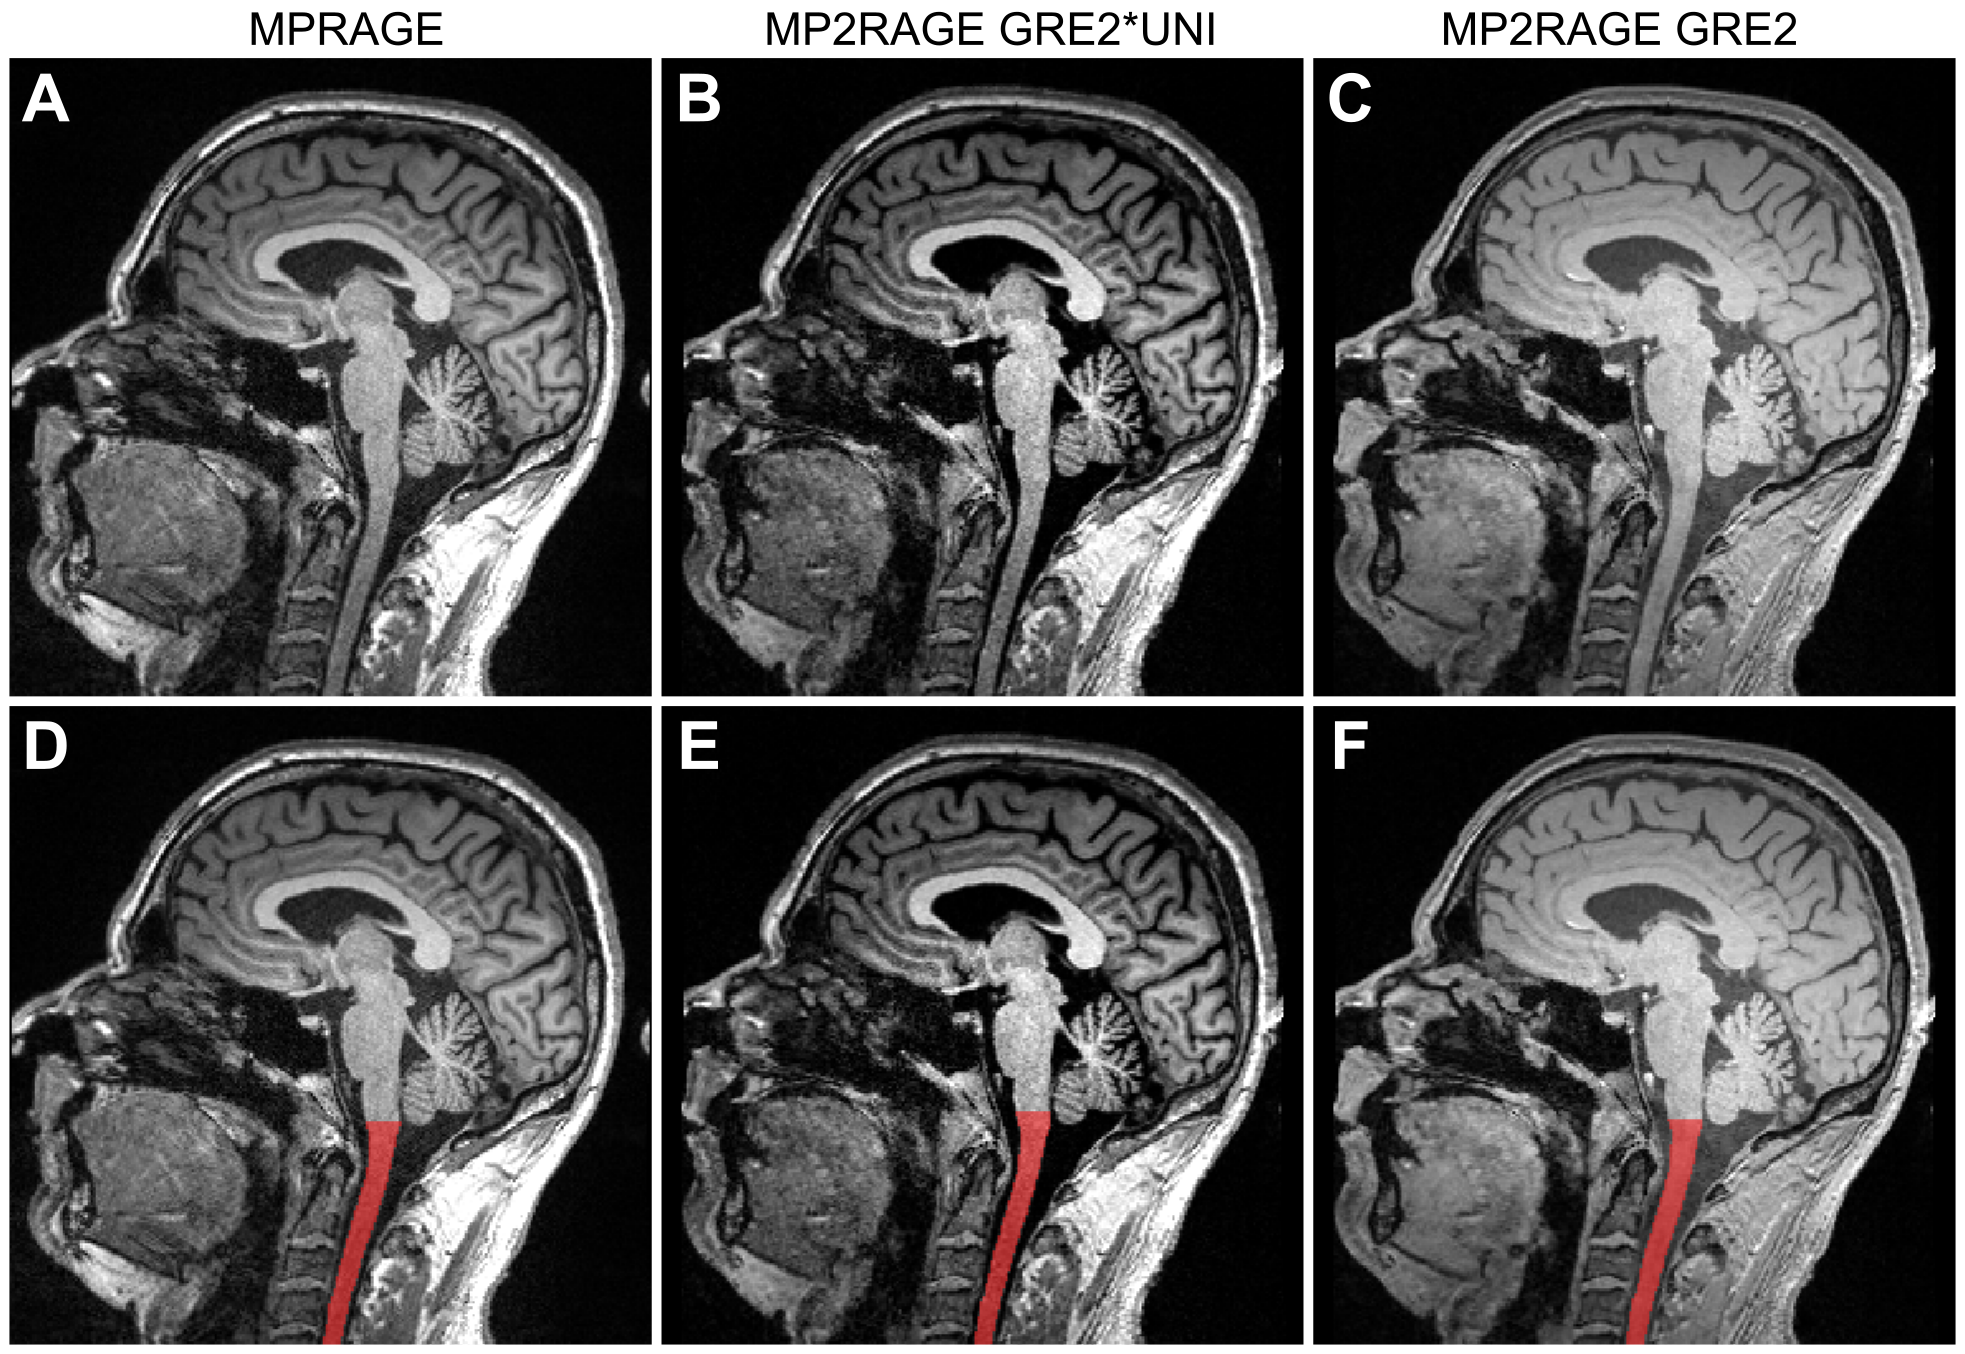
Figure 1. Sagittal slice
showing the spinal cord in the three different contrasts: A/D: MPRAGE, B/E: MP2RAGE GRE2*UNI, C/F: MP2RAGE GRE2. The bottom row (D,E,F) shows the spinal cord segmentation
as overlay.
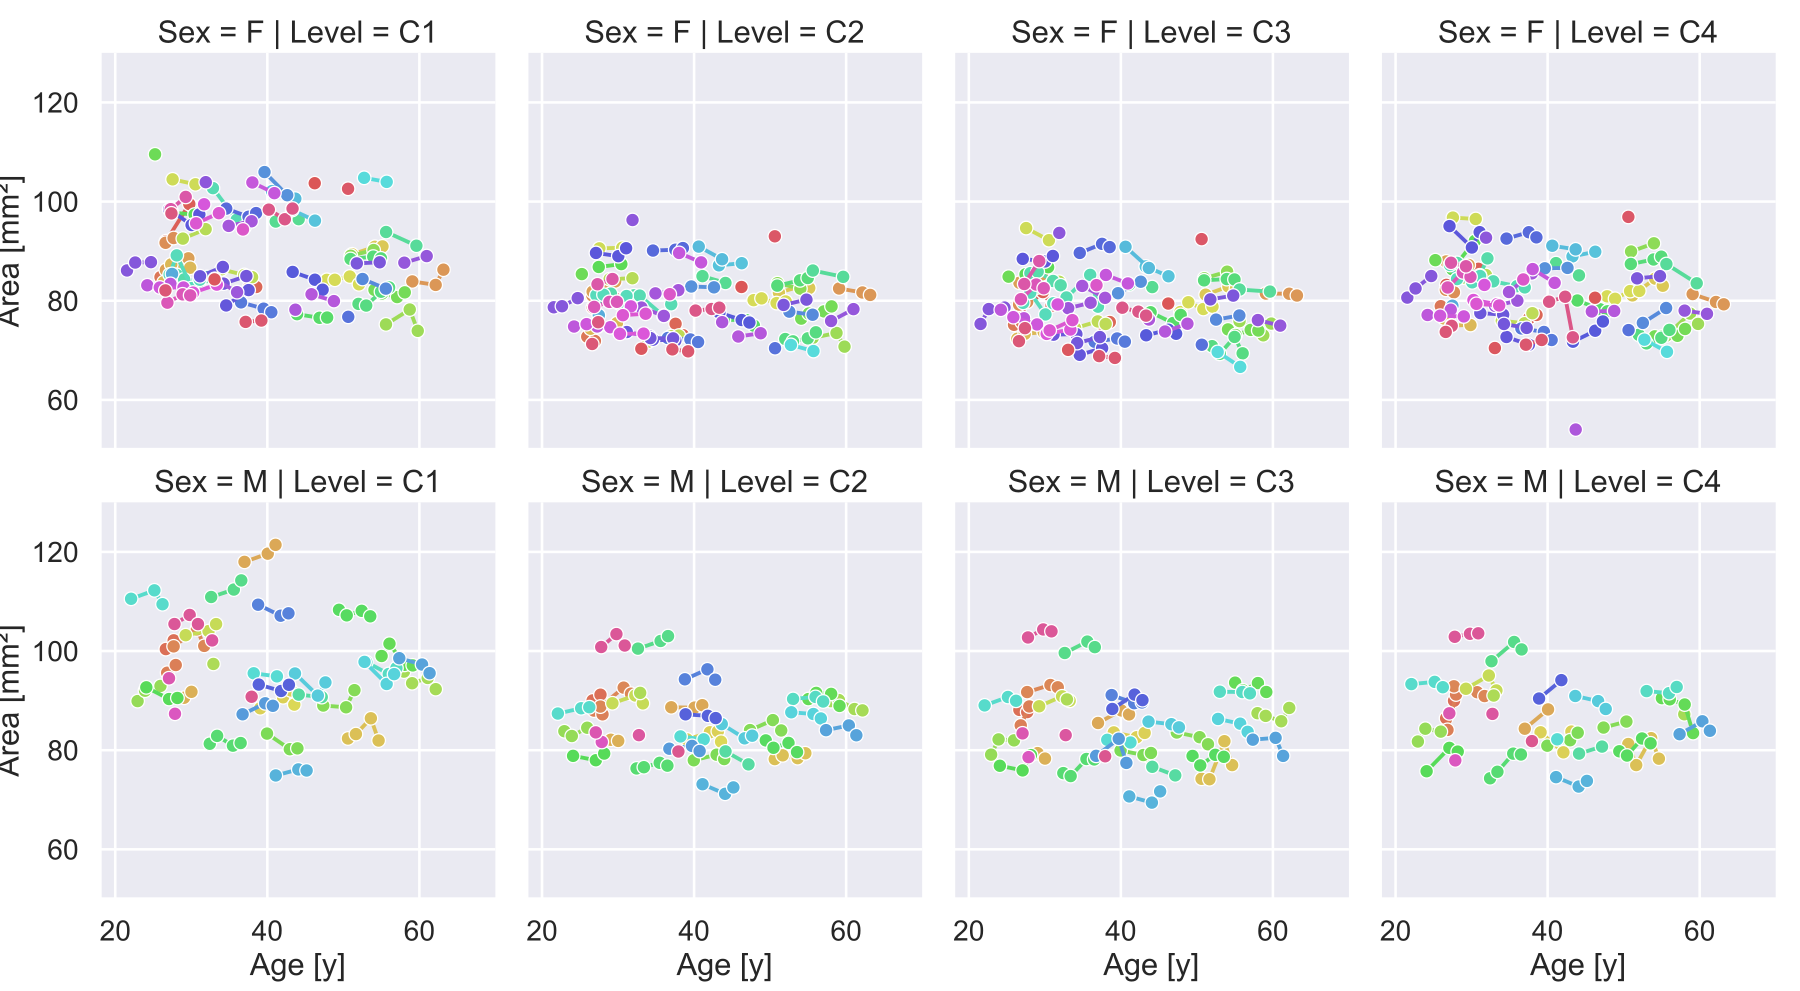
Figure 2. Spinal cord area for all
healthy controls obtained on MPRAGE images. Measurements are indicated with a
circle, those obtained from a single subject are connected with a line.
Outliers are included in this figure.
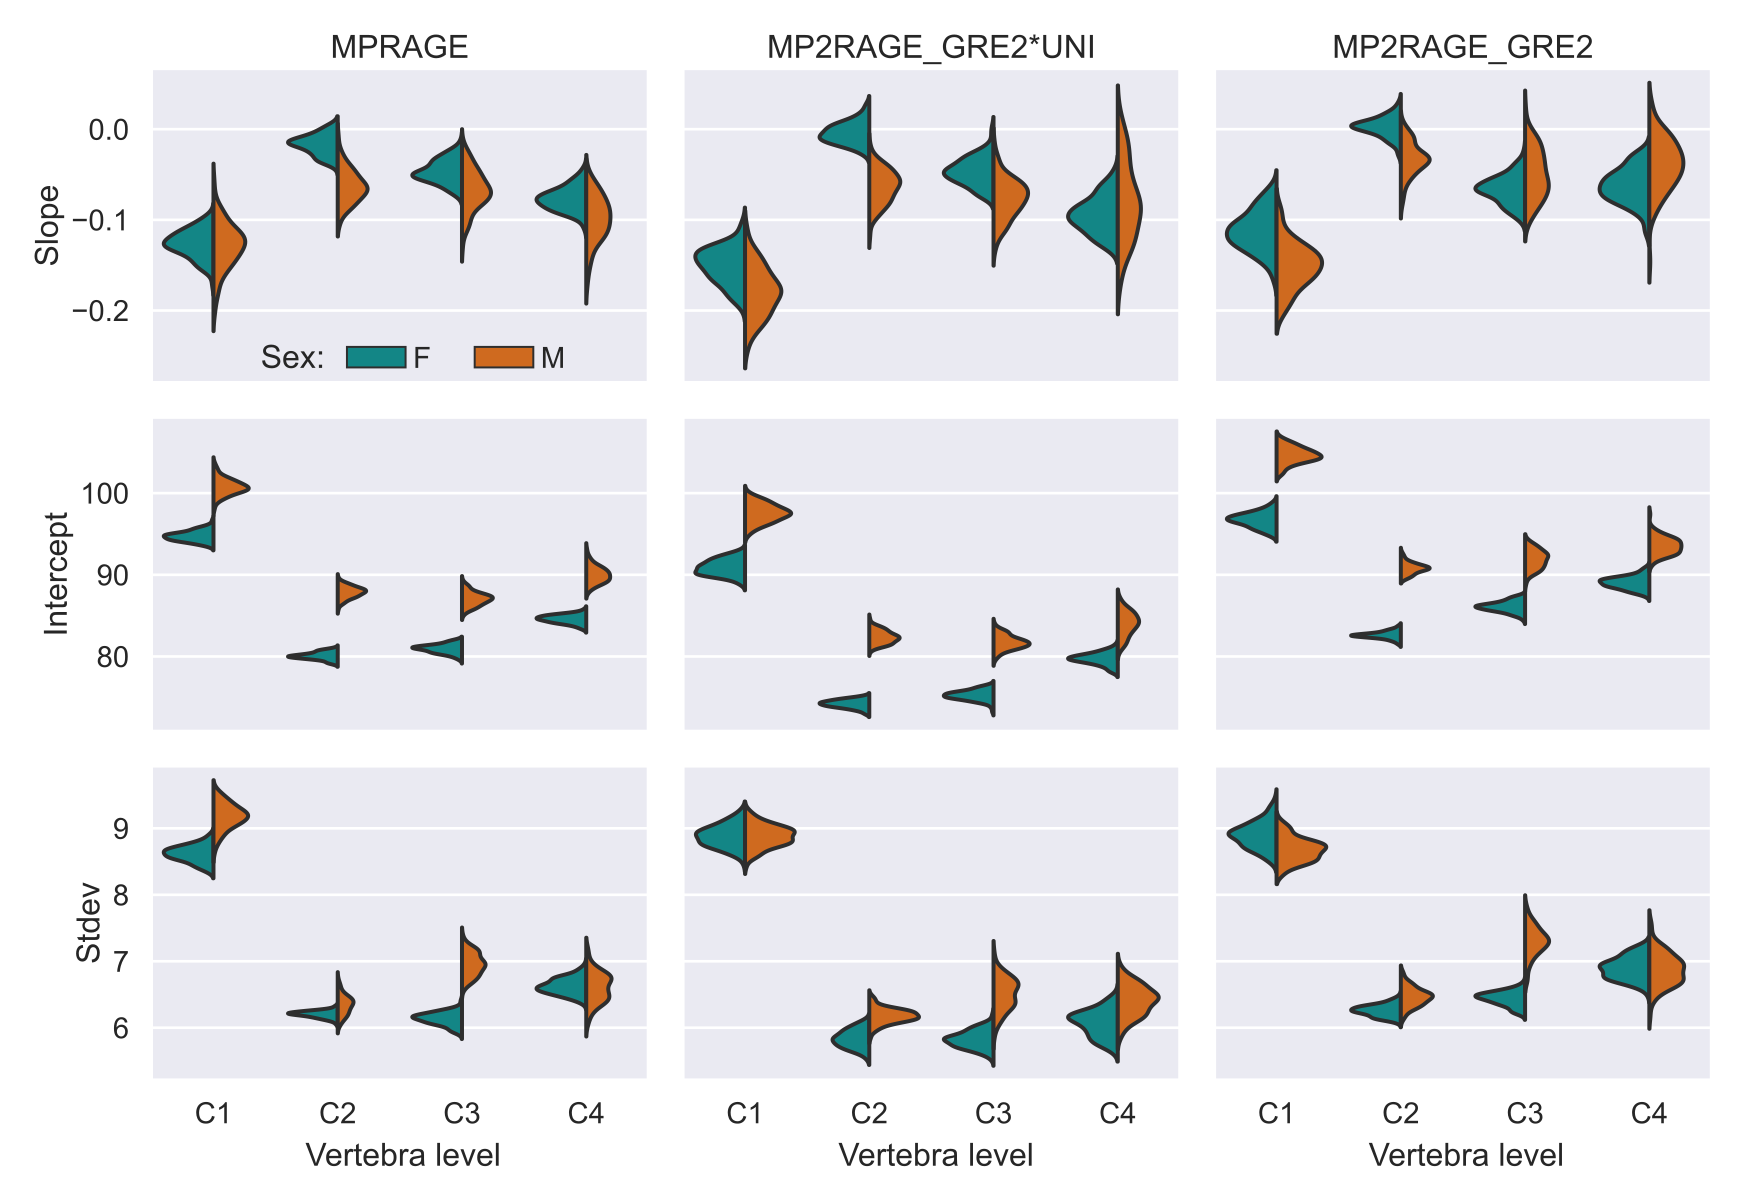
Figure 3. Slope and intercept of the spinal cord area as function of age, and the
standard deviation obtained in three types of images in normal population for
C1 to C4 levels. The different columns represent the different image contrasts.
Fits were repeated 100×, with the variation in the results shown as a density
plot.
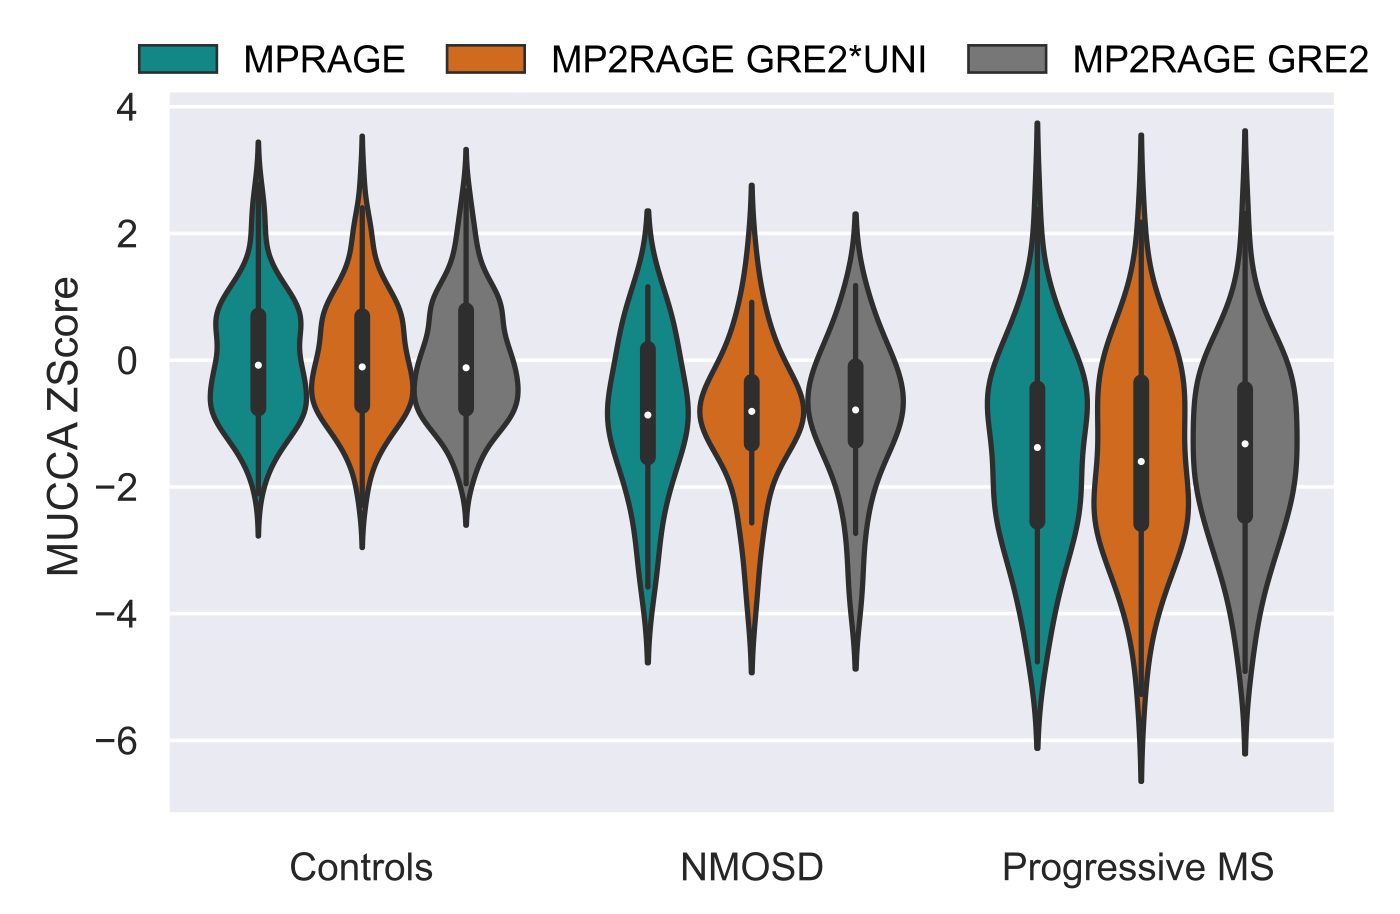
Figure 4. MUCCA Z-Score
distributions in healthy controls, patients with NMOSD and progressive MS for
all three input image scenarios. Only vertebral level C2 is shown.
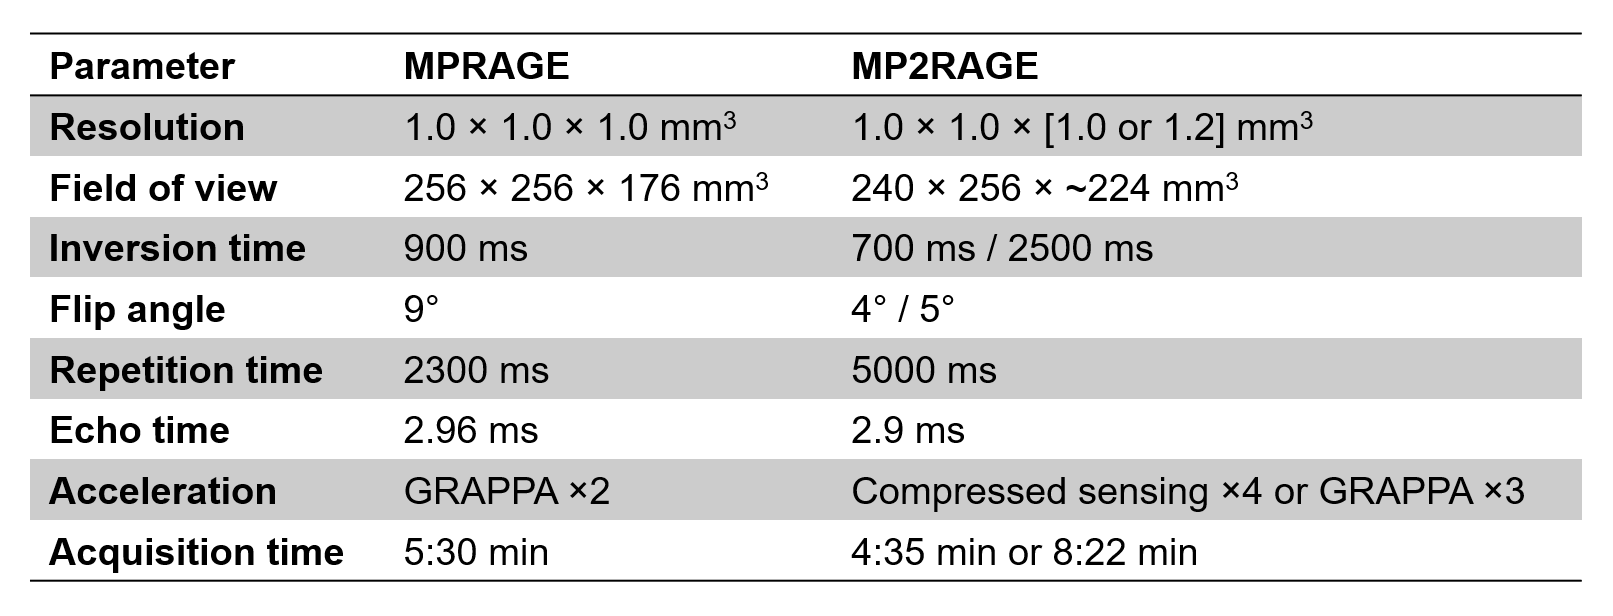
Table 1. Acquisition
parameters of the MPRAGE and MP2RAGE.
DOI: https://doi.org/10.58530/2023/0566